Sales and Distributor Alignment in FMCG: Closing the Gap Between Primary Sales and Outlet Execution
Turn this article into takeaways for your work.


Each assistant summarizes the article only for you and suggests best practices for your work.
The distributor who hits primary sales targets while your shelf is empty is not an aligned partner. They're a logistics provider who's been rewarded for loading their warehouse rather than stocking your outlets.
This is the central alignment failure in FMCG distribution, and it's more common than most sales directors want to admit. Primary sales, the volume shipped from manufacturer to distributor, is the metric most channel contracts optimize for. It's easy to measure, easy to invoice, and easy to pay commission on. But primary sales measure warehouse movement, not outlet availability. And outlet availability is where consumer purchase happens.
The distributor understands this gap perfectly. Their business model optimizes working capital. They take product in when your pricing and credit terms make it attractive, and they push it out at a pace that fits their delivery schedule and margin structure. If that pace doesn't match your brand's optimal replenishment cycle at the outlet, your shelf suffers while their primary sales number looks fine.
But this isn't a distributor character problem. It's a governance design problem. When contracts, incentives, and KPIs are built around primary off-take alone, you get behavior optimized for primary off-take. Fix the structure, and execution follows.
Why Do Manufacturer and Distributor Incentives Diverge?
Key Facts: Distributor Alignment and Revenue Impact
- McKinsey research on commercial excellence in consumer goods identifies shared scorecards with distribution partners as a practice associated with leading CPG companies, aligning on category-level metrics rather than brand-specific shipment targets alone. (McKinsey, Winning with Commercial Excellence in Consumer Goods)
- 45 percent of consumers switch to a competing brand when their preferred product is unavailable, a direct downstream consequence of distributor-to-outlet fill-rate failures that don't appear in primary sales reports. (TELUS Consumer Goods, Food and Beverage Study, 2026)
- [Estimate, no universal published source] Field distribution management practice uses 35 days of stock on hand as an indicative early-warning threshold for primary-to-secondary sales misalignment: when distributor stock-on-hand exceeds 35 days of average sell-out, the distributor may be stocking in rather than selling through, and outlet availability may be deteriorating while primary off-take looks healthy. Treat this as a planning diagnostic, not a measured industry benchmark.
The incentive divergence is structural. Understanding it is the starting point for designing governance that corrects it.
The manufacturer optimizes for consumer availability and market share. You need your product on the shelf, in the right outlets, at the right price, in sufficient stock to fulfill demand when it arises. Your brand health metrics are distribution coverage, shelf share, OOS rate, and sell-out velocity. These require the distributor to serve outlets on a defined frequency, maintain stock depth, enforce pricing compliance, and report back on what's happening at the outlet level.
The distributor optimizes working capital and margin per delivery route. The distributor's business model is based on the spread between buying price and selling price, multiplied by volume, minus delivery cost. To maximize this, they prefer larger, less frequent deliveries (lower delivery cost per unit), selective outlet service (high-volume accounts first, low-volume accounts skipped or monthly), and product mix optimization toward their highest-margin SKUs, which may not be your priority brands.
These two sets of incentives are compatible when the manufacturer has designed the right structure. But they're incompatible when the relationship is managed purely on a primary sales target with no secondary accountability.
Primary sales vs. secondary sales as competing scorecards. Primary sales measure the manufacturer-to-distributor flow. Secondary sales measure the distributor-to-outlet flow. Most FMCG manufacturers have good primary sales visibility because it comes from their own invoicing system. Many have weak or delayed secondary sales visibility because it depends on data the distributor provides, which may be incomplete, delayed, or formatted inconsistently. Without secondary sales and stock visibility, you can't see whether the product the distributor bought from you last month ever reached the outlets in their territory. You're flying blind on the last mile.
Quotable Nuggets
- "Leading CPG companies develop shared scorecards with distribution partners, aligning on category-level metrics rather than brand-specific shipment targets alone.", McKinsey, Commercial Excellence in Consumer Goods (paraphrased)
- "Winning partners spend the majority of joint review time on strategic initiatives, not just on delivering the annual plan (a shift that requires shared KPIs going beyond volume.") McKinsey, Power Partnerships
- "Distributors who resist secondary data sharing are almost always protecting information that reveals performance gaps.", FMCG channel management principle
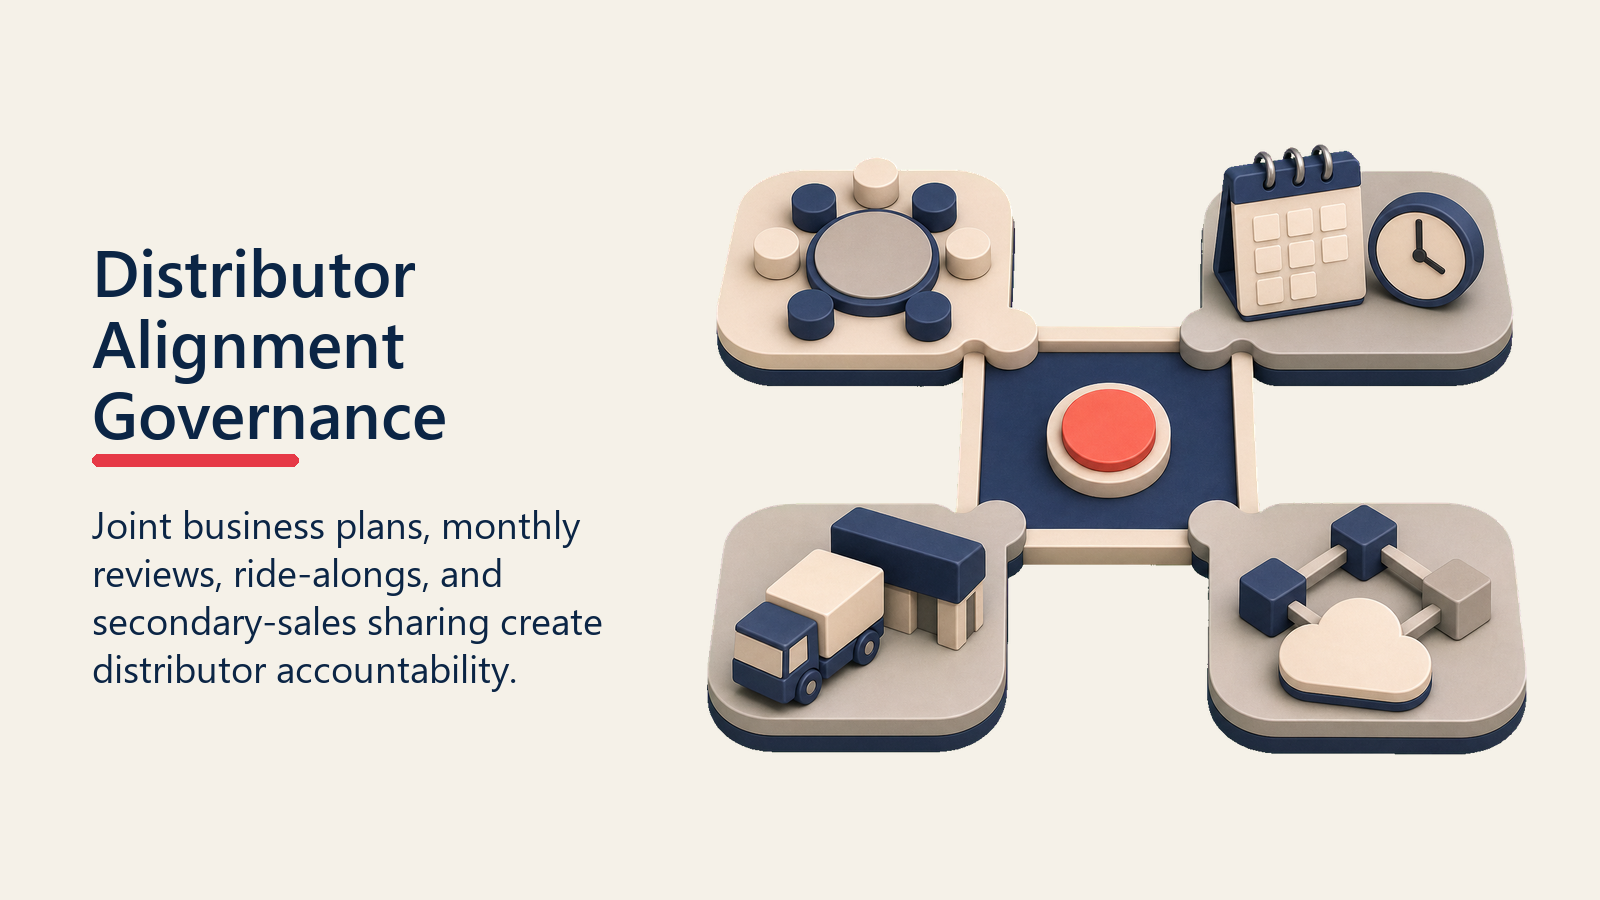
The JBPM Alignment Framework (Joint Business Plan + Monthly Review): The two-mechanism core of distributor governance. The Joint Business Plan documents shared targets, primary off-take, secondary sales, numeric distribution, must-sell compliance, OOS rate by tier, and call frequency, with both parties' signatures. The Monthly Review is where the JBP is either enforced or ignored: a structured 60-minute session with a signed action log, owned equally by manufacturer and distributor management. Organizations that run both mechanisms consistently close the primary-to-secondary sales gap faster than those running either one alone.
Governance Framework: The Four Operating Mechanisms That Create Alignment
Alignment isn't a relationship outcome. It's a structure outcome. These four mechanisms, built into how you operate with distributors, create the behavioral accountability that primary sales targets alone cannot.
1. Joint Business Plan with Shared KPIs
A joint business plan (JBP) is a 12-month operating agreement between the manufacturer and distributor that documents shared targets, investment commitments, and review cadence. It replaces the implicit "sell us as much as you can" arrangement with an explicit scorecard that both parties sign up to.
A JBP for an FMCG distributor relationship should include:
- Primary off-take target by quarter by brand category (the baseline)
- Secondary sales target by quarter by outlet tier (what actually needs to reach the shelf)
- Numeric distribution target by SKU for the distributor territory
- Must-sell compliance target as a percentage of outlets carrying priority SKUs
- OOS rate commitment by outlet tier (A-outlets below 3%, B-outlets below 5%)
- Call frequency commitment by outlet tier (A-outlets weekly, B-outlets bi-weekly, etc.)
- Investment allocation from manufacturer for promotional execution and trade schemes
The JBP becomes the reference document for every monthly distributor review meeting. Without it, monthly reviews are relationship conversations. With it, they're performance management sessions with a shared baseline.
2. Monthly Distributor Review Meeting
The monthly review is where the JBP is either enforced or ignored. The structure of the meeting determines which.
| Agenda Item | Owner | Duration | Output |
|---|---|---|---|
| Prior month primary and secondary sales vs. target | Manufacturer sales ops | 10 min | Variance report by SKU and outlet tier |
| Numeric distribution coverage vs. target | Distributor sales manager | 10 min | Outlets added, outlets lost, net coverage change |
| OOS rate review by territory | Joint review | 10 min | OOS events by cause; corrective actions assigned |
| Must-sell compliance vs. target | Distributor area manager | 10 min | SKUs below compliance; outlet names and actions |
| Returns rate and stock freshness | Distributor operations | 5 min | Expired units, return volumes, FIFO issues |
| DSR (distributor sales rep) ride-along schedule for the coming month | Both parties | 5 min | Dates, territories, rep pairings confirmed |
| Scorecard update and commitment for next month | Both parties | 10 min | Written commitments from both sides |
Total time: 60 minutes. Attendance is non-negotiable: the manufacturer's channel manager and sales operations lead, the distributor's general manager and area sales manager. Monthly reviews that only have junior staff from one side become report-reading sessions with no decision authority.
The meeting output is not a recap email. It's a signed action log with owner names and due dates.
3. Field Time Sharing: DSR Ride-Alongs
The fastest way to understand what a distributor's DSR (distributor sales representative) actually does in an outlet is to ride with them. Manufacturer reps who never spend time in the distributor's field operation are managing a relationship on the basis of reports. Reports that the distributor produces.
A field time-sharing program commits both parties to a defined number of joint call days per month. The manufacturer's area manager or channel rep rides with the distributor's DSR on their regular route, observes the call execution, and audits outlet conditions in real time. This does several things:
- It reveals whether the distributor's DSRs are following the call frequency and outlet service standards in the JBP
- It identifies in-outlet execution issues (wrong shelf positioning, missing POS, unrotated stock) that don't appear in any report
- It builds a working relationship between manufacturer and distributor field staff that makes the monthly KPI conversation less adversarial
- It provides the manufacturer with ground-truth data to validate secondary sales reports
The standard commitment for a mid-tier distributor relationship is 4-6 joint field days per month. For key distributors covering high-volume territories, 8-10 days is appropriate. These days should be scheduled in the JBP, not left as an ad-hoc agreement. See distributor management and ROI for how to frame the ROI case for this investment in distributor development.
4. Secondary Sales Data Sharing
The data governance component is often the weakest link. What should a distributor report, how often, and in what format?
Minimum reporting requirements for aligned distributor partnerships:
- Weekly secondary sales report: units sold from distributor to outlet by SKU, by outlet, by territory
- Monthly outlet coverage report: full list of serviced outlets with last order date, last delivery date, SKUs carried
- Monthly OOS exception report: outlets where stock was unavailable at time of DSR visit, by SKU
- Monthly returns and damages report: units returned from outlets, classified by reason (expired, damaged, over-ordered)
Distributors who resist secondary data sharing are almost always protecting information that reveals performance gaps. The right response is to make secondary data sharing a contract requirement, not a request, and to link incentive payments (see below) to timely, complete reporting.
Demand planning and field alignment becomes dramatically more accurate when secondary sales data is flowing reliably. Without it, the manufacturer's demand plan is based on primary off-take patterns that may not reflect actual outlet sell-out at all. These four mechanisms together feed directly into the scorecard structure that follows.
Distributor Scorecard: KPIs by Category
A distributor scorecard translates the JBP commitments into a monthly performance tracking tool. These are the KPIs that belong on every distributor scorecard.
| KPI Category | Metric | Target | Measurement Source |
|---|---|---|---|
| Volume | Primary off-take vs. target (%) | 100% | Manufacturer invoicing |
| Volume | Secondary sales vs. target (%) | 100% | Distributor secondary report |
| Coverage | Numeric distribution vs. target (%) | 100% | SFA records + distributor coverage report |
| Coverage | Must-sell SKU compliance (%) | Above 90% | Field audit + distributor data |
| Quality | OOS rate by outlet tier | A below 3%, B below 5% | Joint field audits + distributor OOS report |
| Quality | Call frequency compliance by outlet tier | Above 95% | Distributor route reports |
| Quality | Returns rate (% of secondary sales) | Below 2% | Distributor returns report |
| Reporting | Secondary data submission timeliness | Within 5 working days of month-end | Received date vs. due date |
The scorecard should show current month, prior month, and year-to-date trend for each metric. A traffic-light rating (green/amber/red) makes it immediately clear where the distributor is performing and where they're not. FMCG sales KPIs and metrics provides the full measurement framework for integrating these distributor KPIs into the territory performance picture.
How Should Distributor Contracts Be Structured to Drive Sell-Through Behavior?
The contract and incentive structure is where alignment either gets baked in or doesn't. Most FMCG distributor contracts pay on primary off-take. Full stop. That's why the behavior you get is primary-off-take-optimized. McKinsey's work on manufacturer-retailer and manufacturer-distributor partnerships finds that winning partners spend the majority of joint review time on strategic initiatives, not just on delivering the annual plan, a shift that requires shared KPIs going beyond volume.
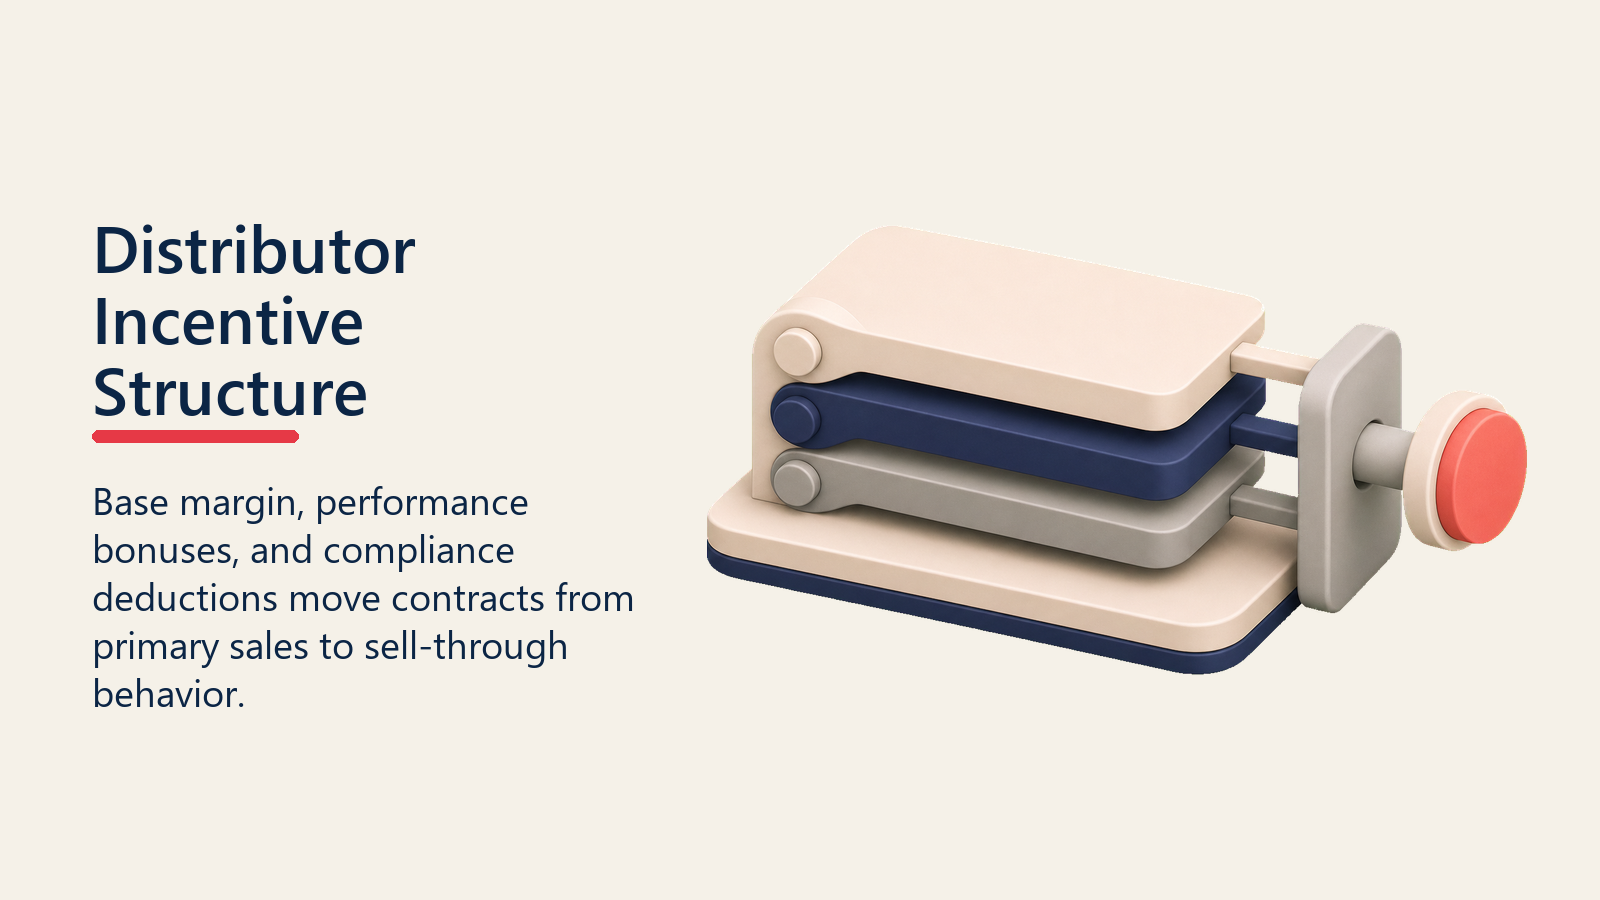
A well-designed incentive structure has three layers:
Base margin for handling and distribution, paid on all primary off-take. This is the baseline that keeps the distribution relationship viable.
Performance-linked bonus margin tied to secondary sales achievement, numeric distribution target attainment, and must-sell compliance rate. These bonuses are paid quarterly, not monthly, which aligns the distributor's attention span with the outcomes that matter. A distributor who achieves secondary sales target, distribution target, and must-sell compliance in all three months of a quarter receives the full bonus margin on top of base. A distributor who achieves primary off-take but misses secondary and distribution targets receives base only.
Compliance deductions for documented failure to meet contractual service commitments: missed call frequency, late secondary data submission, OOS rate above threshold in A-tier outlets. Deductions should be modest but visible, enough to signal that non-compliance has a cost, not enough to threaten the distributor's business viability.
The incentive redesign conversation is the hardest part of building distributor alignment. Distributors who've operated under primary-only incentives resist the shift to secondary and coverage accountability. They'll argue that secondary data is unreliable, that OOS is caused by the manufacturer's supply chain, and that distribution targets require investment the manufacturer should fund. Some of those arguments have merit. The response is to phase in the new structure over two contract cycles, start with the bonus components before introducing deductions, and invest in data quality before making secondary metrics contract-consequential.
Common Alignment Failures: Diagnostic Checklist
These are the most common failure modes in manufacturer-distributor relationships. Use this as a diagnostic before your next distributor review.
| Failure Mode | Symptoms | Root Cause | Fix |
|---|---|---|---|
| No secondary data visibility | Manufacturer can't see if product reached outlets | No data-sharing requirement in contract | Make secondary reporting a contract term; audit data quality |
| No joint targets | Distributor tracks own metrics, manufacturer tracks different ones | JBP absent or not operationalized | Build JBP; make both parties sign off on shared targets |
| Primary sales as sole success metric | Distributor loads warehouse, outlets are empty | Contract and bonus structure rewards shipments, not sell-out | Redesign incentives to include secondary and coverage KPIs |
| Monthly review with no consequence | Same issues appear month after month | Review meeting has no action log or escalation protocol | Require signed action log; escalate repeat failures to management level |
| No field time sharing | Manufacturer doesn't know what DSR actually does | No joint call program agreed | Schedule minimum ride-along days in the JBP |
| Distributor DSR not trained on brand standards | Wrong shelf placement, wrong pricing, wrong POS | No manufacturer involvement in DSR capability | Include DSR training as a quarterly JBP commitment |
| Compliance deductions never applied | Distributor treats service commitments as aspirational | No consequence for non-compliance in contract | Apply deductions consistently; announce the mechanism before the first deduction |
Forecast governance principles apply directly here: the alignment failure is usually a governance gap, not a people problem. The same mechanisms that create forecast discipline in a revenue operations team (shared data, defined cadence, clear accountability, consequence for miss) create distributor execution discipline in the field channel.
For a parallel view of how this challenge appears in regulated distribution channels, see distributor and stockist management in pharmaceutical growth. The alignment mechanics are identical even though the compliance environment differs.
The Alignment Readiness Assessment
Before designing the governance structure, a commercial director should assess where the distributor relationship currently sits. These six questions reveal the current state in under 30 minutes of honest review.

- Can you tell me your distributor's secondary sales achievement vs. target last month, by SKU? If no, you have a data gap.
- Does your distributor contract pay any incentive linked to secondary sales or distribution coverage? If no, you have an incentive gap.
- Did you have a formal monthly review with your top-three distributors last month, with an action log? If no, you have a governance gap.
- When did you last ride with a distributor DSR for a full call day? If more than 90 days ago, you have a field insight gap.
- Do your distributors submit secondary sales reports on a weekly or monthly basis? If monthly or never, you have a timing gap.
- Does your distributor JBP include numeric distribution and OOS targets? If no, you have a target alignment gap.
Each "no" identifies a structural gap. None of them require a new technology investment to fix. They require a governance design decision and the commercial director's willingness to reset the distributor relationship on a more demanding basis.
Conclusion
Distributor alignment is a governance design problem. When the structure rewards primary off-take and asks nothing about secondary sales, outlet coverage, or OOS rates, distributors do exactly what they're incentivized to do. They load their warehouse, hit their volume target, and let the sell-out side of the equation take care of itself.
The organizations that close the gap share three characteristics. They have secondary sales visibility that tells them what's happening at the outlet, not just at the distributor's dock. They have a joint business plan with shared secondary and coverage KPIs that both parties review monthly. And they have incentive structures that pay for distribution behavior, not just distribution volume.
Fix the structure. The execution follows.
Frequently Asked Questions about Sales and Distributor Alignment in FMCG
What is distributor alignment in FMCG?
Distributor alignment is the degree to which the manufacturer and distributor are working toward the same commercial outcomes, measured through shared KPIs, joint business plans, and a formal governance cadence. A fully aligned distributor relationship has matching targets for primary off-take, secondary sales, outlet coverage, must-sell SKU compliance, OOS rate, and call frequency, and reviews those targets monthly with a signed action log. An unaligned relationship has primary off-take as the sole success metric, with no secondary accountability and no consequence for coverage or freshness failures.
What is the difference between primary and secondary sales in FMCG?
Primary sales are the volume shipped from the manufacturer to the distributor. Secondary sales are the volume shipped from the distributor to the retailer or outlet. Primary sales measure warehouse movement; secondary sales measure outlet availability. Most FMCG manufacturers have strong primary sales visibility because it comes from their own invoicing. Many have weak secondary visibility because it depends on data the distributor provides. The gap between primary and secondary is where distribution channel problems hide, a distributor can hit their primary off-take number while outlets in their territory are consistently out of stock.
What should a joint business plan with a distributor include?
A JBP for an FMCG distributor relationship should include: primary off-take target by quarter and brand category, secondary sales target by quarter and outlet tier, numeric distribution target by SKU, must-sell SKU compliance target as a percentage of outlets, OOS rate commitment by outlet tier, call frequency commitment by outlet tier, and investment allocation from the manufacturer for promotional execution. The JBP is the reference document for every monthly distributor review meeting, without it, monthly reviews are relationship conversations with no shared baseline.
How often should a manufacturer meet with their distributors for performance reviews?
Monthly is the minimum for any distributor covering a meaningful territory. The meeting must include decision-level attendees from both sides, the manufacturer's channel manager and sales operations lead, and the distributor's general manager and area sales manager. Junior-only meetings become report-reading sessions with no authority to change anything. The output of every monthly review should be a signed action log with owner names and due dates, not a recap email. The signed log is what converts a review from a reporting activity to a performance management mechanism.
What data should distributors report and how often?
Minimum reporting requirements for aligned distributor partnerships: weekly secondary sales report (units sold distributor to outlet, by SKU, outlet, and territory), monthly outlet coverage report (full outlet list with last order date and SKUs carried), monthly OOS exception report (outlets where stock was unavailable at DSR visit time, by SKU), and monthly returns and damages report (units returned from outlets, classified by reason). Distributors who resist secondary data sharing are almost always protecting information that reveals performance gaps. Making data submission a contract term, not a request, and linking incentive payments to timely and complete reporting, is the structural fix.
What does a well-structured distributor incentive look like?
A well-designed distributor incentive has three layers. Base margin covers handling and distribution, paid on all primary off-take. Performance-linked bonus margin is tied to secondary sales achievement, numeric distribution target attainment, and must-sell compliance rate, paid quarterly. Compliance deductions are applied for documented failures to meet contractual service commitments, missed call frequency, late data submission, OOS rate above threshold in A-tier outlets. Deductions should be modest but visible. The transition from primary-only incentives to this structure typically requires phasing over two contract cycles, starting with bonus components before introducing deductions.
Learn More

Senior Implementation Consultant
On this page
- Why Do Manufacturer and Distributor Incentives Diverge?
- Governance Framework: The Four Operating Mechanisms That Create Alignment
- 1. Joint Business Plan with Shared KPIs
- 2. Monthly Distributor Review Meeting
- 3. Field Time Sharing: DSR Ride-Alongs
- 4. Secondary Sales Data Sharing
- Distributor Scorecard: KPIs by Category
- How Should Distributor Contracts Be Structured to Drive Sell-Through Behavior?
- Common Alignment Failures: Diagnostic Checklist
- The Alignment Readiness Assessment
- Conclusion
- Learn More