Numeric and Weighted Distribution: The Metrics That Tell You Where Your Brand Actually Stands
Turn this article into takeaways for your work.


Each assistant summarizes the article only for you and suggests best practices for your work.
A brand can be in 70% of outlets and still miss 80% of category sales. And a sales director who only tracks numeric distribution won't see that problem coming until it shows up in the quarterly revenue miss.
Distribution reporting in most FMCG organizations defaults to one number: the percentage of outlets carrying the SKU. That's numeric distribution (ND), how many of your universe of outlets stock the product. It tells you how many doors you're in. It doesn't tell you whether those doors matter. A brand that's listed in 700 out of 1,000 outlets in a territory sounds well-covered until you learn that the 300 outlets where it's absent account for 60% of the category's volume in that geography.
That's the ND/WD gap, and it's one of the most consistently misread signals in FMCG commercial management. This article explains both metrics in plain terms, shows how to calculate them with a worked example, and gives sales managers a diagnostic framework for turning the gap into a specific field action the following week.
What Are Numeric and Weighted Distribution?
Key Facts: Distribution Metrics and Brand Performance
- As a widely used planning benchmark in FMCG commercial management, leading brands typically target 70 to 85 percent numeric distribution in their core categories, while challenger brands entering growth markets often sit between 40 and 60 percent ND as they build reach. These ranges reflect common field-planning thresholds rather than a single published source.
- Distribution efficiency, weighted distribution divided by numeric distribution, gives a ratio showing whether coverage is landing in the right accounts. A ratio below 0.8 signals the brand is over-indexed in low-volume outlets relative to its numeric coverage. (NielsenIQ, Optimizing Product Distribution, 2023)
- A brand can achieve 70 percent numeric distribution and still miss 60 percent of category volume if the 30 percent of unlisted outlets skew heavily toward high-volume accounts, the canonical high-ND, low-WD gap that costs market share without appearing in coverage reports. (NielsenIQ distribution methodology)
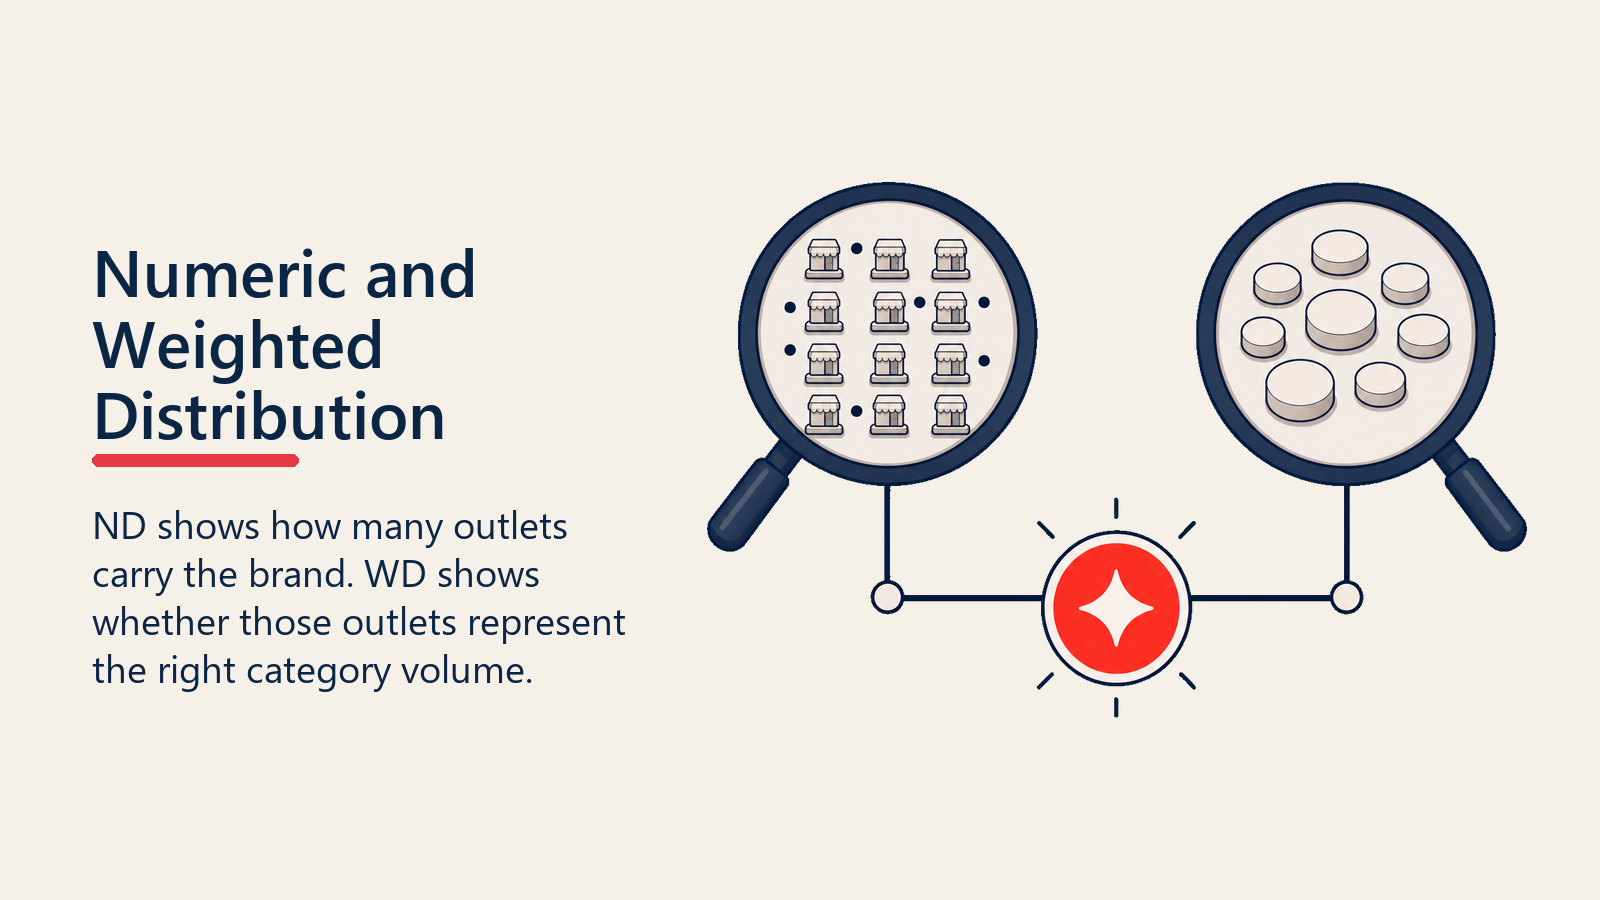
Numeric distribution (ND) measures coverage breadth: the percentage of outlets in a defined universe that stock at least one SKU of the measured brand or product. The Wikipedia entry on numeric distribution defines it as "the percentage of stores that stock a given brand or SKU, within the universe of stores in the relevant market."
ND = (Number of outlets stocking the SKU / Total outlets in the universe) x 100
If your 500ml SKU is listed in 420 of the 600 outlets in a sales territory, your ND for that SKU is 70%.
Weighted distribution (WD) measures coverage quality: the share of category sales volume accounted for by the outlets that stock the product.
WD = (Total category sales in outlets that stock the SKU / Total category sales across all outlets in the universe) x 100
If those same 420 outlets that carry your brand account for 58% of the total category sales in the territory, your WD is 58%.
Why you need both numbers. ND tells you how wide your reach is. WD tells you whether your reach is in the right places. A brand with ND of 70% and WD of 72% has reasonably proportional coverage: the outlets where it's present account for roughly as much category volume as they should. A brand with ND of 70% and WD of 45% is in many outlets, but largely the wrong ones. The high-volume accounts have room for a competitor.
But neither metric is actionable without the other. ND without WD produces coverage optimism. WD without ND misses the breadth gap. Commercial directors who only look at one are managing half the picture.
Quotable Nuggets
- "Being 'everywhere' is overrated. Being in the 'right' places is the goal.", NielsenIQ, Optimizing Product Distribution (2023)
- "In biscuits and FMCG, it's not just about being everywhere (ND); it's about being where it matters most (WD). Market share tells you how well you're performing in those stores.", NielsenIQ / StartupTalky market analysis
- "A brand with ND of 70% and WD of 45% is in many outlets, but largely the wrong ones. The high-volume accounts have room for a competitor.", FMCG distribution management principle
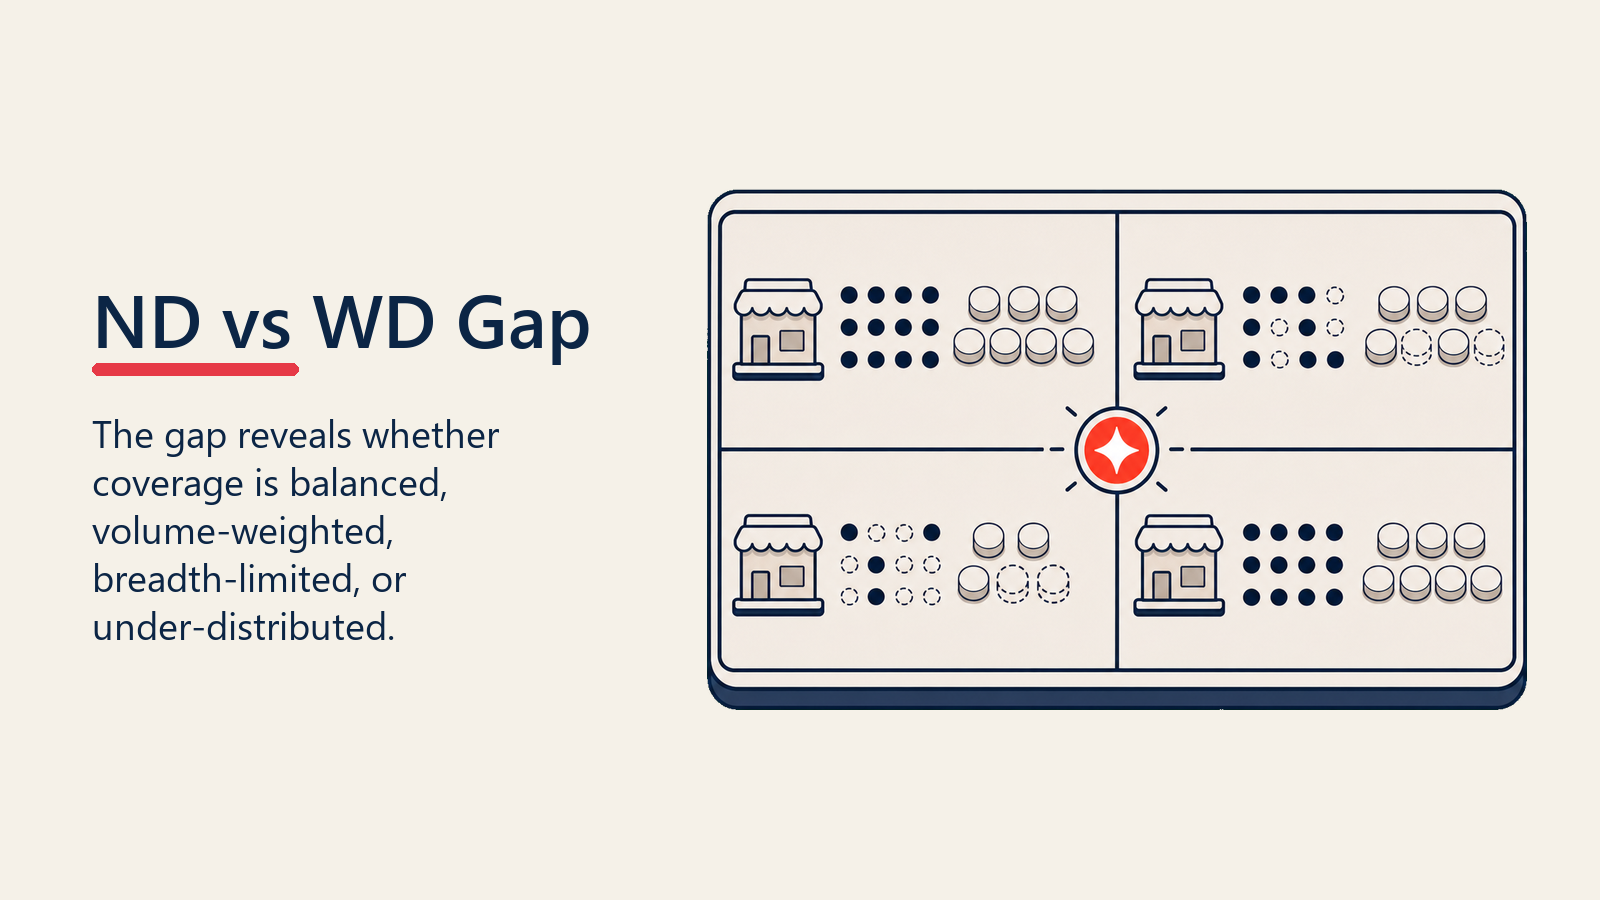
The ND/WD Gap Diagnostic Matrix: A four-quadrant framework for reading distribution health and setting field priorities. High ND + High WD (Balanced Coverage): defend and focus on OOS reduction. High ND + Low WD (Volume Gap): present in low-volume outlets; missing high-volume accounts, prioritize acquisition at top unlisted accounts by category volume. Low ND + High WD (Breadth Gap): anchored in large accounts but limited general trade reach, expand without disrupting anchor accounts. Low ND + Low WD (Under-distributed): aggressive outlet acquisition required across all volume tiers.
The ND vs. WD Gap: What It Tells You About Distribution Quality
The relationship between ND and WD is a diagnostic, not just a reporting check. Four distinct gap scenarios each point to a different field priority.
| Scenario | ND | WD | What It Means | Field Response |
|---|---|---|---|---|
| Balanced coverage | High | High | Present in many outlets and the right ones | Defend, focus on in-store execution and OOS reduction |
| Volume gap | High | Low | Many small outlets, absent from major accounts | Prioritize new outlet acquisition in high-volume accounts immediately |
| Breadth gap | Low | High | Locked into large accounts, not growing reach | Expand coverage into secondary and tertiary outlets without disrupting current anchors |
| Under-distributed | Low | Low | Limited coverage across all account types | Aggressive outlet acquisition program with priority on any outlet above median volume |
High ND, low WD is the most common and most damaging scenario. It usually develops when the field team focuses on adding outlet count without volume filtering: the rep opens a new outlet in a small kiosk, logs it as a distribution win, and misses the superette down the road that accounts for three times the category volume. Over time, the brand accumulates a long tail of low-volume listings while the accounts that actually drive category sales remain under-penetrated. Correcting this requires a hard reset: rank all unlisted outlets by estimated category volume, set a target WD gain per territory per quarter, and measure reps on volume-weighted distribution gain, not just outlet count.
High WD, low ND tends to appear in brands that built their distribution through modern trade and key accounts before extending into general trade. They're well-positioned in the supermarkets and convenience chains but have low penetration in independent retailers, smaller convenience stores, and rural general trade. This isn't always a problem, but growth requires a breadth play, and that requires a different rep skill set than managing key account relationships. The calculation that follows shows exactly where to start.
How to Calculate Both Metrics: A Worked Example
Territory: Metro East, Beverage Category Total outlets in universe: 800 (from outlet universe and census data) SKU: Orange Juice 1L
Step 1: From SFA records and the last sales audit, identify how many of the 800 outlets carry the Orange Juice 1L SKU. Suppose 560 outlets carry it.
ND = (560 / 800) x 100 = 70%
Step 2: From sales audit data or distributor sell-out reports, determine total category sales in the territory. Suppose the Beverage Category generates $200,000 per month across all 800 outlets.
Step 3: Determine how much of that $200,000 comes from the 560 outlets that carry the brand. Suppose those outlets account for $120,000 of the $200,000.
WD = ($120,000 / $200,000) x 100 = 60%
Interpretation: ND is 70%, WD is 60%. The brand is in the majority of outlets but the outlets where it's absent account for 40% of category volume ($80,000 per month). That's the volume gap. If the brand could achieve distribution in the highest-volume unlisted outlets, the revenue upside is proportional to the WD gain.
Data sources for this calculation:
- Outlet universe count: outlet census maintained by the commercial team or syndicated data provider
- Stocking status: SFA visit records showing whether the SKU was present at time of last call
- Category volume by outlet: sales audit data (NielsenIQ, Kantar), distributor secondary sell-out reports, or estimated from outlet tier classifications. NielsenIQ explains that weighted distribution uses either ACV or PCV approaches, with PCV weighting tied to category sales giving a more precise view of outlets that are relevant to your specific category.
The quality of WD calculation depends entirely on the quality of category volume data at outlet level. Organizations without retail audit data can use outlet tier categories as proxies (supermarkets as high-volume, kiosks as low-volume) and weight accordingly. It's less precise, but directionally useful for prioritization. See FMCG sales KPIs and metrics for the full measurement framework.
Using ND and WD to Set Field Priorities
The value of ND and WD is not in the reporting. It's in the decision it forces. Once you know your ND/WD position for each SKU and each territory, the field prioritization conversation becomes specific.
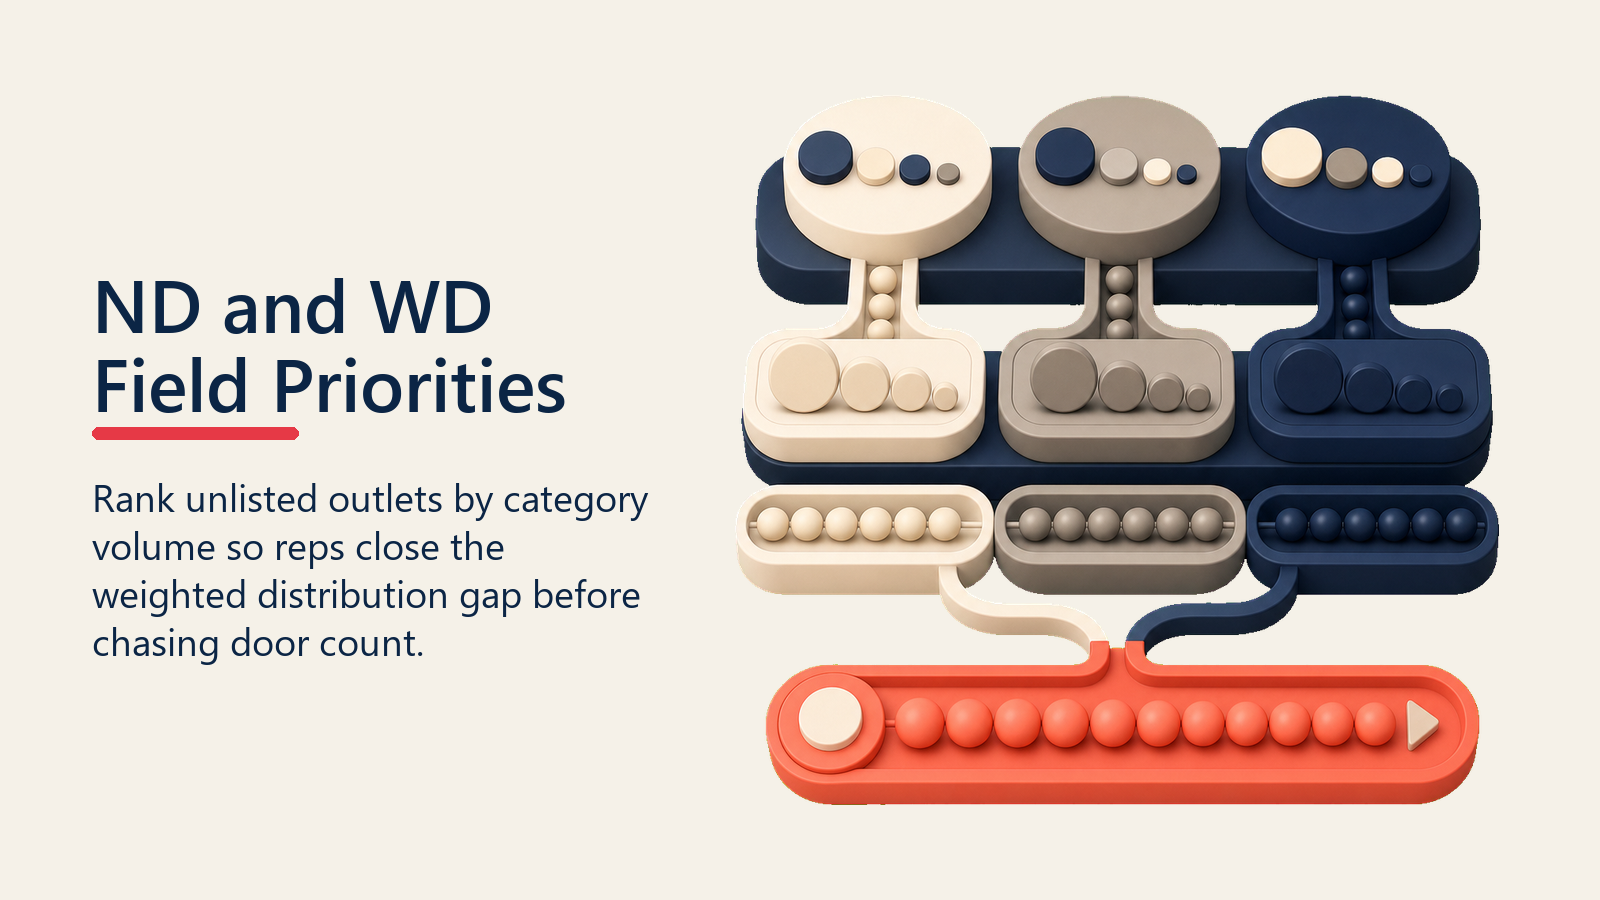
Which outlets to target first to close the WD gap fastest. Rank all unlisted outlets in the territory by estimated category volume, from highest to lowest. Start acquisition efforts at the top of that list. Don't distribute work evenly across all unlisted accounts. As a planning estimate, the top 20% of unlisted outlets by volume often accounts for 60-70% of the potential WD gain, reflecting the volume concentration typical of FMCG retail universes, though the exact ratio varies by market and category. Focus there first. NielsenIQ frames this as optimizing distribution efficiency: dividing weighted distribution by numeric distribution gives you a ratio that shows whether your coverage is landing in the right accounts.
This is a new outlet acquisition decision driven by data rather than rep convenience or geographic clustering.
Linking WD gain to revenue uplift projection. Once you know the category volume in the targeted unlisted outlets, you can estimate the revenue uplift from gaining distribution. If your brand's market share in outlets where it's stocked is 18%, and you gain distribution in outlets that collectively represent $30,000 of monthly category volume, your projected incremental monthly revenue is 18% x $30,000 = $5,400. That's a business case for prioritizing the acquisition effort and for allocating rep time to it over secondary display work in already-covered accounts.
This projection methodology mirrors the sales forecasting logic used in pipeline management: quantify the opportunity before allocating resources to pursue it.
Avoiding the coverage trap. There's a temptation once WD is understood to go after every high-volume unlisted outlet simultaneously. That overstretches the field team and produces poor execution in all directions. A more effective model is to set a WD gain target per territory per quarter (say, +4 percentage points), identify the minimum number of outlets required to achieve that gain, and assign those outlets as the rep's quarterly acquisition target. That's a manageable, measurable goal that doesn't compete with the rep's existing outlet service responsibilities.
Territory analytics and sales dashboards that surface ND/WD by rep territory make this prioritization visible in the weekly review meeting without requiring the manager to manually calculate it. Even a simple spreadsheet with outlet tier and estimated volume works as a starting point.
How Do Out-of-Stocks Undermine Weighted Distribution?
Weighted distribution is a lagging metric if it only measures whether the product is listed. A listed outlet where the product is perpetually out of stock is a WD contributor that doesn't convert to actual sales. Commercial teams that track OOS rates alongside WD get a cleaner picture of effective distribution.
Effective weighted distribution = WD adjusted for OOS rate. If your WD is 60% but your OOS rate in those stocking outlets is 12%, your effective distribution, the share of category volume where your product is actually available for purchase, is materially lower than 60%.
This linkage between OOS rate and distribution quality is why the two metrics belong in the same review conversation. A territory with stable WD but rising OOS rates has a distribution quality problem that the WD number alone won't reveal.
Tracking Distribution Over Time: Frequency and Reporting Cadence
Distribution metrics aren't useful as one-time snapshots. Their diagnostic value comes from tracking change over time and comparing performance across territories, brands, and SKUs.
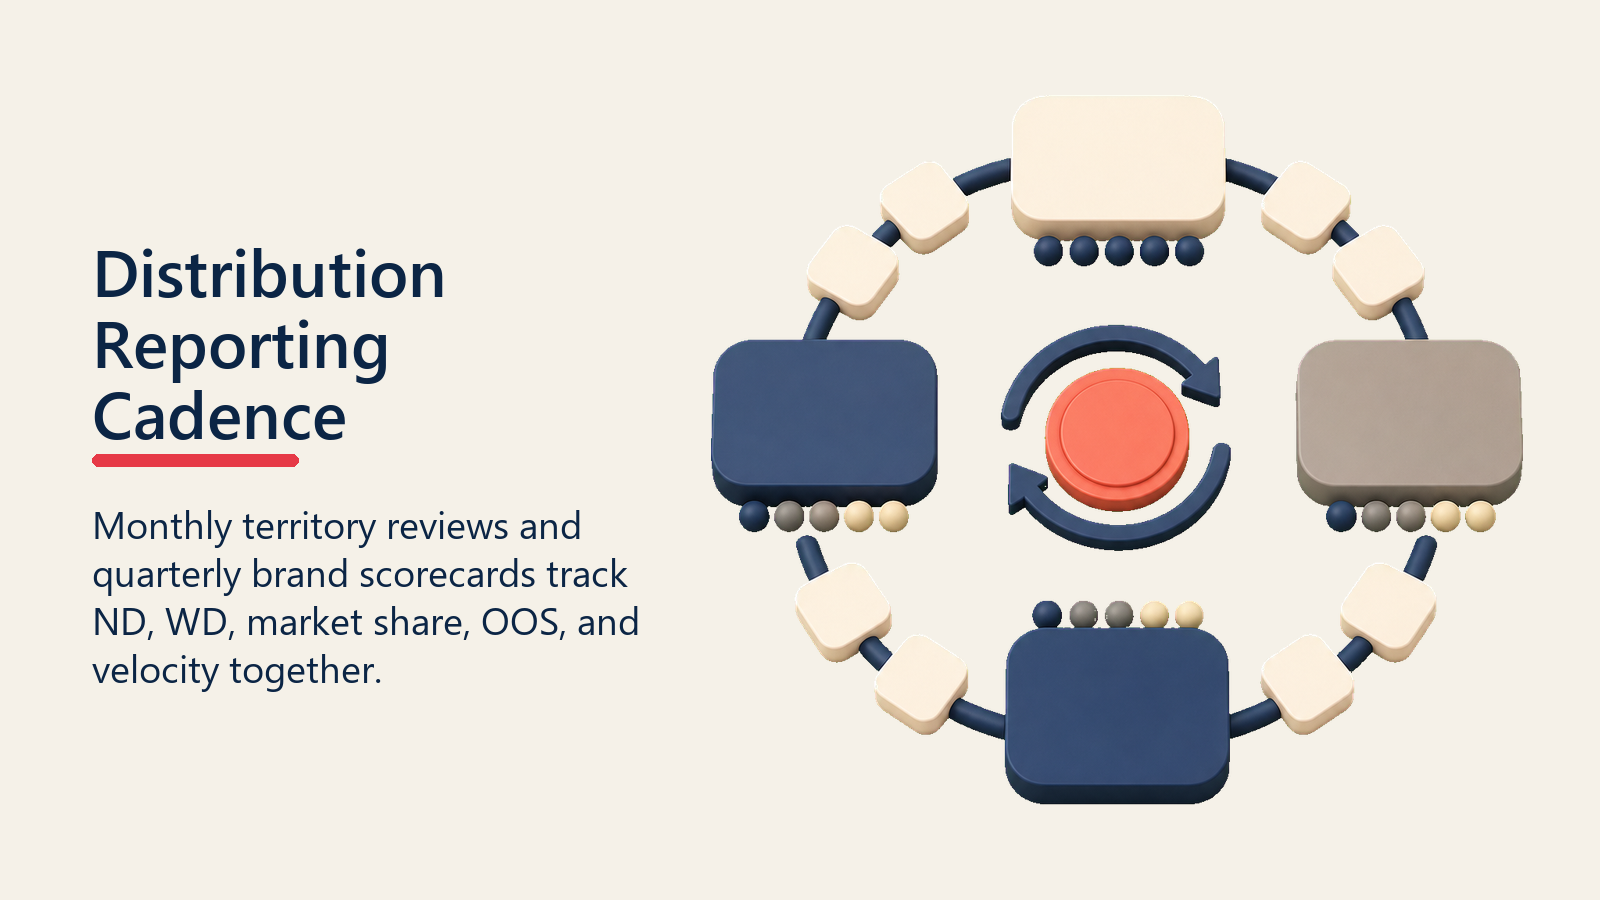
Monthly territory reviews should include ND and WD by priority SKU, compared to the prior month and to target. A one-point WD gain month-over-month signals that the acquisition effort is working. A flat WD despite new outlet listings signals that the rep is adding low-volume outlets, not high-volume ones.
Quarterly brand health scorecards should include ND and WD as anchor metrics alongside market share, OOS rate, and numeric distribution velocity (how fast new outlet listings are being added). These four metrics together tell the full distribution health story for any SKU in any territory.
Benchmarking against category leaders is useful where syndicated data is available. If your brand has ND of 65% and WD of 55%, but the category leader has ND of 78% and WD of 74%, the gap is quantified and the prioritization becomes obvious. The WD gap closes faster than the ND gap when the right outlets are targeted because volume concentrates in fewer accounts.
Frequency of data refresh depends on data source. SFA records update in near-real-time as reps complete calls. Sales audit data from providers like Nielsen typically refreshes monthly or bi-monthly. Build your reporting cadence around the data refresh cycle, not the calendar month.
Conclusion
Distribution metrics are only useful when they drive a specific rep action the following week. Numeric distribution tells you your coverage breadth. Weighted distribution tells you whether that coverage is in the accounts where category volume sits. The gap between them is where growth is hiding.
A commercial director who can sit in a territory review and say "we have ND of 68% and WD of 51%, and the top five unlisted outlets by volume are X, Y, Z, P, and Q, and those five alone represent 14 WD points if we can list them" is running a distribution growth conversation, not a coverage reporting session. That conversation leads to a rep priority list, a quarterly acquisition target, and a measurable revenue projection.
Distribution metrics become field tools when they're paired with outlet data, connected to rep action plans, and reviewed against targets in a weekly cadence. Without that loop, ND and WD are just two more numbers in a dashboard nobody reads on Friday afternoon.
Frequently Asked Questions about Numeric and Weighted Distribution
What is the difference between numeric distribution and weighted distribution?
Numeric distribution (ND) measures how many outlets in a defined universe stock at least one SKU of the brand, expressed as a percentage. Weighted distribution (WD) measures the quality of that coverage by weighting it against category sales volume, it answers the question "how much of the category's total sales are generated in the outlets where the brand is present?" ND tells you coverage breadth; WD tells you whether that coverage is in the accounts that actually drive category sales. Both are required. ND without WD produces coverage optimism; WD without ND misses the breadth gap.
What does high ND and low WD indicate for an FMCG brand?
High ND with low WD is the most common and commercially damaging distribution gap. It means the brand has achieved coverage in many outlets, but those outlets tend to be lower-volume accounts while the high-volume accounts carrying the majority of category sales remain under-penetrated. This typically develops when field reps prioritize outlet count over volume quality in new outlet acquisition. The fix is to rank all unlisted outlets by estimated category volume and redirect acquisition effort toward the top of that list rather than adding any available door.
How do you calculate distribution efficiency?
Distribution efficiency = weighted distribution divided by numeric distribution. A ratio of 1.0 means the brand's coverage is perfectly proportional to category volume across the outlet universe. A ratio above 1.0 means the brand is over-indexed in high-volume accounts relative to its coverage breadth, a strong position. A ratio below 0.8 means the brand is over-indexed in low-volume outlets and is missing disproportionate category volume in its unlisted accounts. NielsenIQ recommends this ratio as a starting diagnostic before setting field acquisition priorities.
What data sources are needed to calculate weighted distribution?
Three data sources are required. First, an outlet universe count from the commercial team's outlet census or a syndicated data provider. Second, stocking status for each SKU from SFA visit records showing whether the product was present at the last call. Third, category sales volume by outlet from retail audit data (NielsenIQ, Kantar), distributor secondary sell-out reports, or estimated from outlet tier classifications. Where retail audit data is unavailable, outlet tier categories (supermarkets as high-volume, kiosks as low-volume) can serve as proxies, less precise but directionally useful for prioritization.
How often should ND and WD be reviewed?
Monthly territory reviews should include ND and WD by priority SKU compared to the prior month and to target. A one-point WD gain month-over-month signals that the acquisition effort is working. A flat WD despite new outlet listings signals that the rep is adding low-volume outlets, not high-volume ones. Quarterly brand health scorecards should include both metrics alongside market share and OOS rate as anchor distribution health indicators. Data refresh frequency should match the slowest data source, syndicated audit data typically refreshes monthly or bi-monthly.
What is the typical WD gain target per territory per quarter?
There is no universal benchmark, as targets depend on category, market maturity, and current distribution position. In practice, a reasonable planning assumption for a brand in the high-ND, low-WD quadrant is a target WD gain of 3 to 5 percentage points per territory per quarter, achieved by prioritizing the top 5 to 10 unlisted outlets by estimated category volume. Setting a WD gain target (rather than a numeric outlet count target) ensures that rep acquisition effort is directed at accounts that will actually move the metric.
Learn More

Senior Implementation Consultant
On this page
- What Are Numeric and Weighted Distribution?
- The ND vs. WD Gap: What It Tells You About Distribution Quality
- How to Calculate Both Metrics: A Worked Example
- Using ND and WD to Set Field Priorities
- How Do Out-of-Stocks Undermine Weighted Distribution?
- Tracking Distribution Over Time: Frequency and Reporting Cadence
- Conclusion
- Learn More