Outlet Out-of-Stock Reduction: The Field Sales Playbook for Keeping Shelves Full
Turn this article into takeaways for your work.


Each assistant summarizes the article only for you and suggests best practices for your work.
Every out-of-stock event is a vote for the competitor sitting next to your empty slot. When a shopper reaches for your brand and finds nothing, they don't wait. They pick whatever's there. And depending on how that experience goes, they may not come back.
FMCG sales directors know this intellectually. But out-of-stock reduction rarely shows up as a structured discipline with its own KPIs, root cause frameworks, and rep-level playbooks. It gets treated as a distribution problem to escalate upward rather than a revenue recovery opportunity that every rep can act on during every call.
And that framing costs money. A single out-of-stock event in a mid-volume convenience outlet over a week translates directly to lost units, lost revenue, and a measurable competitor gain. Multiply that across a route of 60 outlets and an OOS rate of 8%, and you're looking at meaningful revenue leakage that the field team can reduce without a budget change, a new initiative, or a marketing approval.
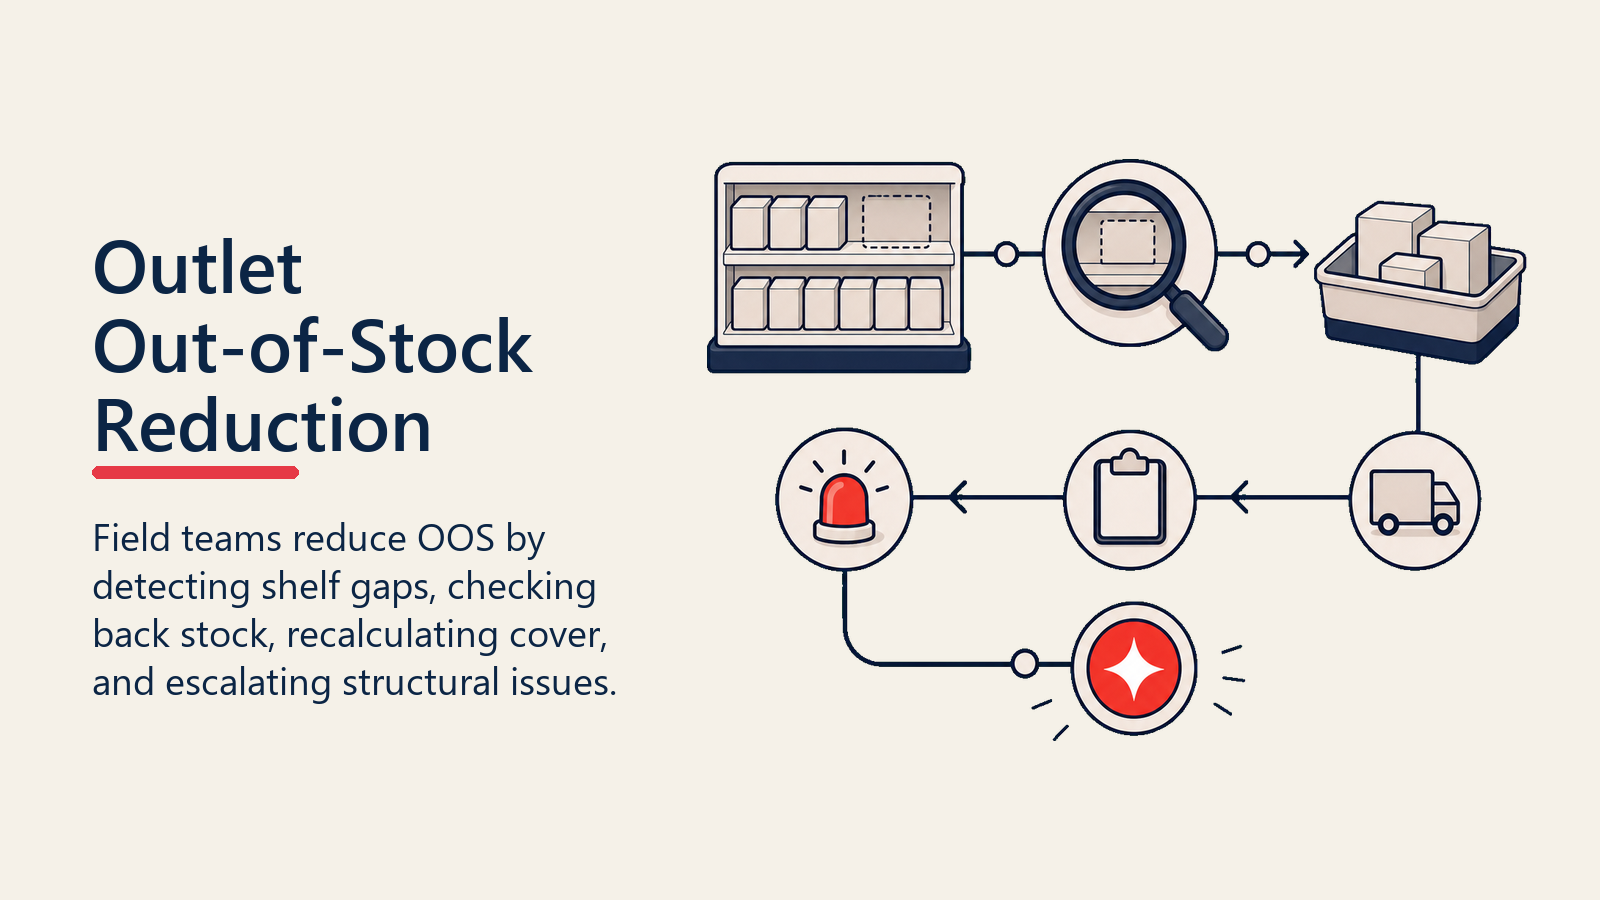
This article gives field sales managers and commercial directors the structured approach to identify OOS (out-of-stock, zero units available for purchase) at the outlet, find the root cause, act on prevention levers available to the rep, and escalate when the issue sits above the rep's authority. OOS reduction is a revenue discipline. It has a calculable return on rep time invested, and it starts on the shelf.
Why Out-of-Stocks Happen at the Outlet Level
Key Facts: Out-of-Stock Impact in FMCG
- Retail out-of-stock rates fell from 10.7 percent in 2022 to 6.5 percent in 2023, with industry historical averages sitting around 8 percent. For promoted items, OOS rates regularly exceed 10 percent. (FMI The Food Retailing Industry Speaks, 2024)
- A UK consumer study found that 45 percent of shoppers switched to a competing brand when their preferred product was out of stock, and 91 percent would not wait for restocking, choosing instead to buy an alternative or leave without purchasing. (The Grocer / TELUS Consumer Goods, Food and Beverage Study, 2026)
- Academic research by Corsten and Gruen (2004), one of the most widely cited studies in retail shelf management, found that 70 to 90 percent of retail stockouts originate at the shelf rather than in the upstream supply chain, meaning the field team holds the primary fix. The finding has been replicated in subsequent retail audits across multiple markets.
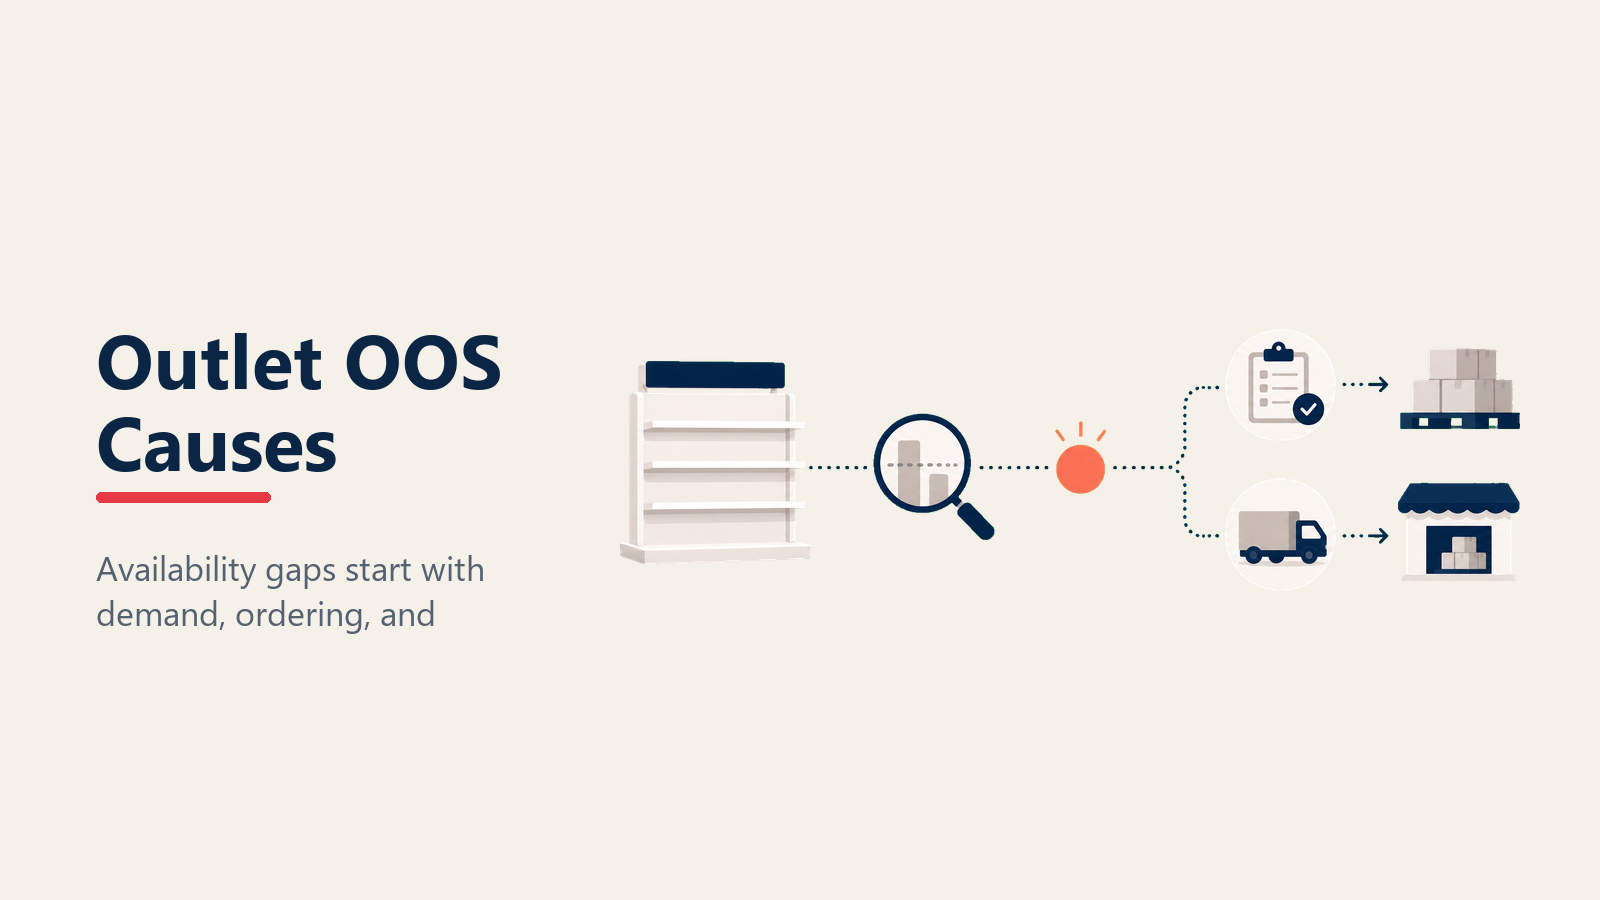
Not all out-of-stocks have the same cause, and treating them as a single category produces the wrong fix. Field managers who want to reduce OOS rates need to map the root causes before deploying solutions. Most stockouts trace to shelf-level execution, which means the fix lives in the field.
Under-ordering by the retailer is the most common cause in independent trade and traditional channels. Small shopkeepers avoid tying up cash in inventory and order in small, frequent quantities. When demand spikes or the distributor visit is delayed, the outlet goes empty before the next replenishment. The root cause here isn't distribution failure. It's the retailer's working capital constraint and their distrust of the rep's recommended order quantity.
Distributor fill-rate failure is the second most common cause and often misdiagnosed as a retailer problem. If the distributor isn't delivering full orders, outlets go short even when the reorder trigger was set correctly. This shows up in secondary sales and stock visibility data as a gap between what was ordered and what was delivered. Reps who see chronic OOS in a distributor territory should check fill rates before assuming the outlet owner is at fault.
Unplanned demand spikes from promotions catch outlets short when the field team or trade marketing runs a push without pre-loading stock. The promotion drives purchase intent, but the shelf runs dry before the window closes. This is an alignment failure between demand planning and field execution, and it's entirely preventable with a 10-day stock pre-load window before any activation.
FIFO failures that block shelf access to remaining stock create a category of phantom OOS where product exists in back-stock but the shelf appears empty because rotation wasn't enforced. A rep who checks only the facing without pulling through to back-stock will log a false OOS and potentially trigger an overorder. Returns, damages, and FIFO freshness discipline is the operational fix for this failure mode. Expired product blocking fresh stock from reaching the shelf is a rep-level fix: rotate, remove expired units, and fill from back-stock.
| Root Cause | Frequency | Rep-Actionable Fix | Escalation Required? |
|---|---|---|---|
| Retailer under-ordering | High | Recalculate days-of-cover, reset reorder trigger | No |
| Distributor fill-rate failure | Medium | Flag to distributor rep; report to DSM | Yes, if chronic |
| Promotion-driven demand spike | Medium | Pre-load 10 days before activation | Yes, align with trade marketing |
| FIFO failure / back-stock block | Medium | Rotate shelf, remove expired units | No |
| Allocation restriction from manufacturer | Low | Cannot fix at outlet level | Yes, escalate to sales ops |
| Pricing dispute blocking reorder | Low | Cannot fix at outlet level | Yes, escalate to commercial manager |
Quotable Nuggets
- "45 percent of shoppers switched to a different brand when their desired product was out of stock.", The Grocer / TELUS Consumer Goods, Food and Beverage Study (2026), UK consumer panel
- "70 to 90 percent of retail stockouts originate at the shelf, not in the supply chain. The field rep is the last line of defense (and the most effective one.") Corsten and Gruen (2004), widely replicated across subsequent retail audit studies
- "A rep who runs a back-stock audit, calculates days-of-cover, and resets the reorder trigger generates more revenue than one who processes the call quickly and moves on.", FMCG field sales management principle
The Three-Layer OOS Detection Approach: The structured field protocol for catching out-of-stock events before, during, and after they occur. Layer 1: Shelf Audit, count facings and log zero-availability SKUs. Layer 2: Back-Stock Audit, check the storeroom or shelf back for product that exists but isn't on display (rotation fix, not true OOS). Layer 3: Order History Audit, pull the last three cycles from SFA records and flag structurally under-ordered outlets before the shelf hits zero. Programs that train all three layers report lower OOS rates than those relying on shelf audits alone.
The OOS Detection Framework
Finding out-of-stocks on a call sounds simple. It isn't. Reps who only look at the shelf miss back-stock situations, phantom gaps, and order history patterns that signal an imminent OOS before it happens. A structured OOS detection framework has three layers.
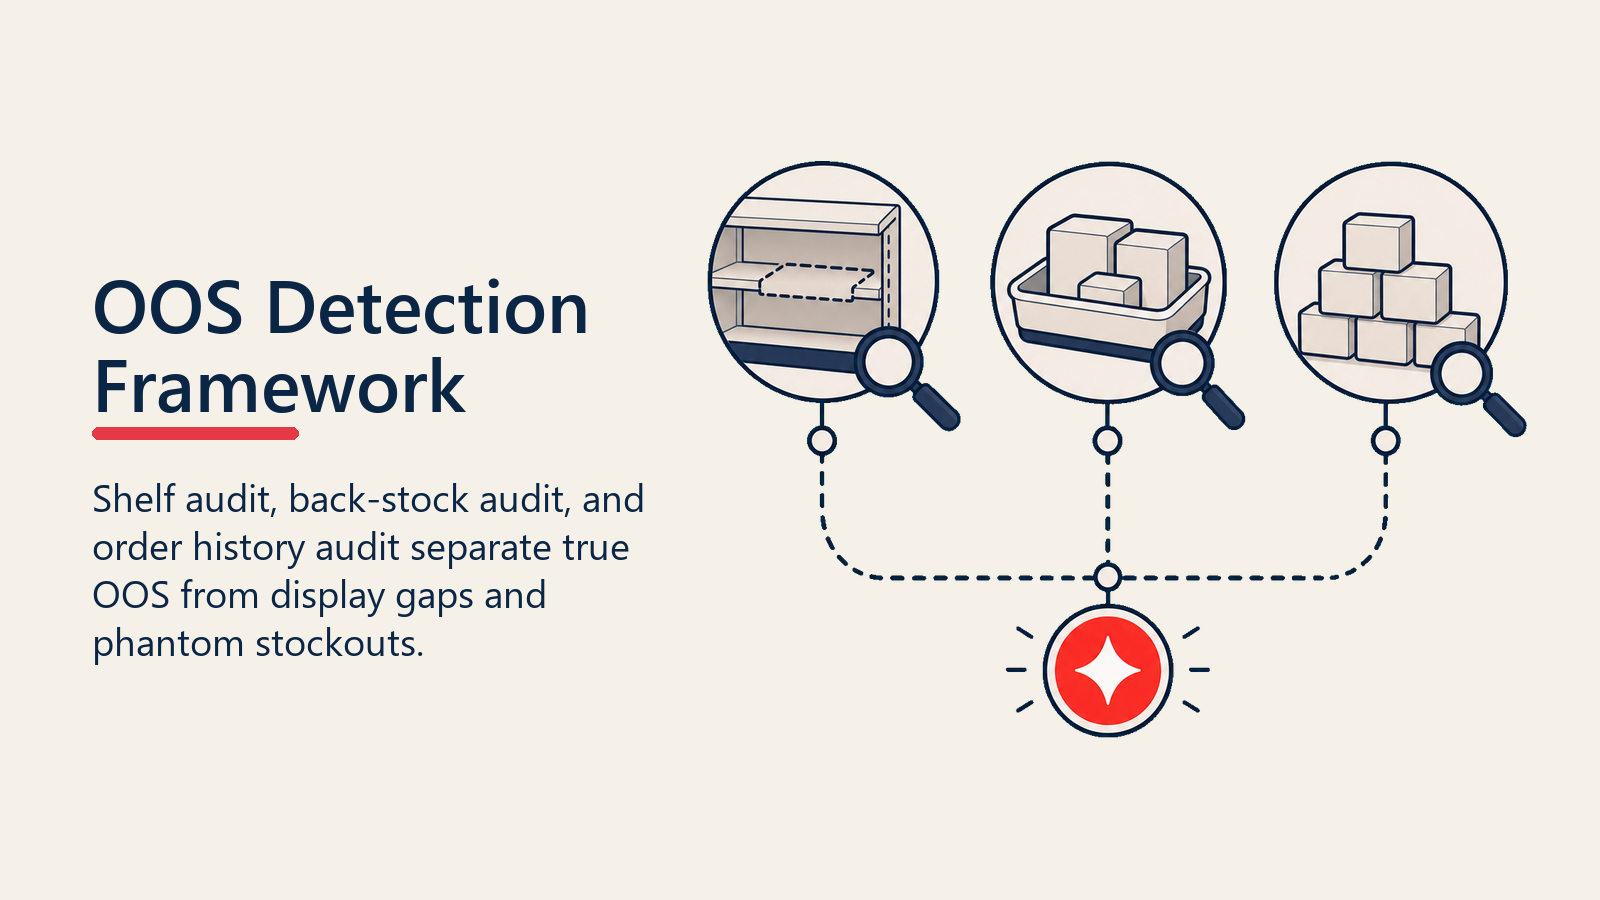
Shelf audit is the first and most visible check. Count the facings of your SKU. If facing count is zero or below minimum facing standard, log an OOS or near-OOS. But don't stop there.
Back-stock audit is the second check, and it's the one most reps skip when they're short on time. Ask the retailer or look with permission. If product is in the back room but not on the shelf, this is a rotation or replenishment failure, not a stock-out. The fix is physical: pull through, rotate, and restock. Log it as a FIFO issue, not a true OOS.
Order history audit is the third layer and the one that catches OOS before it happens. Pull the outlet's last three order cycles from SFA records. If the average cycle quantity is consistently below the expected days-of-cover calculation, the outlet is structurally under-ordering and the next OOS is predictable. This is where the preventive action happens, not after the shelf is already empty.
Distinguishing a true OOS from a display gap matters for your KPI accuracy. A display gap is an empty secondary display unit where your product should appear but the primary shelf is stocked. A true OOS is zero units available at point of purchase. Mixing these inflates your OOS rate and produces wrong root cause data. Train reps to classify before they log. That classification discipline is also what makes the prevention layer work.
What Can a Field Rep Do to Prevent Out-of-Stocks Before They Happen?
Prevention is more valuable than recovery. A rep who avoids an OOS generates more revenue than one who restocks after the event. These are the practical levers available to the rep during the call, without requiring distributor intervention or management approval.
Days-of-cover calculation. The foundational tool for every recommended order quantity discussion. Days-of-cover = (Units in stock + Units on order) / Average daily sales rate. A rep visiting weekly should target a minimum of 10 days of cover for any key SKU, giving buffer for delivery delays and demand variation. For outlets in remote areas or those served by monthly distributor routes, 30 days of cover is the floor.
Example: An outlet sells 12 units of your 500ml SKU per day on average, has 40 units on shelf, and no pending order. Days of cover = 40 / 12 = 3.3 days. That outlet is days away from an OOS. The rep's job in that call is to calculate a recommended order quantity, communicate it clearly, and help the retailer understand why ordering only what they think they need is costing them sales when their shelf runs dry mid-week.
Reorder trigger setting for key outlets. Rather than waiting for the retailer to notice they're running low, work with the outlet owner to agree on a reorder level: the unit count at which they should place the next order. For a weekly distribution route, the reorder level should be set at approximately 8 days of cover to ensure the order arrives before the shelf hits zero. Capture this in your SFA record for the outlet. On your next visit, check actual stock against the reorder level and ask whether the order was placed.
Alerting the distributor before depletion, not after. When a rep's outlet audit reveals a structural under-stock situation that can't be fixed within the regular distributor cycle, the right action is to flag it to the distributor before the OOS happens. That means calling the distributor area sales rep, citing the outlet name, the SKU, the current stock level, and the days-of-cover calculation. A short, factual message beats a complaint call after the shelf is already empty.
Must-sell list compliance as a proxy for coverage. If your brand has a must-sell list and assortment defined for each outlet tier, an OOS on any must-sell SKU is a compliance gap, not just a stock issue. Treat it that way: log it against the outlet's must-sell score, not just as an isolated event.
KPIs and Measurement
OOS reduction without measurement is guesswork. These are the metrics a field manager needs to run OOS reduction as an operational discipline rather than an intermittent cleanup.
| KPI | Definition | Target | Action Trigger |
|---|---|---|---|
| OOS rate by SKU | % of outlet visits where SKU has zero availability | Below 3% for priority SKUs | Above 5%: investigate root cause by SKU |
| OOS rate by route | % of outlets on route with any OOS at time of visit | Below 5% per route | Above 8%: route-level root cause review |
| OOS rate by outlet tier | % of OOS events occurring in A-tier vs. B-tier vs. C-tier outlets | A-tier below 2% | Any A-tier OOS: same-day escalation |
| Lost sales estimate | Units OOS x average daily sales rate x days since last visit | Track monthly by SKU | Increasing trend: review reorder triggers |
| Back-stock conversion rate | Visits where back-stock found and moved to shelf / total visits | Above 90% | Below 80%: rep training on back-stock check |
| FIFO compliance rate | Outlets where product is rotated correctly / total outlets audited | Above 95% | Below 90%: route-level FIFO refresher |
Lost-sales estimation is the number that translates OOS from a percentage into a revenue conversation. Multiply units OOS by the average daily rate by the estimated days the OOS persisted. Even conservative estimates tend to be uncomfortable for sales directors, which is exactly the point. FMI data shows the average retail OOS rate ran at around 8 percent historically and peaked at 10.7 percent in 2022, improving to 6.5 percent in 2023 after supply chain stabilization. OOS rates for promoted items still regularly exceed 10 percent, making the revenue case for better rep protocols straightforward to build. When a sales manager can show that the OOS events on Route 7 in Q2 cost an estimated 4,800 units of lost revenue, the conversation about reorder trigger discipline becomes much easier.
Retail execution analytics platforms that aggregate SFA field data can automate much of this reporting. Even without automation, a weekly OOS summary by route compiled from rep reports creates enough visibility to drive the right conversations in Monday's sales review.
Escalation Triggers: When the Rep Can't Fix It
Not every OOS is solvable by the field rep. The governance discipline here is knowing which situations require escalation and to whom, rather than reps spending call time on problems they don't have the authority to resolve.
Systemic distributor shortfall. If multiple outlets on a route consistently show OOS for the same SKU across multiple weeks, and the root cause is the distributor's inability to fill orders, the rep cannot fix this. The rep's role is to document: outlet names, SKUs, order quantities requested, quantities delivered, and dates. That data goes to the distributor sales manager and to internal sales ops for a formal fill-rate review. Secondary sales and stock visibility data should be surfaced in this escalation so the conversation is quantitative, not anecdotal.
Allocation restrictions. When a SKU is on allocation from the manufacturer, the distributor may not have enough product to fulfill all outlet orders. The rep can't change the allocation. But the rep should identify which outlets matter most by volume and advocate internally for priority allocation to high-value accounts. This requires the rep to know their outlet rankings from the outlet universe and coverage data.
Pricing disputes blocking reorder. Occasionally, an outlet owner refuses to reorder because of a disagreement over trade prices, credit terms, or a pending claims resolution. This is a commercial manager's territory. The rep's job is to surface the issue accurately: what is the dispute, when did it start, what product is affected. Not to negotiate terms without authority.
Escalation decision guide:
- OOS caused by retailer under-ordering: rep fixes, no escalation
- OOS caused by FIFO failure: rep fixes on call, no escalation
- OOS caused by single distributor delivery failure: rep logs and notifies distributor rep
- OOS caused by chronic distributor fill-rate failure (3+ weeks): escalate to distributor sales manager and sales ops
- OOS caused by allocation restriction: escalate to internal category manager
- OOS caused by pricing or credit dispute: escalate to commercial manager same day
Building the Habit: OOS Review in the Weekly Sales Meeting
The mechanics of OOS reduction are straightforward. The reason most organizations don't close the gap is not a knowledge problem. It's a cadence problem. OOS data sits in field reports, gets mentioned in Monday meetings, and then gets buried under pipeline discussions.
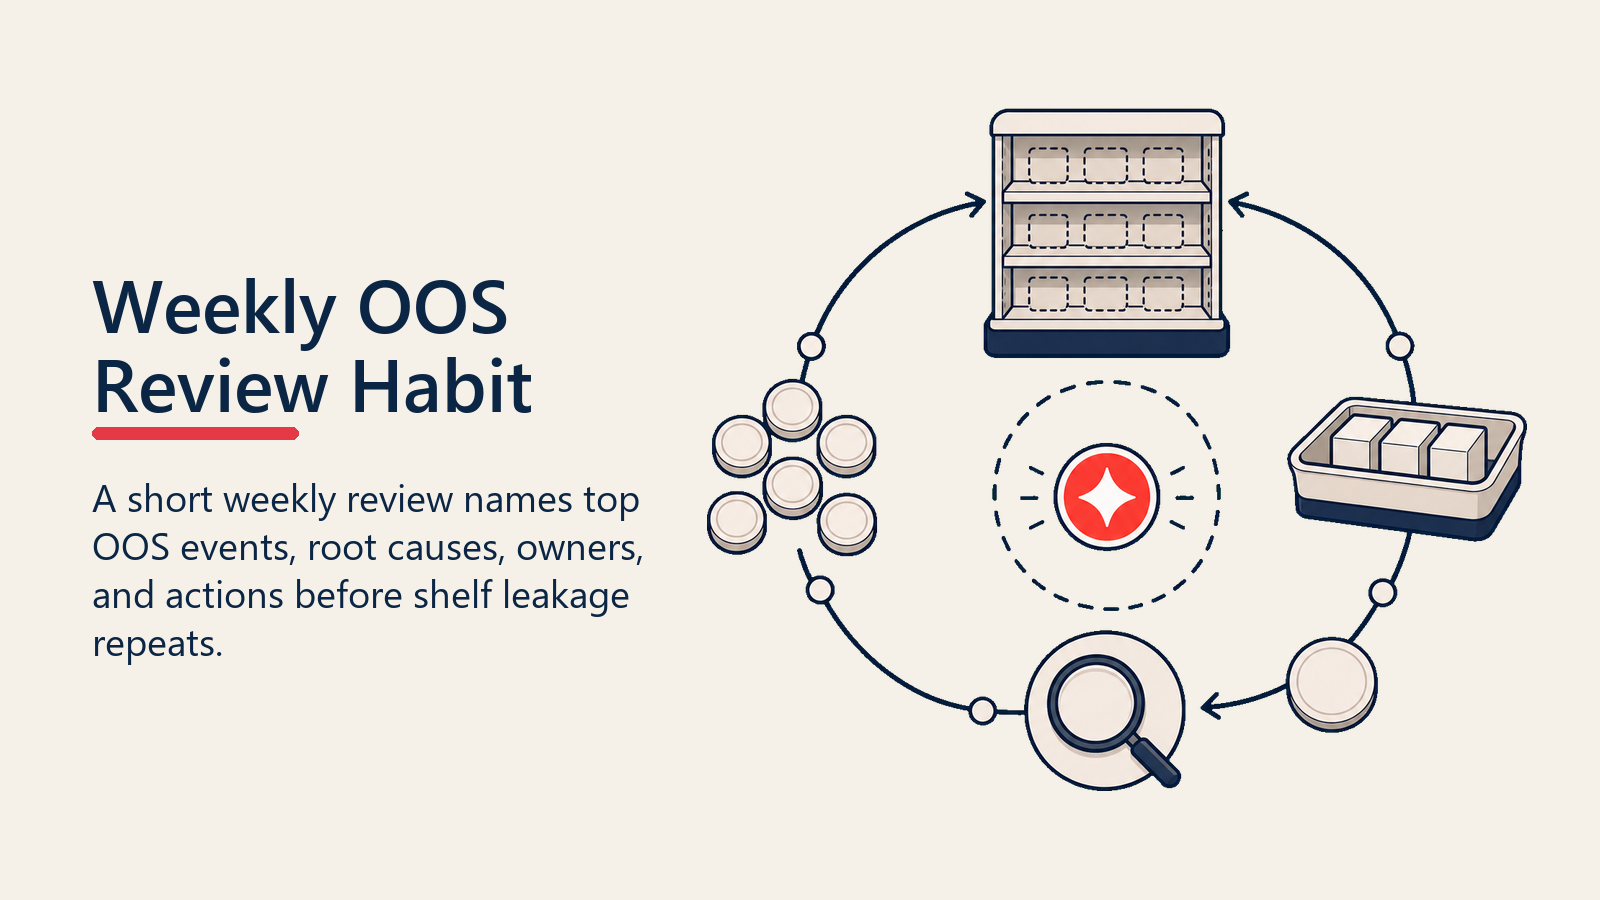
But the fix is structural. Build a 10-minute OOS review into every weekly team meeting using a three-question format: What were our top three OOS events by volume last week? What was the root cause for each? What's the specific action and who owns it? That discipline, run consistently for 90 days, does more for OOS rates than any new tool or training program.
Link the OOS review to your pipeline coverage analysis habits. The same discipline that keeps pipeline from leaking at the opportunity level applies at the shelf level: identify the gap, quantify it, assign the fix, track the close.
Conclusion
Out-of-stock reduction is a revenue recovery discipline with a direct, calculable return on rep time invested. The math is always there: OOS rate times average daily sales rate times route size equals an annualized lost revenue estimate. When you put that number in front of a field manager, the conversation about reorder trigger discipline and structured call audits becomes very concrete.
The field rep who runs a back-stock audit, calculates days-of-cover, resets the reorder trigger, and alerts the distributor before the shelf runs dry generates more revenue than one who processes the call quickly and moves on. OOS reduction isn't about working harder. It's about working with a checklist that turns every outlet call into a coverage recovery opportunity.
The empty shelf has a cost. Make it visible. Assign it. Fix it.
Frequently Asked Questions about Outlet Out-of-Stock Reduction
What is an out-of-stock event in FMCG retail?
An out-of-stock (OOS) event occurs when a product a shopper wants to buy is unavailable at the point of purchase, zero units on the shelf and none accessible from back-stock. OOS differs from a display gap (empty secondary display, primary shelf stocked) and a phantom OOS (product exists in back-stock but wasn't rotated to shelf). Mixing these categories inflates OOS rates and produces wrong root cause data. True OOS requires a rep fix focused on reorder calibration or distributor fill-rate; phantom OOS requires a rotation fix at the next call.
What causes most out-of-stocks in FMCG general trade?
Retailer under-ordering is the most common cause, driven by working capital constraints and distrust of the rep's recommended quantity. Distributor fill-rate failures (where orders are placed but not fully delivered) are the second most common and frequently misdiagnosed as a retailer problem. FIFO failures that block shelf access to available back-stock create phantom OOS. Unplanned promotional demand spikes are common but preventable through a 10-day stock pre-load window before any activation. Academic retail research, most influentially Corsten and Gruen (2004), finds that 70 to 90 percent of stockouts trace to shelf-level execution, not upstream supply chain failure.
How is days-of-cover calculated for an outlet?
Days-of-cover = (Units in stock + units on order) / average daily sales rate. For a weekly distribution route, the target is a minimum of 10 days of cover for priority SKUs, providing buffer for delivery timing variation. For outlets in remote areas or on monthly distributor routes, 30 days of cover is the floor. A rep who calculates days-of-cover on every call and communicates the recommended order quantity to the retailer is doing the most direct OOS prevention work available without requiring any external intervention.
What is the difference between OOS rate by route and OOS rate by SKU?
OOS rate by SKU (percentage of outlet visits where that SKU has zero availability) identifies which products are consistently out of stock across the territory and points to either a supply or demand planning issue. OOS rate by route (percentage of outlets on a given route with any OOS at time of visit) identifies field execution patterns, a route with twice the territory average OOS rate has a rep discipline or distributor fill-rate problem, not a category problem. Both metrics are needed to run OOS reduction as an operational discipline rather than a category reporting exercise.
When should a rep escalate an OOS versus fixing it on the call?
Escalation is needed when the rep doesn't have authority to fix the root cause: chronic distributor fill-rate failure (three or more weeks of the same OOS for the same SKU), allocation restrictions from the manufacturer, or pricing disputes blocking reorder. Everything else is a rep fix on the call: under-ordering (recalculate and recommend), FIFO failure (rotate and fill from back-stock), single delivery shortfall (notify distributor rep by phone). Reps who escalate fixable situations waste both their own time and the area manager's. Reps who fail to escalate structural distributor problems waste the rep's time on a problem they can't solve at the outlet level.
How does OOS rate connect to weighted distribution?
A listed outlet where the product is perpetually out of stock contributes to your numeric distribution count but not to effective market coverage. Effective weighted distribution is WD adjusted downward for OOS rate, the share of category volume where your product is actually available for purchase. A territory with stable WD but rising OOS rates has a distribution quality problem that the WD number alone won't reveal. This is why OOS rate and WD should be reviewed together in every monthly territory performance conversation.
Learn More

Senior Implementation Consultant