Outlet Universe and Census: How to Know Every Outlet in Your Territory Before You Plan a Single Beat
Turn this article into takeaways for your work.


Each assistant summarizes the article only for you and suggests best practices for your work.
You can't cover what you haven't counted. It's a simple idea. But walk into any fast-moving consumer goods (FMCG) area manager's weekly review and the gap becomes visible. Beat plans built on distributor lists that haven't been cleaned in two years. Outlet counts that don't match what reps actually visit. Territory boundaries drawn around geography rather than retail density.
The result is invisible coverage gaps. Outlets your brand should be in but isn't. Outlets your reps visit that stopped selling your category six months ago. A field force spending its time on a universe that exists only on paper.
An outlet census fixes that. It's the systematic enumeration of every retail point within your territory that sells, or could sell, your category. Done properly, it becomes the single source of truth that every commercial decision sits on: segmentation, beat design, workforce sizing, distribution target-setting. Done poorly, or not at all, every downstream decision inherits the same bad data.
Key Facts
- In one NielsenIQ Vietnam study (biscuits and cakes category), a manufacturer with 85% national numeric distribution was absent from 44,000 priority outlets representing 57% of category sales in that region, per NielsenIQ's distribution analysis in Vietnam. This is a direct illustration of the gap between nominal coverage and the actual served universe.
- In FMCG markets across Southeast Asia and sub-Saharan Africa, the gap between the total retail universe and the served universe commonly sits at 30-50%, as a rough planning estimate based on distributor data audits. This means field teams are typically missing a third to half of available outlets in their territory without a formal census.
- Field enumeration census projects in mid-size territories typically take 4 to 8 weeks using regular field reps, or 2 to 3 weeks with a dedicated census team, as a general operational benchmark. Continuous SFA-based new-outlet capture can shrink the ongoing lag to near-zero once the initial baseline is established.
What an Outlet Universe Is
Your outlet universe is the total addressable retail for your brand within a defined geography, broken down by channel and class. It's not the same as your active customer list, and it's not the same as your served universe. Those are subsets of the whole.
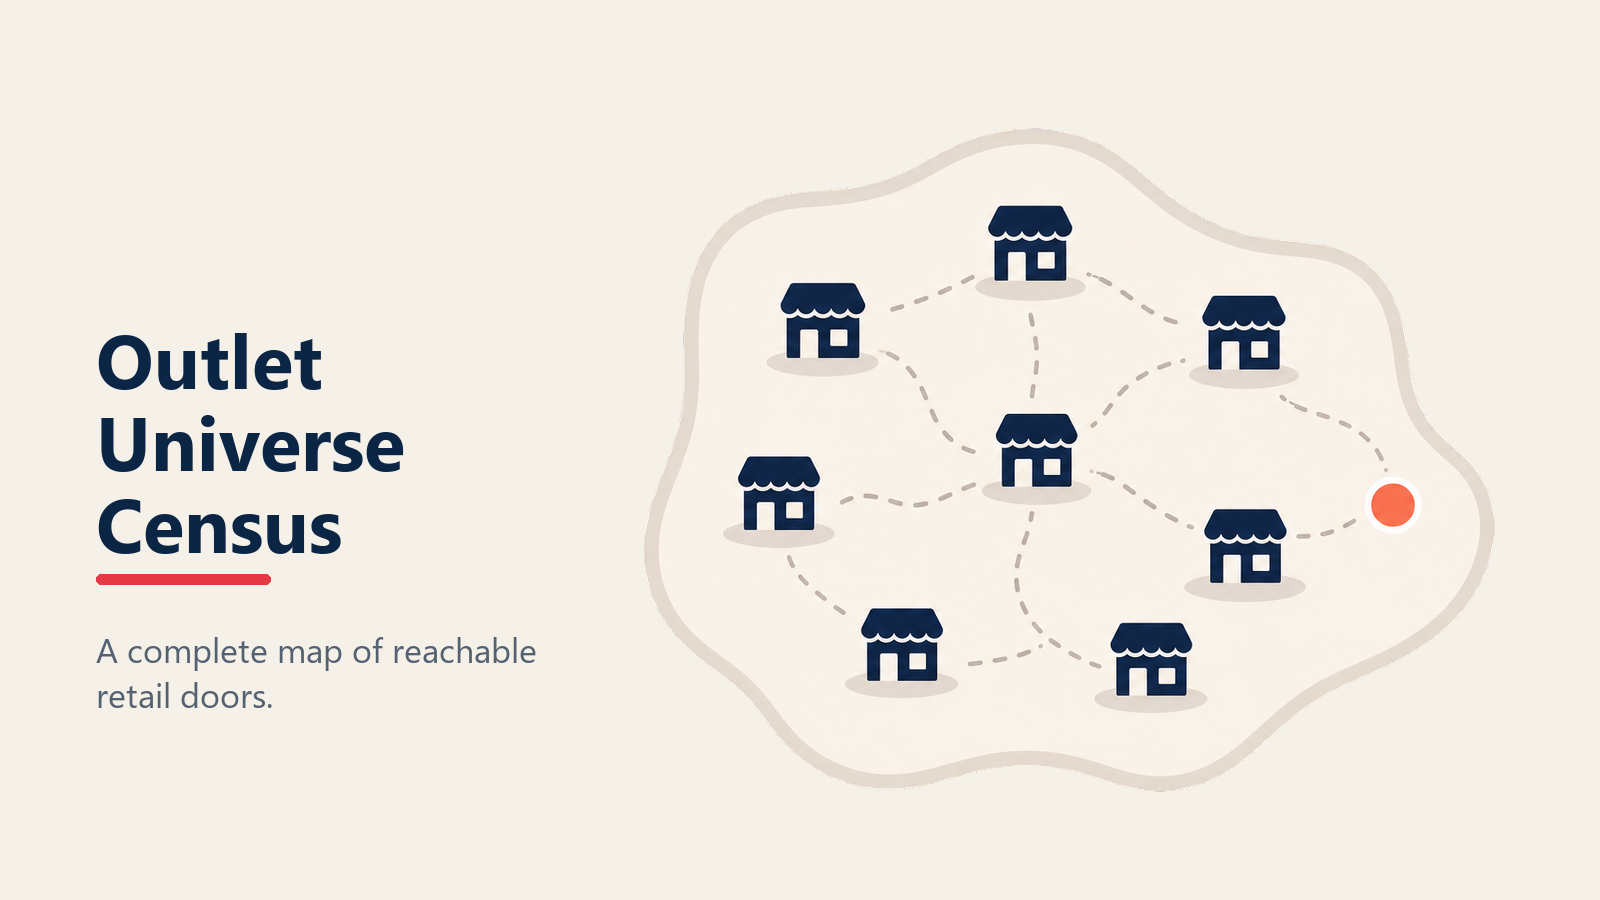
Think of it in three layers:
Total Universe: Every retail point in the territory that sells the category you compete in, regardless of whether you're in distribution there or not. A kirana selling biscuits is in your total universe even if it's never stocked your brand. A convenience store selling beverages is in your total universe even if it sells only a competitor.
Active Universe: The subset of the total universe that your distributor has called on at least once in the last 90 days. These outlets have an account record, they've received at least one order, and they know your brand exists.
Served Universe: The subset of the active universe that meets a minimum service standard: visited on the correct call frequency for their tier, stocked with the defined minimum assortment, and generating sell-out above a threshold.
The gaps between these layers tell you where the growth opportunity sits. The gap between total and active is your numeric distribution opportunity. The gap between active and served is your service quality problem. Most management conversations focus only on the served universe because that's where data is cleanest. But the real growth is in the gaps above.
Census Methods
There's no single right way to build an outlet census. The best approach depends on your market maturity, the quality of existing data, your SFA capability, and how much of the work you want to outsource. Most FMCG operations use a combination of methods.
Field Enumeration (Rep-Based Door-to-Door)
The most thorough method. Reps or dedicated census teams walk every street in a defined geography, knocking on every outlet, recording a minimum data set, and uploading via mobile sales force automation (SFA) tools. In markets with high informal retail density where trade directories are sparse or unreliable, this is often the only way to capture the full universe.
The trade-off is cost and time. A full field enumeration for a mid-size urban territory might take 6-8 weeks if done by regular field reps alongside their visit schedule, or 2-3 weeks if a dedicated census team is deployed. The data quality is high because it's primary, but it depreciates quickly in high-churn markets.
Trade Directory and Distributor Data Reconciliation
Distributors hold customer master data from their own ordering systems. Nielsen, Kantar, and in some markets IRI or similar have trade panel databases. These are faster to access but typically incomplete: distributors list only accounts they've transacted with, directories miss the informal trade, and panel data skews toward larger outlets. The NielsenIQ Vietnam case noted in Key Facts above illustrates exactly how incomplete distributor data masks the real universe: a manufacturer's account list looked adequate while the actual census told a completely different story.
Reconciling these sources against each other, and against your own SFA account list, gives you a quick gap analysis. Where your SFA shows an outlet and the distributor database shows nothing, you have a potential service gap. Where the trade directory lists a cluster of outlets not in either system, you have a prospecting target.
Third-Party Census Providers
In mature markets, specialist census providers maintain regularly updated outlet databases with GPS coordinates, outlet photos, channel classification, and estimated volume tiers. Subscribing to one of these databases is faster than a full field enumeration and often more accurate than internal data, though it comes at cost and may still miss the long tail of informal retail.
Continuous Census via SFA New-Outlet Capture
The most practical long-term approach for teams with mobile SFA deployed. Reps are trained (and in some cases incentivised) to log any new or previously unknown outlet they encounter during their regular beat visits. The SFA captures GPS coordinates, a photo, channel type, and estimated volume and routes the record for validation before it's added to the master universe.
This method turns census from a periodic project into a continuous process. The baseline enumeration is still needed, but subsequent maintenance happens organically as reps work their territories. Once the method is chosen, what data should each outlet record actually contain?
The Census Data Model
The Three-Layer Outlet Universe Model: a structured framework that distinguishes the Total Universe (every retail point selling your category), the Active Universe (outlets called on in the last 90 days), and the Served Universe (outlets meeting minimum service standards on frequency, assortment, and sell-out). Each layer transition identifies a distinct growth opportunity: the gap between Total and Active is your numeric distribution opportunity; the gap between Active and Served is your service quality gap. Commercial planning that only operates on the Served Universe systematically ignores the majority of addressable growth.
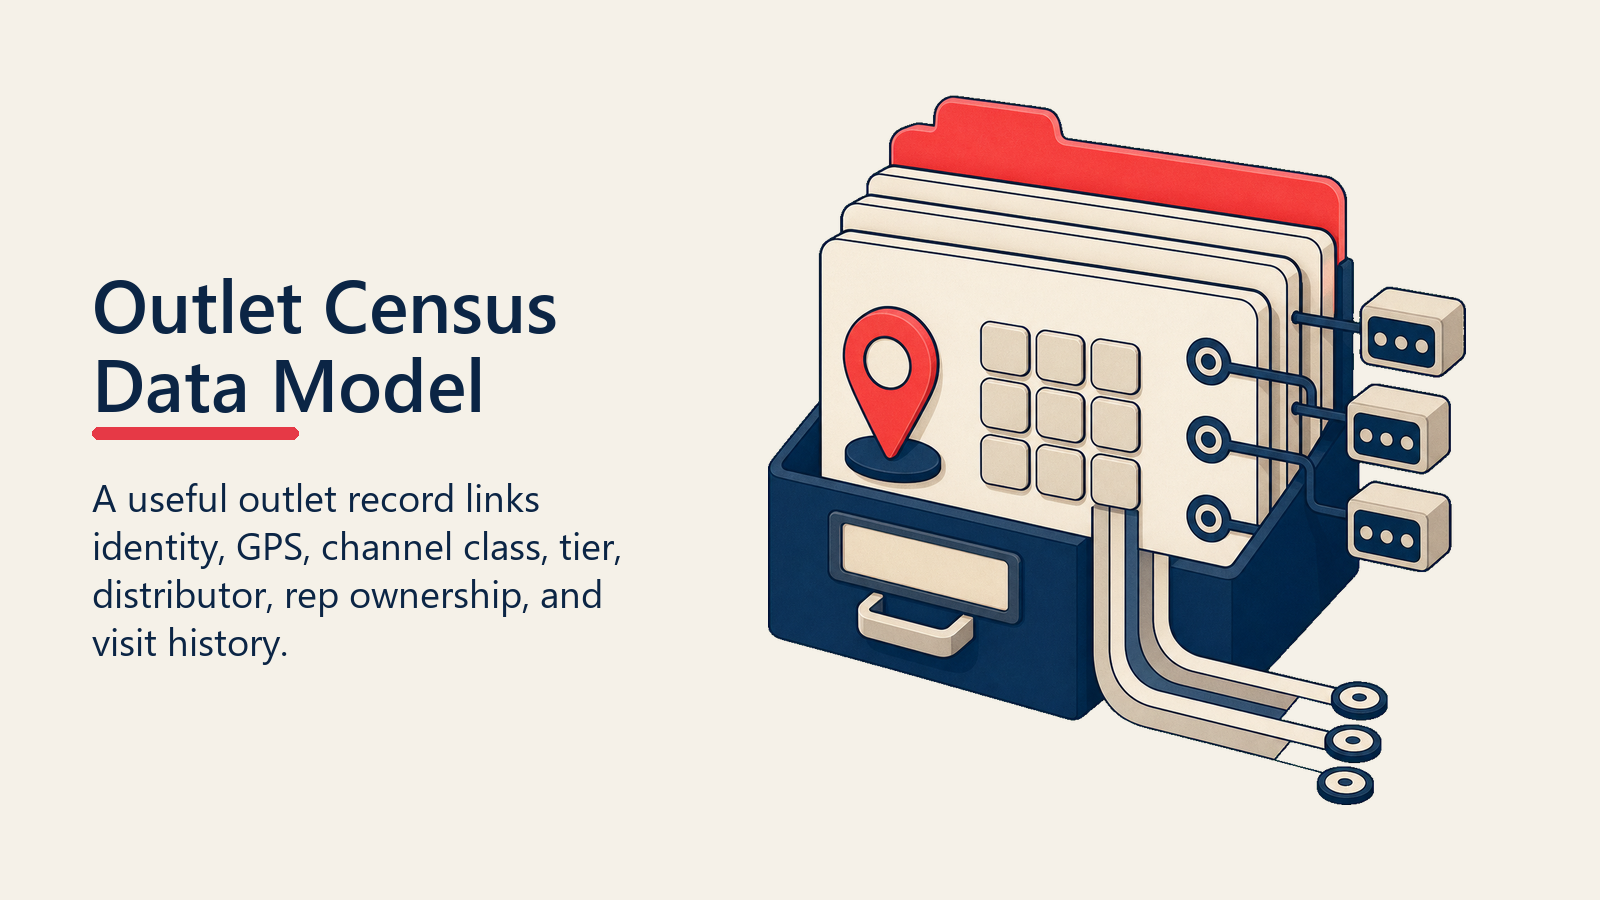
A census record is only useful if it captures consistent fields across every outlet. The minimum viable data model for an FMCG outlet census includes:
| Field | Description | Why It Matters |
|---|---|---|
| Outlet ID | Unique system identifier | Links all downstream records (orders, visits, photos) to one master record |
| GPS Coordinates | Latitude/longitude, precision to 6 decimal places | Enables route mapping, beat assignment, and territory boundary logic |
| Outlet Name | Trading name as displayed on signage | Rep recognition and relationship continuity |
| Owner/Operator Name | Primary decision-maker contact | Critical for new outlet acquisition and credit terms |
| Channel Class | Kirana, grocery, supermarket, convenience, HoReCa, wholesale, pharmacy | Determines assortment, visit objective, and service model |
| Format | Single-unit, chain outlet, informal, formal modern trade | Shapes how commercial negotiation happens |
| Volume Tier | Current monthly offtake estimate (A/B/C/D or numeric band) | Input to segmentation and call frequency assignment |
| Coverage Status | Covered, uncovered, lapsed | Current service state |
| Distributor Code | Which secondary distributor serves this outlet | Accountability and order routing |
| Assigned Rep | Current field rep responsible | Visit accountability |
| Last Visit Date | Date of most recent confirmed call | Frequency compliance monitoring |
| Last Order Date | Date of most recent confirmed order | Activity vs. productivity distinction |
| Outlet Photo | Front-of-store image | Visual verification and monitoring over time |
| Date Added to Universe | When the record was first captured | Census vintage tracking |
| Data Source | How the record was created (field enum, directory, rep capture) | Data quality weighting |
Not every field needs to be populated on day one. But the data model should be defined before enumeration starts, so that every outlet captured shares a consistent structure from the first record. A consistent structure is what lets you compare layers of the universe and spot where the commercial gaps actually sit.
Outlet Universe vs Active Universe vs Served Universe
Understanding the three layers and the gaps between them is where the commercial insight lives. Here's how to read the numbers:
Total Universe: 10,000 outlets Your field enumeration identifies every retail point in the territory that sells or could sell your category.
Active Universe: 6,500 outlets (65% coverage) Of those 10,000, your distributor has called on 6,500 in the last 90 days. The remaining 3,500 are uncovered: either never reached, lapsed after one order, or identified but not yet activated.
Served Universe: 4,200 outlets (42% of total; 65% of active) Of the 6,500 active outlets, 4,200 meet your minimum service standard: they're on the correct call frequency, stocked with at least the minimum assortment, and generating repeat orders.
The gap between 10,000 and 4,200 is your full growth surface. The question is where to allocate resources to close it fastest. That's a segmentation and prioritisation question, and it can only be answered once the census data is clean enough to support it.
How Do You Keep a Census Current?
A census is a living asset, not a one-time project. The question isn't whether your universe will change, it's how fast and through which mechanisms. Retail outlets open, close, change format, shift ownership, and move. The rate at which this happens varies by market, but in urban markets with high informal trade activity, 15-25% of outlets will change in some meaningful way within 12 months of a census.
Annual churn drivers to account for:
- New openings (particularly in growing residential areas and new commercial strips)
- Permanent closures (financial failure, lease loss, owner exit)
- Format upgrades (a kirana adding a chiller and becoming a convenience-format outlet)
- Relocations (particularly street vendor and informal pop-up formats)
- Ownership changes (with new owners sometimes resetting credit terms and brand preferences)
The refresh cadence should match the churn rate in your market. In low-churn mature markets, an annual full refresh with quarterly spot-checks might be sufficient. In high-growth, high-density markets, a quarterly refresh of high-priority areas plus continuous SFA-based new outlet capture is closer to what's needed. As a rough planning benchmark, informal field experience across emerging markets suggests urban outlet churn of 15 to 25% annually from openings, closures, format changes, and relocations, though the actual rate varies significantly by market density and economic growth rate. NielsenIQ's tracking of FMCG retail channel shifts confirms that traditional trade continues to rebound and evolve in most emerging markets even as modern and digital channels grow, which means the outlet mix in a census can shift materially within 12 months in fast-growing urban areas.
Build the refresh schedule into the annual field calendar. Assign it to area managers as a formal deliverable, not an ad hoc activity. And set a data quality threshold: if a territory's outlet database hasn't been refreshed in more than six months, flag it before you let that territory's outlet count be used in capacity planning.
Using the Census for Planning
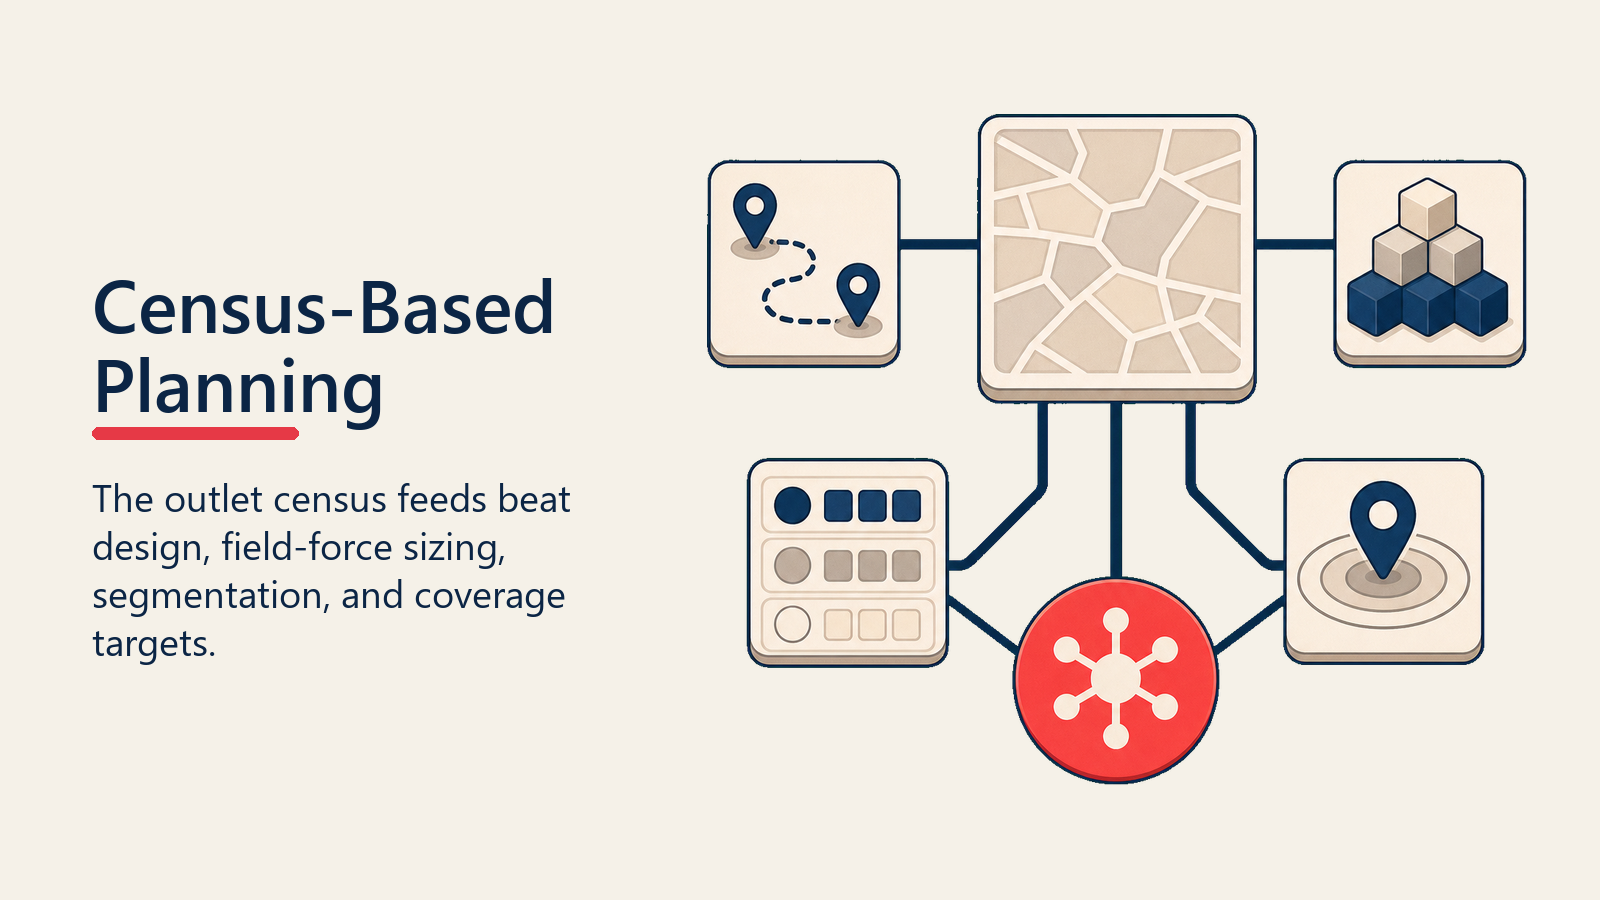
The outlet census feeds four downstream planning processes directly:
Beat Design: You can't define what goes on a beat until you know the outlet universe. Beat boundaries, call sequence, and daily stop counts all depend on knowing how many outlets exist, where they are, and how often they need to be visited. Beat and journey planning is only as good as the census it starts from.
Field Force Sizing: The total visit demand across all outlets in all tiers, divided by a rep's available call capacity, gives you the minimum headcount to cover the universe at defined standards. Miss outlets in the census and you'll under-staff. Double-count outlets and you'll over-staff. See Field Force Sizing and Structure for the full calculation.
Segmentation: You can't segment what you haven't enumerated. Outlet Segmentation and Classification requires a clean, current universe as input. Running segmentation on an incomplete census produces a skewed allocation of rep time and trade spend.
Coverage and Frequency Targets: Setting numeric distribution targets requires knowing the total universe they're measured against. A target of 80% numeric distribution means nothing without knowing what 100% looks like. Coverage and Frequency Optimization explains how to translate census data into coverage targets that are ambitious but achievable.
Frequently Asked Questions about Outlet Universe and Census
What is an outlet census in FMCG?
An outlet census is a systematic enumeration of every retail point within a defined territory that sells, or could sell, your category. It captures a minimum data set for each outlet, including GPS coordinates, channel class, volume tier, and coverage status. The census is the foundation that segmentation, beat design, field force sizing, and numeric distribution targets are all built on. Without it, commercial decisions rest on incomplete distributor account lists that typically miss 30 to 50% of the addressable universe.
How is the total universe different from the active universe?
The total universe includes every retail outlet in your territory that stocks your category, including outlets where you have no distribution. The active universe is the subset your distributor has called on in the last 90 days. The served universe is the subset of active outlets meeting minimum service standards on visit frequency, assortment, and sell-out. Each layer down represents a narrowing of commercial activity. The growth opportunity sits in the gaps between layers, particularly between total and active.
How often should an outlet census be refreshed?
In high-density urban markets with significant informal trade, a quarterly refresh of high-priority areas plus continuous SFA-based new-outlet capture by field reps is closer to what's needed. In lower-churn markets, an annual full refresh with quarterly spot-checks may be sufficient. The practical test is whether your outlet count in a territory has changed significantly since the last refresh. If a territory's database hasn't been updated in six months or more, the headcount and beat decisions built on it are probably misaligned.
What is the minimum data model for a census record?
At minimum, each outlet record needs a unique outlet ID, GPS coordinates, channel class, volume tier estimate, coverage status, assigned distributor, and assigned rep. These fields are what enable downstream decisions: GPS enables route mapping; channel class determines assortment and service model; volume tier drives call frequency; coverage status distinguishes active from lapsed from uncovered. Adding outlet photo and last-visit and last-order dates brings the record to the point where it can support quality monitoring, not just planning.
How do you use the census for field force sizing?
Total visit demand across all outlets in all tiers, at their defined call frequency, divided by a rep's available call capacity per month, gives the minimum headcount required to cover the universe at standard. For example, if your census contains 8,000 outlets across four tiers, and the weighted average call frequency across tiers translates to 4,500 calls per month, a rep covering 25 calls per day and 22 days per month handles 550 calls per month. That universe requires roughly 8 reps. Undercounting outlets understaffs; overcounting overstaffs. The census is where the sizing logic starts.
What's the risk of using distributor data as a substitute for a census?
Distributor data only captures accounts the distributor has transacted with. It systematically misses: lapsed accounts that haven't ordered in the cycle window, new outlets that opened after the distributor's last territory scan, informal trade not registered in any system, and outlets served by competing distributors. Using this data as the universe inflates your apparent coverage percentage while hiding the actual distribution gap. An 85% coverage figure built on a distributor list may represent 40% of the true outlet universe.
Learn More
For FMCG field teams building or rebuilding their outlet coverage model, these resources connect the census to the decisions that depend on it:
- Outlet Segmentation and Classification - how to prioritise the universe once you've counted it
- Beat and Journey Planning - designing rep routes from census data
- Coverage and Frequency Optimization - translating outlet counts into visit standards
- Field Force Sizing and Structure - using the census to size headcount
- Ideal Customer Profile - how to define which outlets to prioritise for acquisition
- Territory-Based Routing - geographic logic for assigning outlets to reps
- Beat and Route Journey Planning - beat design principles from the pharmaceutical field sales context
