Secondary Sales and Stock Visibility: Closing the FMCG Data Gap Between Warehouse and Shelf
Turn this article into takeaways for your work.


Each assistant summarizes the article only for you and suggests best practices for your work.
The illusion of growth is one of the most dangerous conditions in FMCG commercial management.
Your primary sales numbers are up. The distributor placed a large order last week. Regional sales targets are on track. And then a field rep calls in to report that three of the highest-traffic general-trade outlets in the territory have been out of stock for four days. The product exists. It's sitting in the distributor's warehouse. But it hasn't moved to the shelf.
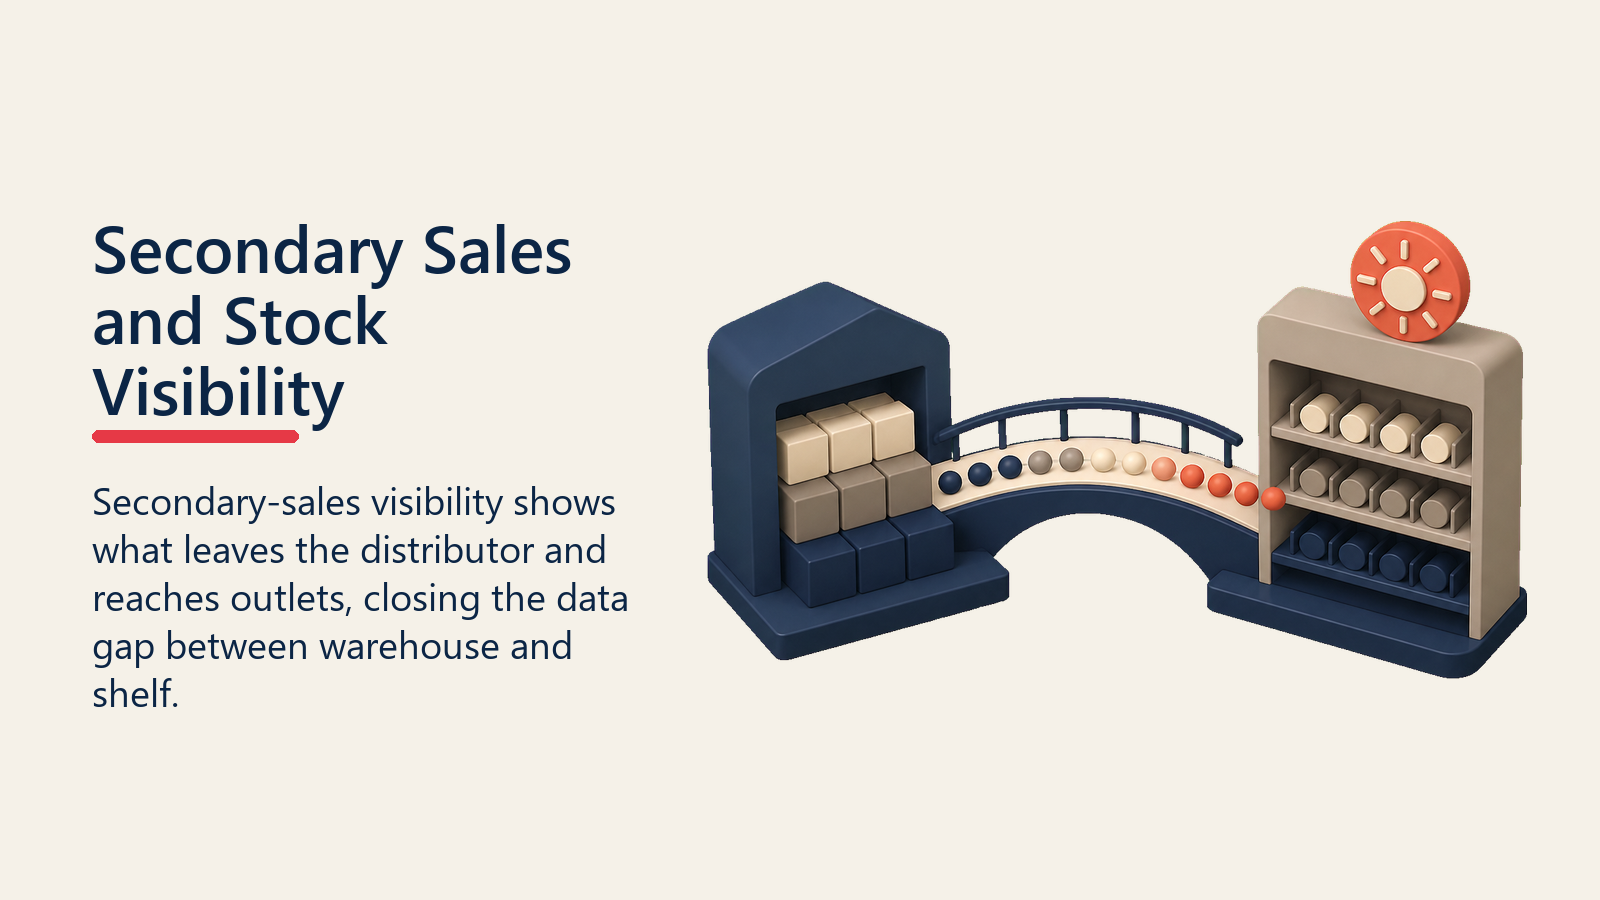
That's the gap that primary sales data can't see. It measures what moved from your factory or national DC into a distributor's warehouse. It doesn't measure what moved from that warehouse to the shelf where the consumer makes a purchase decision. The space between those two data points is where stockouts accumulate, where demand planning errors compound, and where you discover, weeks after the fact, that the sales growth on your dashboard was distributor stock-building, not consumer pull-through.
Secondary sales and stock visibility is the data layer that closes this gap. It's not a reporting exercise. It's the operational intelligence that drives out-of-stock reduction, replenishment decisions, and demand plan accuracy at the territory level.
Primary vs Secondary Sales: The Definitions and the Cost of the Gap
Primary sales are sales from the manufacturer (or national importer) to the distributor. They represent inventory loading: the distributor buys product, takes ownership, and holds it in their warehouse. Primary sales are what most FMCG companies report as revenue, track in their ERP systems, and use to measure sales team performance.
Secondary sales are sales from the distributor to outlets: pharmacies, general-trade shops, supermarkets, minimarkets, and any other channel partner that purchases from the distributor. Secondary sales represent actual market demand: the product is leaving the distribution system and reaching the point of sale where consumers buy it.
The gap between them is distributor inventory. When primary sales consistently exceed secondary sales over a multi-week period, inventory at the distributor is building. This can indicate demand forecasting errors (the distributor was given more product than the market can absorb), promotional loading (distributor stocked up ahead of a promotion that hasn't delivered the expected sell-out), or distributor forward-buying behavior (stocking up ahead of a price increase or to qualify for a volume incentive). All three scenarios look like revenue growth on a primary-sales dashboard while creating either an imminent stockout risk (if the over-stock is concentrated in slow-moving SKUs and expires) or a future demand air pocket (when the forward-bought inventory absorbs the next few weeks of expected orders).
When secondary sales consistently exceed primary sales, the distributor is drawing down inventory. This looks sustainable until the inventory hits a critical low level and the distributor's ordering behavior changes suddenly: they either rush a large order (creating a demand spike in your supply plan) or they run out of stock and outlets start going empty.
Closing that gap starts with choosing the right collection method.
Primary vs Secondary Sales: Comparison
| Dimension | Primary Sales | Secondary Sales |
|---|---|---|
| What it measures | Manufacturer to distributor shipment | Distributor to outlet offtake |
| Where it lives | ERP / order management system | DMS, van sales app, field survey |
| Update frequency | Per invoice / per shipment | Daily (DMS), weekly (field survey) |
| Demand signal quality | Distributor stocking behavior | Actual market demand |
| Stockout visibility | None | Direct (if stock-on-hand captured) |
| Demand planning value | Input to shipment history models | Input to sell-out forecasting models |
| Expiry risk visibility | None | Yes (stock-on-hand x days-of-cover) |
Key Facts: Secondary Sales and Stock Visibility
- In the US market specifically, NielsenIQ estimated that retailers lost over $82 billion in sales to out-of-stock and out-of-shelf situations in 2021 alone, with 7.4% of CPG sales not realized due to stock gaps (NielsenIQ, 2022). As a general benchmark across FMCG markets, out-of-stock rates typically run in the 5-10% range for SKU availability at point of sale, a practitioner estimate that varies by channel, country, and category.
- Global retail out-of-stock rates fell from 10.7% in 2022 to 6.5% in 2023 as supply chain pressures eased, but store-level ordering and replenishment failures, not upstream production, remain the dominant root cause (FMI supply chain efficiency analysis, 2024). Secondary-sales visibility addresses precisely this downstream cause category.
- FMCG companies using structured digital distribution tracking report 20-25% lower inventory costs than those relying on manual primary-sales-only data, according to McKinsey CPG channel research. Distributor management system (DMS) adoption at the distributor level is the primary mechanism through which this efficiency gap closes.
What Are the Best Data Collection Methods for Secondary Sales?
Four methods collect secondary-sales and stock-level data from the distribution channel. Each has different cost, coverage, and data-quality characteristics. Most FMCG companies use a combination of two or three.
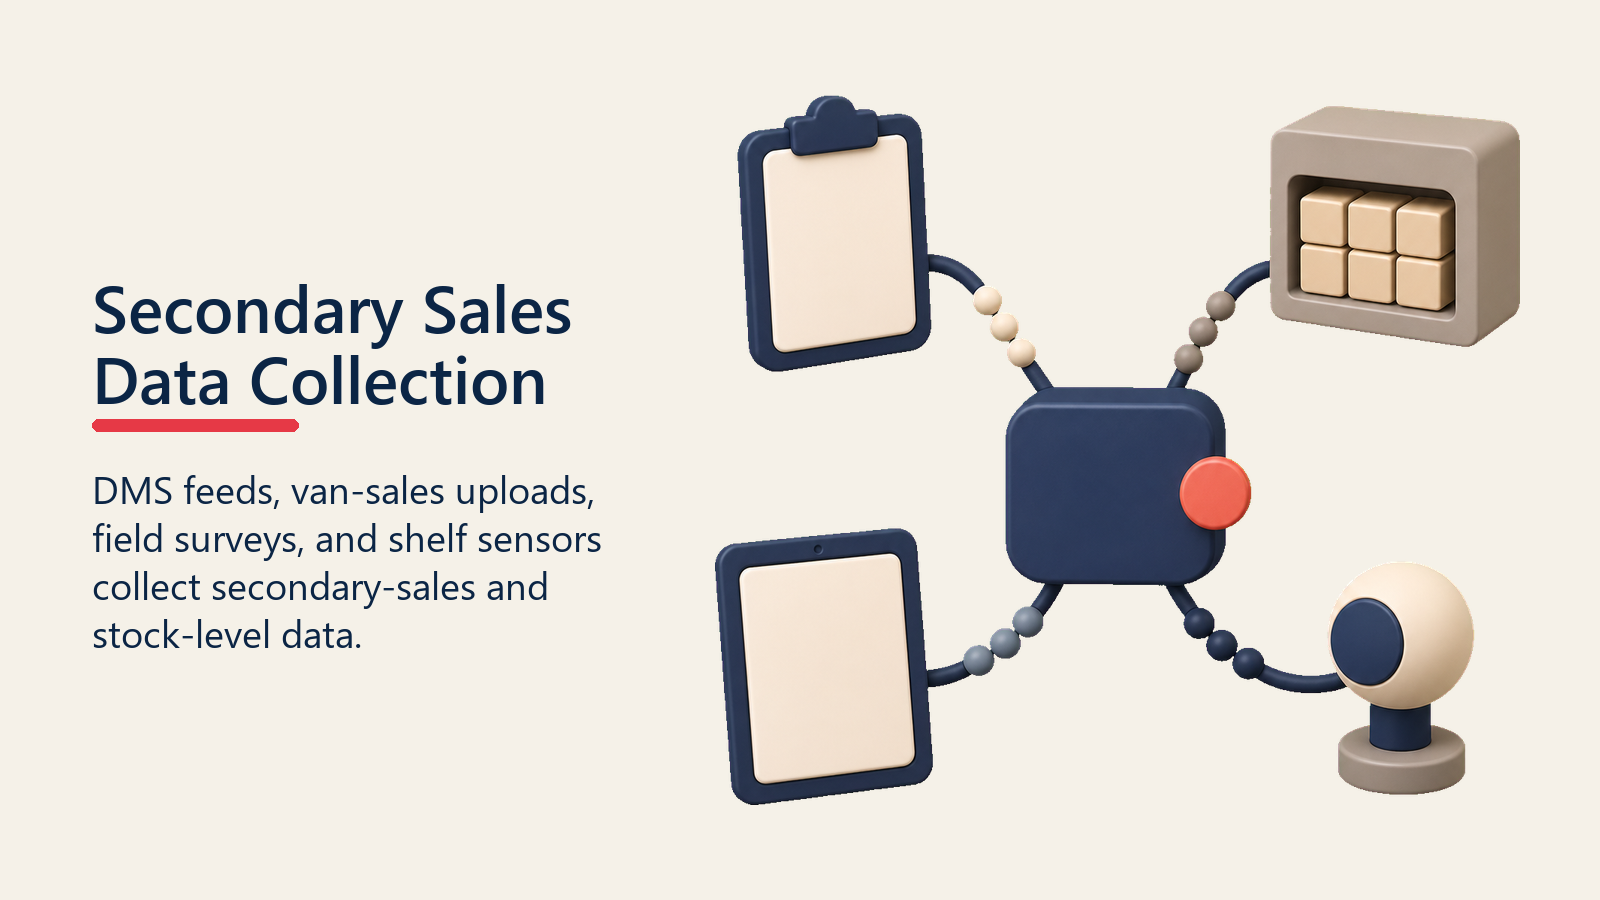
DMS pull. A DMS is a software platform deployed at the distributor that captures every secondary-sales transaction, van sales order, and stock movement in near-real time. When your distributor uses a DMS (either one you supply or their own), you can establish a data feed that pulls daily transaction data into your commercial reporting system. DMS data is the highest-quality secondary-sales data available: it's transactional, timestamped, and captures SKU-level sell-out to named outlets. The challenge is that DMS adoption among distributors varies enormously by market. Large distributors in organized markets often have capable DMS platforms. Small distributors in fragmented general-trade markets may run on paper or basic spreadsheets. See SFA and DMS Systems for the technology selection and implementation framework.
Van sales upload. Many FMCG companies equip distributor van salespeople with handheld devices or mobile apps that capture orders at outlet level during the sales call. The van salesperson scans product, confirms quantities, and submits the order digitally. The transaction data feeds back to the distributor's system and, with the right integration, to your visibility platform. Van sales data is slightly less complete than a full DMS feed (it typically covers the van salesperson's own route, not walk-in orders at the distributor's counter), but it's real-time and captures the field-level data that DMS back-office systems sometimes miss.
Field rep survey. Where DMS or van sales technology isn't available, field reps can manually record outlet stock levels during their calls. A structured form captures stock on hand, estimated days-of-cover, out-of-stock status by SKU, and any unusual demand conditions observed. Field survey data is less reliable than transactional data (rep estimates are subject to error and inconsistency) and covers fewer data points per visit (a rep can't count every SKU in a busy shop in a 5-minute call). But it's far better than nothing, it's available immediately without technology investment, and it covers outlets that DMS and van sales platforms don't reach.
IoT shelf sensors. An emerging method, relevant primarily for modern trade. Weight sensors or computer-vision cameras at shelf level detect real-time stock depletion and trigger replenishment alerts when a product drops below a defined threshold. Shelf sensor data is highly accurate and entirely passive (no rep or distributor action required), but it requires modern-trade retailer cooperation, significant hardware investment, and is currently practical only in high-volume organized-trade formats where the unit economics justify the technology cost. Not a general-trade solution in most markets today.
Data Collection Method Comparison
| Method | Data Quality | Coverage | Cost | Real-Time? | Best For |
|---|---|---|---|---|---|
| DMS pull | High (transactional) | Distributor portfolio | Medium (integration) | Yes | Organized market distributors |
| Van sales upload | High (transactional) | Van routes | Low-Medium | Yes | Mobile-equipped van teams |
| Field rep survey | Medium (estimated) | All call points | Low | No (daily/weekly upload) | Markets without DMS |
| IoT shelf sensor | Very high (automated) | Modern trade | High | Yes | High-volume MT formats |
With a collection method in place, four derived metrics turn the data into operational decisions.
Key Metrics
Four metrics derived from secondary-sales and stock-visibility data drive operational decisions. Each requires a defined data source and a defined action threshold.
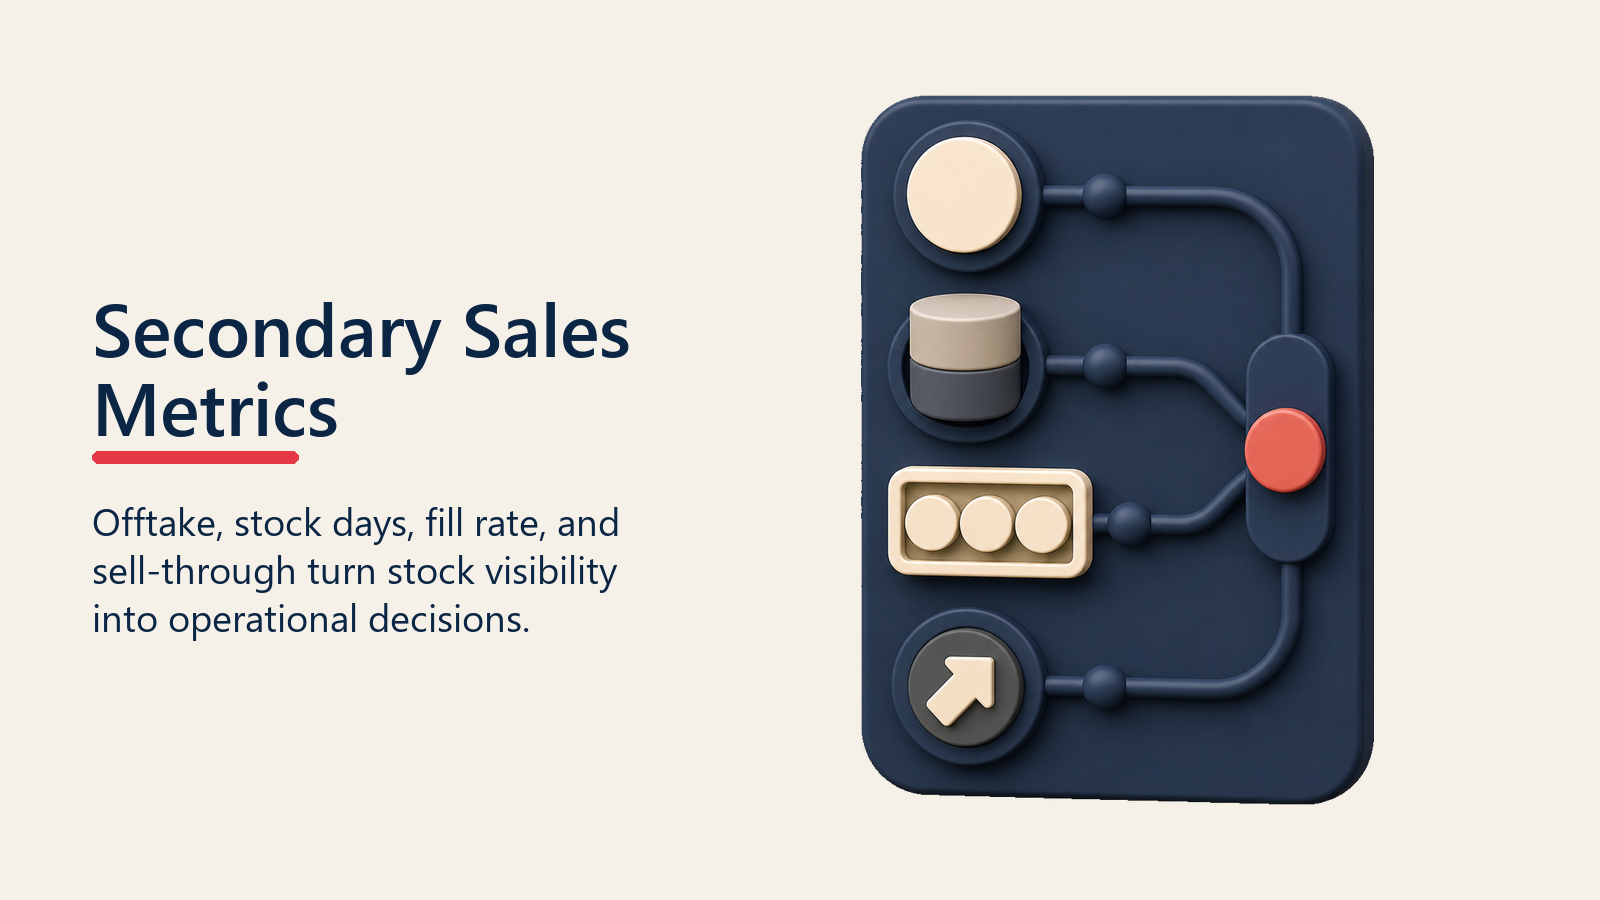
Secondary-sales offtake by SKU and territory. Measured in cases or units per defined period (week, month). Tracked against the demand plan for that territory and SKU combination. When secondary offtake runs more than 15% below plan for two consecutive weeks, it's an early warning that either the demand plan was wrong, a competitor is taking share, or a promotion is underperforming at outlet level.
Stock days on hand. Total current stock at the distributor's warehouse (in cases) divided by average daily secondary-sales offtake (cases per day). This is the single most important stock-visibility metric. The calculation gives you the number of days until the distributor runs out of stock at the current sell-out rate.
Stock days calculation example:
- Current distributor stock: 2,400 cases
- Average daily secondary sales (last 30 days): 80 cases per day
- Stock days on hand: 2,400 / 80 = 30 days
A 30-day stock cover is within the normal operating range (contract floor typically 21 days, ceiling typically 60 days). If stock days drop below 14, the distributor needs to reorder immediately to avoid stockouts before the next scheduled replenishment. If stock days exceed 60, you have an overstock situation that creates expiry risk.
Fill rate at outlet level. The percentage of outlet orders that are fulfilled in full (correct SKUs, correct quantities, within the agreed delivery window). Fill rate measures whether the distributor is delivering what outlets order. A fill rate below 90% signals an operational problem at the distributor: either inadequate stock levels, routing inefficiency, or order processing failures. Track by distributor, by territory, and by SKU tier.
Sell-through rate. Secondary sales in a period divided by total stock available at the start of the period (opening stock plus primary sales received). Expressed as a percentage. As indicative planning thresholds, a sell-through rate above 85% generally indicates healthy demand relative to stock, while a rate below 60% over two or more periods points to demand underperformance relative to stock held, creating building inventory and eventual expiry risk. Calibrate these thresholds against your category's velocity and the distributor's stock cover norms.
Data at rest is just reporting. Here's how to tie it to field action.
Turning Data into Action
Data that doesn't trigger an action is just reporting. The operational value of secondary-sales visibility comes from the decision rules that link data signals to field actions.

Out-of-stock alerts. When a territory's DMS data or field survey shows zero stock on any A-class SKU (top-velocity products), an automated alert should reach the territory manager and regional sales manager within 24 hours. The alert triggers a standard response: confirm whether the distributor has stock in their warehouse (supply failure) or stock exists but isn't being replenished to the outlet (execution failure), then resolve accordingly. A supply failure escalates to the national distribution manager. An execution failure escalates to the distributor's operations manager. Response SLA: resolution initiated within 24 hours of alert. See Outlet Out-of-Stock Reduction for the full response framework.
Replenishment triggers. Stock-days-on-hand data enables proactive replenishment scheduling. When a distributor's stock cover drops to the trigger threshold (typically 14-21 days, depending on lead times), an automated replenishment recommendation generates in the order management system. This moves from reactive ordering (distributor calls when they've run out) to proactive planning (you and the distributor agree a reorder calendar aligned to projected sell-out). Proactive replenishment reduces stockout frequency more than any other single operational change in distributor management.
Route resequencing. When secondary-sales data reveals that certain outlets on a van route are running consistently lower on stock than others, it may indicate that visit frequency or sequence is misaligned with outlet demand. High-velocity outlets need more frequent calls. The data from the van sales app or field survey can be used to resequence routes so that the highest-demand outlets receive priority service scheduling. This is an operational optimization that most FMCG companies leave to the distributor's discretion; building it into the commercial management process changes the outcome.
Distributor Compliance and Incentives
Secondary-sales reporting is only as good as the distributor's compliance with data submission requirements. Without enforcement mechanisms, submission quality degrades over time.
Contractual requirement. The distribution agreement must specify: the data format (fields required, level of detail), submission frequency (daily DMS feed or weekly manual upload), submission deadline, and the tool or template used. Vague reporting requirements produce vague data. Specific requirements produce specific data. This is not negotiable: secondary-sales reporting is a core obligation of the distribution agreement, not a favor the distributor does when convenient.
Compliance incentive structure. Linking incentive payments to secondary-sales data quality and timeliness is the most effective enforcement mechanism. A commonly used structure: 100% of quarterly incentive payment available when secondary-sales reporting compliance exceeds 90% for the quarter (reports submitted on time, in full, in the agreed format). Reporting compliance between 75-90% earns 70% of the incentive. Below 75% forfeits the incentive for that quarter. The financial consequence focuses the distributor's attention on reporting in a way that relationship management alone cannot achieve.
Upside rewards for data quality. Beyond compliance penalties, reward distributors who provide high-quality, granular secondary-sales data with additional commercial benefits: priority allocation during supply-constrained periods, early access to new product launches, or co-investment in van sales capacity. When the distributor sees that good data quality gives them a commercial advantage, the reporting discipline becomes self-sustaining.
Integration with Demand Planning
Secondary-sales and stock-visibility data doesn't just improve distributor management. It fundamentally changes the quality of demand planning.
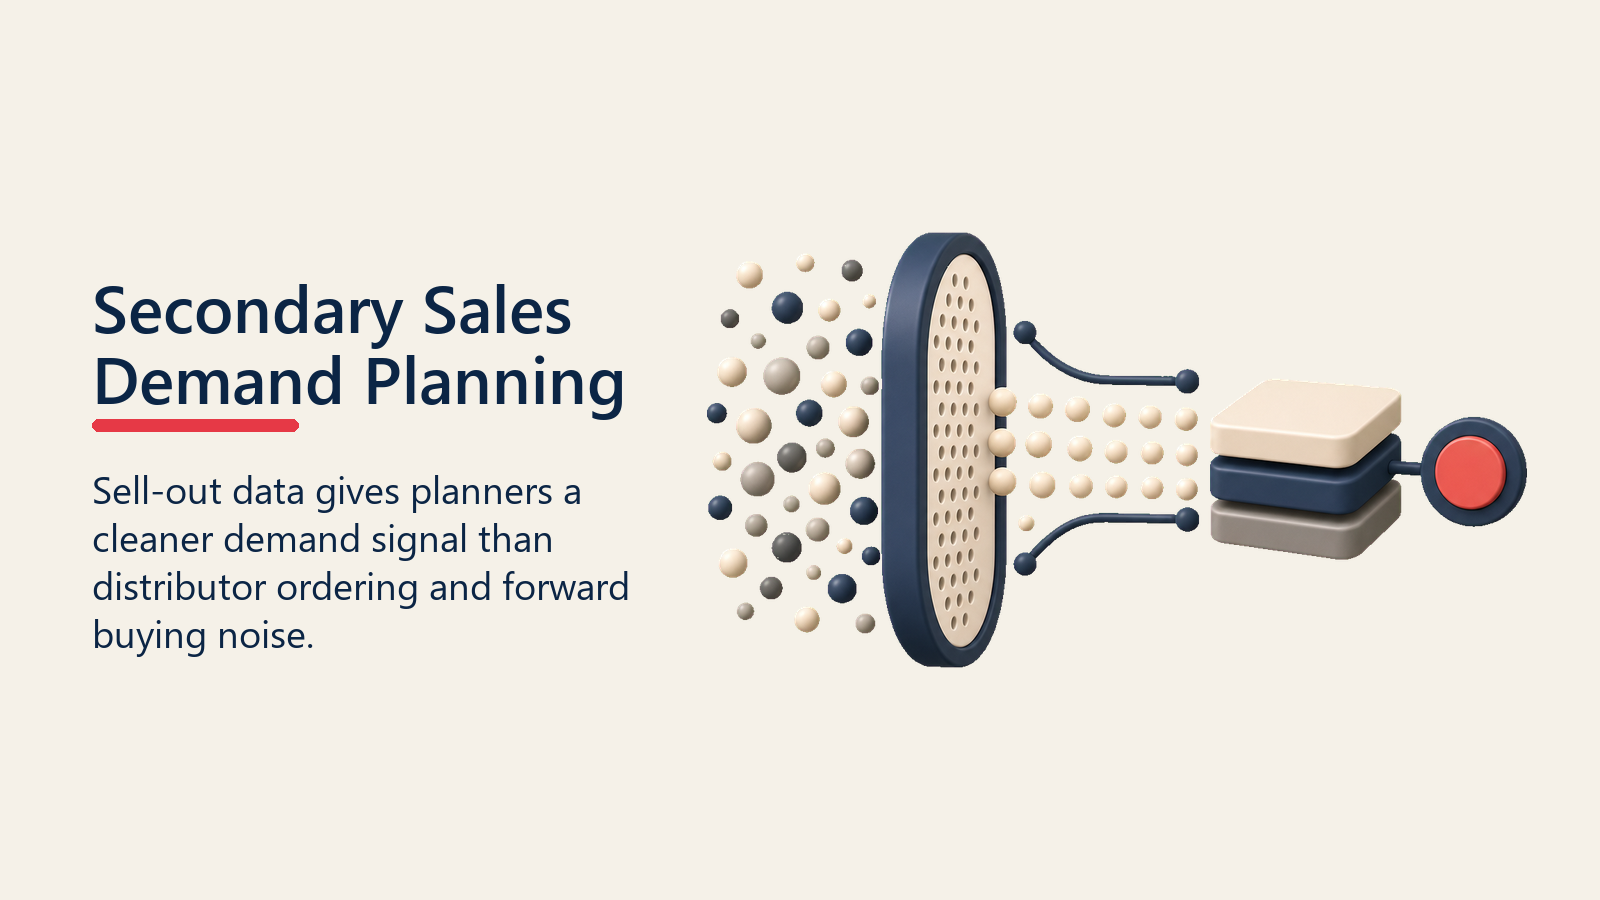
When planners can see secondary-sales offtake at SKU-territory level, they're forecasting from actual consumer demand, not from distributor ordering patterns. The behavioral noise that primary sales data carries (forward-buying, stock-building, promotional loading) disappears from the demand signal. What remains is a much cleaner read on what the market is actually consuming. Bain's emerging-market FMCG research identifies secondary-sales data integration as one of the key differentiators between companies that grow share in fragmented channel environments and those that manage to volume targets alone.
The integration path from secondary-sales data to the S&OP process requires three things: a data aggregation layer that consolidates secondary-sales feeds from all distributors into a single planning input, a cadence for incorporating field-level stock visibility into the monthly demand review, and a feedback loop that tells the field team what the demand plan committed to, so they can confirm or challenge it from ground-level observation.
See Demand Planning and Field Alignment for the complete framework for connecting field intelligence to central planning cycles. See Retail Execution Analytics for the broader analytics layer that uses secondary-sales data as an input into commercial performance measurement. The inventory visibility principles for multi-tier distribution in pharma channels are covered in the Learn More section below and apply directly to the FMCG context.
The distributor ROI framework that consumes secondary-sales data as its primary performance input is at Distributor Management and ROI.
The Primary-Secondary Visibility Stack
The stack shows which sales layer each data source captures and where forecast distortion enters the system.
The Primary-Secondary Visibility Stack: FMCG commercial data exists in three layers, and most organizations only see the first. Layer 1 is primary sales: what moved from the manufacturer into the distributor's warehouse (visible in ERP, real-time). Layer 2 is secondary sales: what moved from the distributor to the outlet (visible only via DMS, van-sales apps, or field surveys, and missing entirely from most P&L dashboards). Layer 3 is tertiary or consumer off-take: what consumers actually bought (visible only through panel data or POS scan feeds from modern trade). Demand planning errors compound because Layer 1 data is used to forecast Layer 3 behavior, skipping the Layer 2 signal entirely. Secondary-sales visibility programs close the Layer 2 gap. They don't require panel data, just a structured collection method from the distribution channel. The improvement in forecast quality is immediate once the data flow is established, because the behavioral noise in Layer 1 (distributor forward-buying, promotional loading) no longer dominates the demand signal.
"Primary sales tell you what the distributor bought. Secondary sales tell you what the market took. The difference between them is the gap your stockout prevention depends on."
"A distributor who doesn't submit secondary-sales data on time is a distributor whose performance you cannot measure. That's not a data problem; it's a commercial contract problem."
"Stock days on hand is the single metric that collapses all secondary-sales data into one operational decision. If you only measure one thing at the distributor level, measure this."
Conclusion
Secondary-sales visibility is the connective tissue between the factory and the consumer. Without it, you're managing a commercial system with a fundamental data gap: you know what you shipped into the channel, but you don't know what the channel is doing with it.
Closing that gap doesn't require a technology transformation. It requires a data collection strategy (DMS where available, van sales apps and field surveys where not), clear contractual requirements on reporting, compliance incentives that make submission a priority for distributors, and a demand planning process that uses the data once it arrives.
When those elements are in place, stockout reduction follows. Demand planning accuracy improves. Distributor performance conversations become specific and data-grounded rather than anecdotal. And the commercial decision-making that determines how stock moves from factory to shelf becomes responsive to what's actually happening at the outlet, not what happened three weeks ago when the last primary-sales shipment went out.
Frequently Asked Questions about Secondary Sales and Stock Visibility
What is the difference between primary and secondary sales in FMCG?
Primary sales measure product moving from the manufacturer or national importer into the distributor's warehouse. Secondary sales measure product moving from the distributor to the outlet where consumers buy it. The gap between them is distributor inventory. Most FMCG companies measure and report primary sales, which tells you about distributor stocking behavior. Secondary sales tell you about actual market demand. Both are needed for effective commercial management.
How do you calculate stock days on hand at a distributor?
Divide the distributor's current total stock (in cases) by their average daily secondary-sales offtake (cases sold to outlets per day). The result is the number of days until the distributor runs out of stock at the current sell-out rate. A stock of 2,400 cases with an average of 80 cases per day in secondary sales gives you 30 days of stock. Compare this against your contracted floor (typically 21 days) and ceiling (typically 45-60 days) to identify replenishment needs or overstock risks.
What is a reasonable secondary-sales reporting compliance target for distributors?
A compliance rate of 90% or above (reports submitted on time, in full, in the agreed format) is a standard contractual target for primary distributors. Below 75% for any quarter should trigger a compliance review under the incentive structure. Linking incentive payments to compliance rate is the most effective enforcement mechanism, more reliable than relationship management or periodic reminders.
What data should a distributor management system (DMS) capture?
At minimum: every secondary-sales transaction (date, outlet name, SKU codes, quantities, price), current stock-on-hand by SKU, van salesperson ID and route, and delivery performance (ordered versus fulfilled). Additional useful fields include outlet-level reorder history, van call frequency per outlet, and near-expiry stock flags. The level of detail your DMS captures determines the granularity of the out-of-stock alerts, fill-rate calculations, and demand-plan inputs you can generate.
How do you get distributors to adopt DMS reporting consistently?
Start with the contract: DMS reporting must be a contractual obligation, not an optional request. Then provide commercial incentives: tie reporting compliance to incentive payment eligibility. Then make the reporting as easy as possible: supply the DMS platform, train their team, and integrate submission into their van sales workflow rather than adding it as a separate end-of-day task. Finally, demonstrate value: show the distributor how DMS data helps them manage their own inventory, reduce expiry risk, and optimize their van routes. When they see that the data benefits their operation, adoption follows.
Learn More

Senior Implementation Consultant