Coverage and Frequency Optimization: Balancing Visit Depth and Breadth for Maximum Distribution Gain
Turn this article into takeaways for your work.


Each assistant summarizes the article only for you and suggests best practices for your work.
Every rep visit is a choice. Spend today calling on the 40 outlets already in the beat, or push into the 12 unvisited ones three streets over. Serve the Gold accounts that need attention, or get one more visit into the Diamond store before the promotion closes. Neither answer is always right. The math behind that choice determines how much growth a field team actually generates in a quarter.
Coverage and frequency optimization is how commercial directors make that math explicit. Field teams stop deciding by intuition and start allocating visit capacity the way a CFO allocates budget.
The Coverage vs Frequency Trade-Off
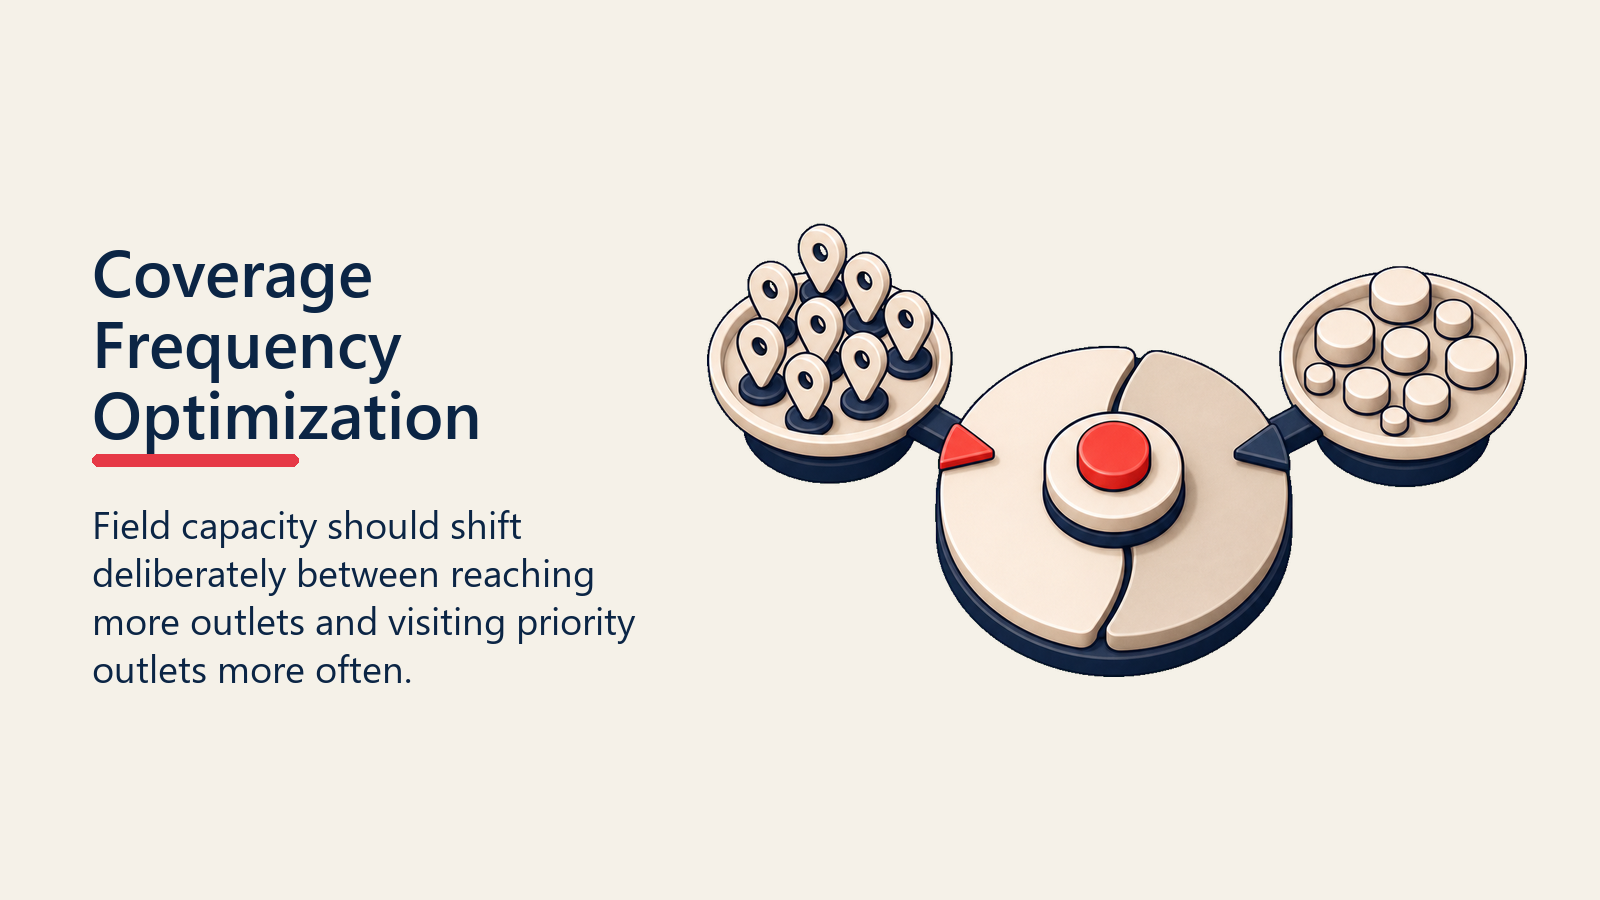
Coverage and frequency pull in opposite directions. Adding new outlets to a beat increases reach but dilutes the time each outlet receives. Deepening frequency on existing accounts improves execution quality and share of shelf but limits how many outlets a rep can serve in a week.
Key Facts: Coverage and Frequency in FMCG
- In one NielsenIQ Vietnam study (biscuits and cakes category), a manufacturer with 85% national distribution was absent from stores accounting for 57% of category sales in one key region, per NielsenIQ's distribution strategy analysis. The numbers are single-market, but the pattern is consistent: national coverage figures routinely mask regional and channel-tier gaps that represent the majority of accessible growth.
- Moving a high-value outlet from fortnightly to weekly visits typically delivers 8-15% incremental revenue in the first cycle, while the same frequency increase at a Bronze outlet yields under 2%. (Industry estimate based on FMCG field operations practice; actual lift varies by category, outlet type, and market.)
- According to FieldAssist's 2026 FMCG productivity benchmarks (FieldAssist is an SFA and retail execution platform), average FMCG teams spend 45% of working time on travel versus 35% on in-store selling, with the remaining ~20% on admin. High performers improve that split significantly. Over-serving convenient low-tier accounts is one of the primary drivers of this imbalance.
Quotable Nuggets: Coverage and Frequency
- "The signal to act is never gut feel. It's the SFA log showing where reps actually spent their visits versus where the tier-frequency standard said they should." That gap is the most direct diagnostic available to a field sales director.
- NielsenIQ's distribution optimization guide defines distribution efficiency as weighted distribution divided by numeric distribution. A brand with high numeric but low weighted distribution is present in the wrong stores and absent from the ones that move volume.
- Frequency increases at Diamond accounts compound. A step-change to twice-weekly visit cadence typically delivers an estimated 15-25% compliance improvement in the first cycle (field operations estimate; actual lift varies by category and execution baseline), producing revenue lift that a purely coverage-focused strategy cannot replicate at those accounts.
The Tiered Frequency Allocation Framework: A method for distributing field visit capacity across outlet tiers based on each tier's volume-frequency curve and diminishing-returns profile. Diamond accounts receive 8 visits per month (twice weekly), Gold accounts 4 (weekly), Silver 2 (fortnightly), and Bronze 1 (monthly). Capacity freed from reducing over-service of Bronze accounts is reallocated to coverage gap closure in higher-tier segments. The allocation is reviewed quarterly using Sales Force Automation (SFA) data comparing actual visit frequency against the standard for each outlet.
The tension looks different depending on where a market sits in its growth cycle:
During new market entry or distribution gap recovery, coverage is the priority. If the brand is present in 40% of the available universe, the biggest incremental opportunity is in the 60% that isn't stocked. A rep making eight visits to a Gold account per month when that account is already compliant on the must-sell list (MSL) is generating diminishing returns while leaving untapped outlets unserved. NielsenIQ's analysis of FMCG distribution strategy in emerging markets found that brands with strong headline distribution figures often had significant coverage gaps in specific regions or outlet tiers, with one manufacturer showing 85% national coverage but only 33% in one key region.
During execution improvement phases, frequency on high-value accounts earns more. When distribution numbers are solid but in-store conditions are inconsistent, compliance scores vary, and promotion execution is patchy, adding visit frequency to the outlets that matter drives more revenue than spreading thin across the full universe.
Most markets don't sit cleanly at one pole or the other. A commercial director managing a 15-rep field force in a mid-tier city might have solid Gold coverage but a genuine gap in the Silver tier and near-zero penetration in the wet-market channel. The right answer is a tiered allocation: protect and serve the high-value accounts at the right frequency, then direct surplus capacity toward gap closure.
Volume-Frequency Curves and Diminishing Returns
Not all visits generate equal return. The relationship between visit frequency and outlet revenue follows a curve, not a straight line, and the shape of that curve depends on the outlet's tier.
For a Diamond outlet (high-volume modern trade or flagship traditional trade account), the first weekly visit typically delivers a step-change in compliance and order value. The second weekly visit maintains what the first established. A third visit per week starts to generate noise: the rep is there more often than the outlet has purchasing cycles or stock gaps to fill, and marginal visit value drops sharply.
For a Bronze outlet (low-volume, low-storage, single-owner kiosk), the curve is even steeper. The first monthly visit converts a non-buyer or establishes the minimum assortment. A second monthly visit rarely changes the order profile because the outlet's throughput doesn't generate enough sell-out to justify restocking between visits.
The practical implication is that frequency standards shouldn't be uniform. They should follow the outlet tier's diminishing-returns profile:
Volume-Frequency Curve by Outlet Tier (Illustrative decision inputs, not industry averages. Ranges reflect directional diminishing-returns patterns; actual lift varies by category, market, and baseline execution quality.)
| Outlet Tier | Visit #1 Revenue Lift | Visit #2 Revenue Lift | Visit #3+ |
|---|---|---|---|
| Diamond | High (15-25%) | Moderate (5-10%) | Diminishing (<3%) |
| Gold | Moderate (8-15%) | Moderate (4-8%) | Low (1-4%) |
| Silver | Moderate (5-10%) | Low (2-5%) | Minimal |
| Bronze | Low (2-5%) | Very low (<2%) | Near zero |
The column that matters is the one that tells a commercial director where the next incremental visit will generate meaningful return versus where it's consuming capacity without output. Use these ranges as a starting framework, then validate against your own SFA data.
Frequency Standards by Outlet Tier
Most FMCG commercial teams establish call cycles by tier and then drift away from them under the pressure of routing convenience and relationship habit. Setting the standards explicitly, and measuring actual visit frequency against them, is how you find the drift.
Recommended Call Frequency Standards
| Outlet Tier | Recommended Frequency | Visits per Month | Rationale |
|---|---|---|---|
| Diamond | Twice weekly | 8 | High volume, complex execution, frequent promotional windows |
| Gold | Weekly | 4 | Material volume, execution compliance critical but lower complexity |
| Silver | Fortnightly | 2 | Moderate volume, order cycle typically fortnightly to monthly |
| Bronze | Monthly | 1 | Low volume, relationship maintenance and basic assortment check |
| Unvisited/New | Campaign-based | Quarterly minimum | Coverage gap closure; priority during new-launch periods |
These standards should feed directly into beat and journey planning so that route design reflects tier-appropriate frequencies, not whatever the rep found comfortable in the previous quarter.
The standards also need to account for outlet segmentation and classification. An outlet classified as Gold by purchase volume might be temporarily elevated during a seasonal window (Eid, Lunar New Year, Christmas), warranting a temporary frequency increase. The tier is the baseline; the operating context adjusts it.
Coverage Gap Analysis
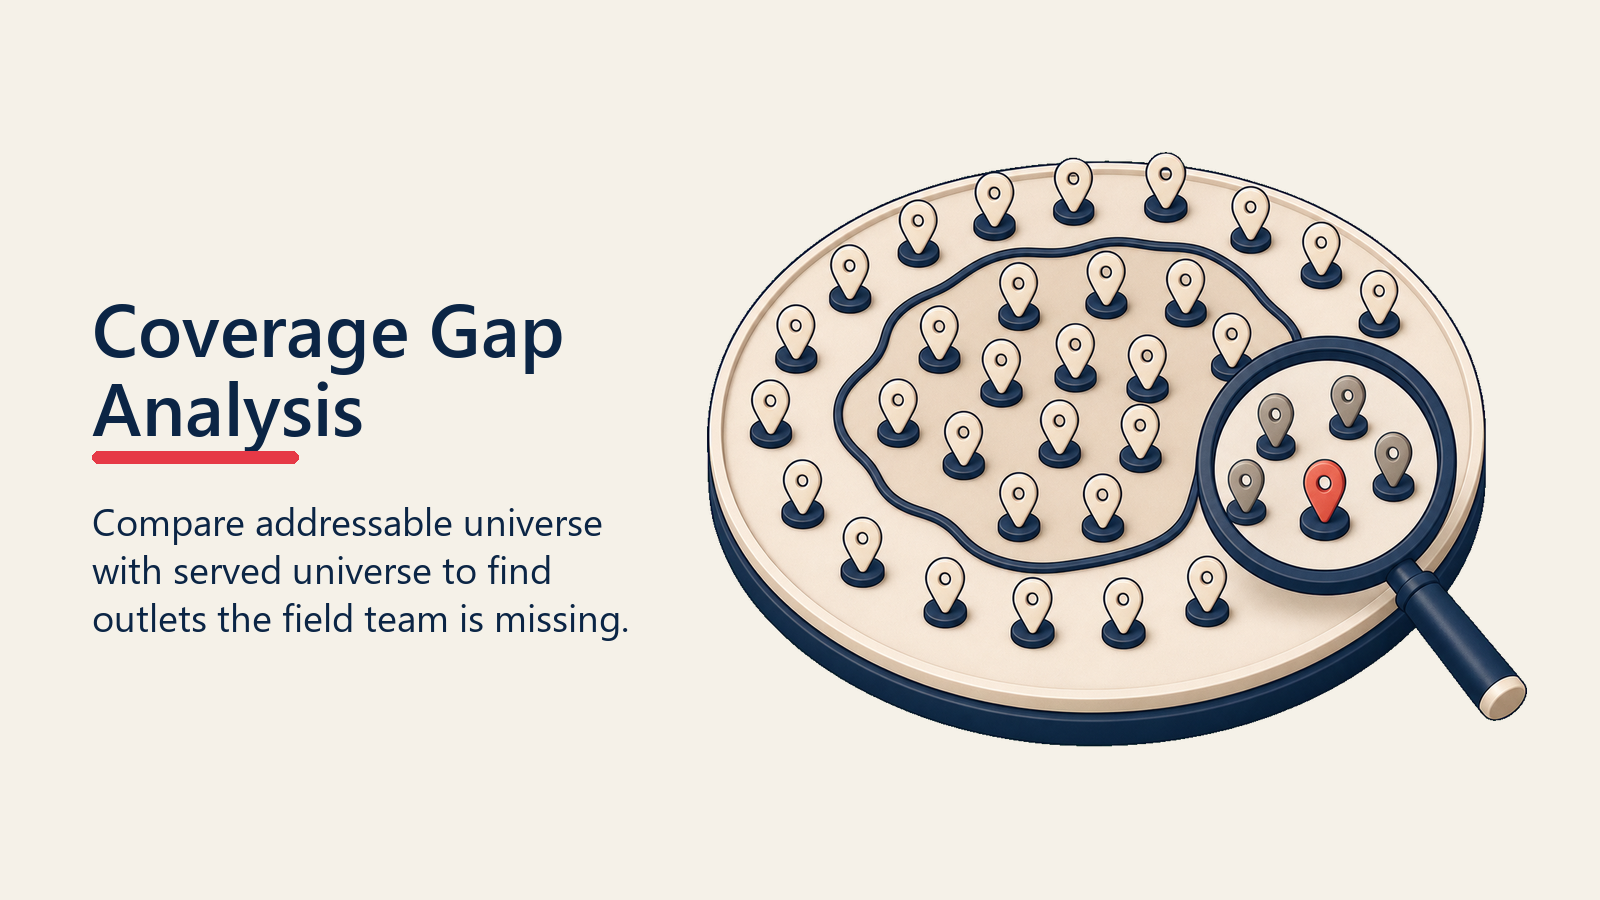
A coverage gap is an outlet in your universe that your field team isn't reaching at the prescribed frequency or at all. Coverage gaps are invisible in sales data because the outlet isn't ordering. The only way to find them is to measure the gap between the addressable universe and the served universe.
Coverage Gap Analysis Template
| Metric | How to Measure | Benchmark |
|---|---|---|
| Universe size by tier | Total outlets by tier from market mapping | Establish once, update annually |
| Active accounts | Outlets with at least one visit in last 90 days | Should be 100% of Diamond + Gold |
| Visited at correct frequency | Outlets meeting tier frequency standard in last month | Target 90%+ for Diamond, 85%+ for Gold |
| Lapsed accounts | No visit in 60+ days for Silver/Gold | Should be under 5% of active accounts |
| Never-visited | Outlets in universe with no order history | Quantify revenue at risk using average order value by tier |
The revenue-at-risk number from never-visited outlets is where this analysis gets commercially useful. If a team has 200 unvisited Silver outlets and the average Silver account generates $180 per month in orders, the monthly revenue at risk is $36,000. That number gives a commercial director the business case for a specific coverage drive with a measurable return target. NielsenIQ's distribution optimization framework notes that weighted distribution accounts for the category volume flowing through each outlet, not just outlet count. A cluster of unvisited outlets in a high-throughput market area may represent a multiple of the risk their count alone suggests.
Tracking numeric and weighted distribution alongside coverage data makes the picture complete: you can see not just how many outlets are unvisited, but what share of the category's volume potential those outlets represent.
When Should You Shift Field Capacity Toward Coverage vs Frequency?
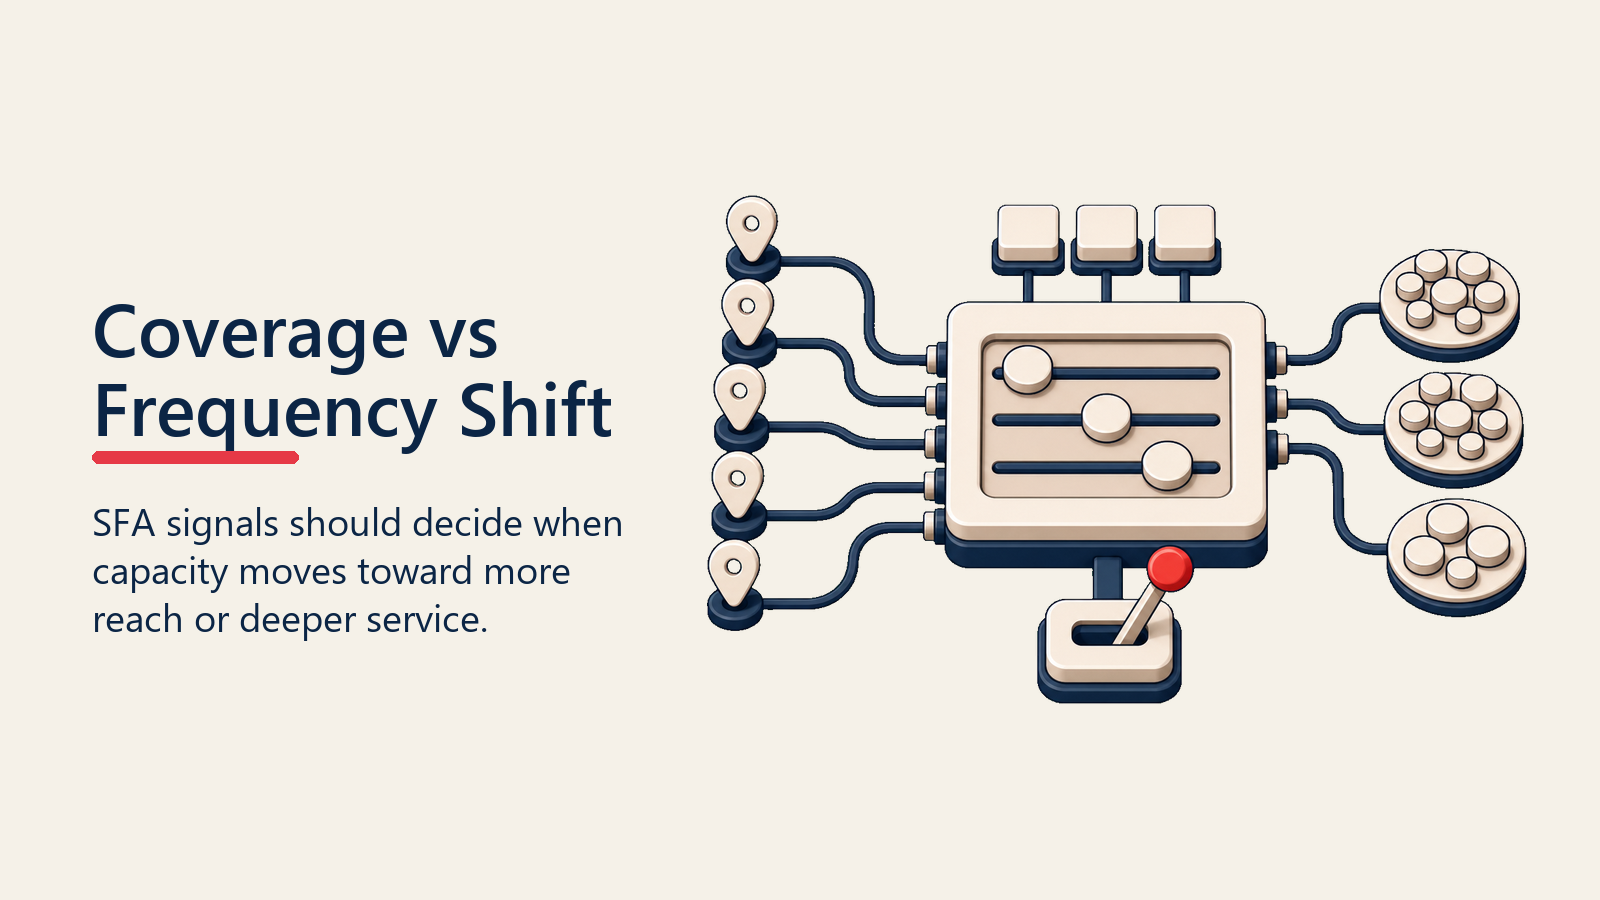
Coverage and frequency optimization isn't a set-and-forget exercise. The balance shifts with market conditions, and the signals that trigger a shift come from SFA data if you're reading it regularly.
Shift toward coverage when:
- A gap analysis reveals unvisited outlets in a tier with material revenue potential
- A new product launch requires rapid numeric distribution building
- Competitor gains in unserved channels show up in audit data
- The team has recently achieved high frequency compliance and has capacity to expand
Shift toward frequency when:
- Perfect store compliance scores are consistently below target at visited accounts
- Promotion activation rates are low despite accounts being listed on the promotional scheme
- Sales velocity at existing accounts is below category benchmarks, suggesting in-store execution issues
- A new must-sell SKU needs to reach 80% of Diamond and Gold accounts within a defined window
The signal to act is never gut feel. It's the SFA log showing where reps actually spent their visits versus where the tier-frequency standard said they should. That gap is the data.
FMCG sales KPIs and metrics should include coverage and frequency compliance as standing dashboard items, not periodic audit findings. When those metrics appear on the weekly sales review alongside volume and revenue numbers, the field team starts managing to them.
Using SFA Data to Drive Decisions
SFA data is where coverage and frequency optimization either stays theoretical or becomes operational. Most FMCG companies have SFA systems that log visit data. Few use that data to systematically identify over-served and under-served accounts.
The analysis that matters is simple: compare the actual visit count per outlet against the frequency standard for that outlet's tier. The result puts every outlet in your active account base into one of three buckets:
Over-served: Visited more often than the tier standard. These are typically accounts where the rep has a strong personal relationship, the outlet is convenient to reach, or it's a high-volume account the rep feels comfortable with. Over-serving here consumes capacity that could be directed at coverage gaps. It's not always wrong (a Diamond account with a complex promotional program might legitimately need extra visits), but it should be deliberate, not default.
Correctly served: Visited at the frequency the tier standard prescribes. These accounts are being managed efficiently. The question is whether the visit quality is delivering the expected commercial output, which requires linking frequency data to compliance scores and order trends at the account level.
Under-served: Visited less often than the tier standard. This is where coverage and execution gaps live. Under-served Gold accounts are the highest commercial priority: they have volume potential, they're in the active account base, and they're getting fewer visits than the standard requires.
Sales capacity planning connects to this directly. If the SFA data consistently shows under-service across a tier, the problem might not be rep routing choices. It might be that the headcount can't service the current universe at the prescribed frequencies, and the choice is between reducing the universe to fit capacity or adding headcount to close the gap.
Seasonal Adjustments to Coverage and Frequency
Seasonal peaks compress the window in which coverage and frequency decisions matter most. Before a major promotion window, every outlet that's going to participate needs to be visited with enough lead time to place stock and execute the in-store conditions. After the window closes, the priority shifts back toward coverage and reset.
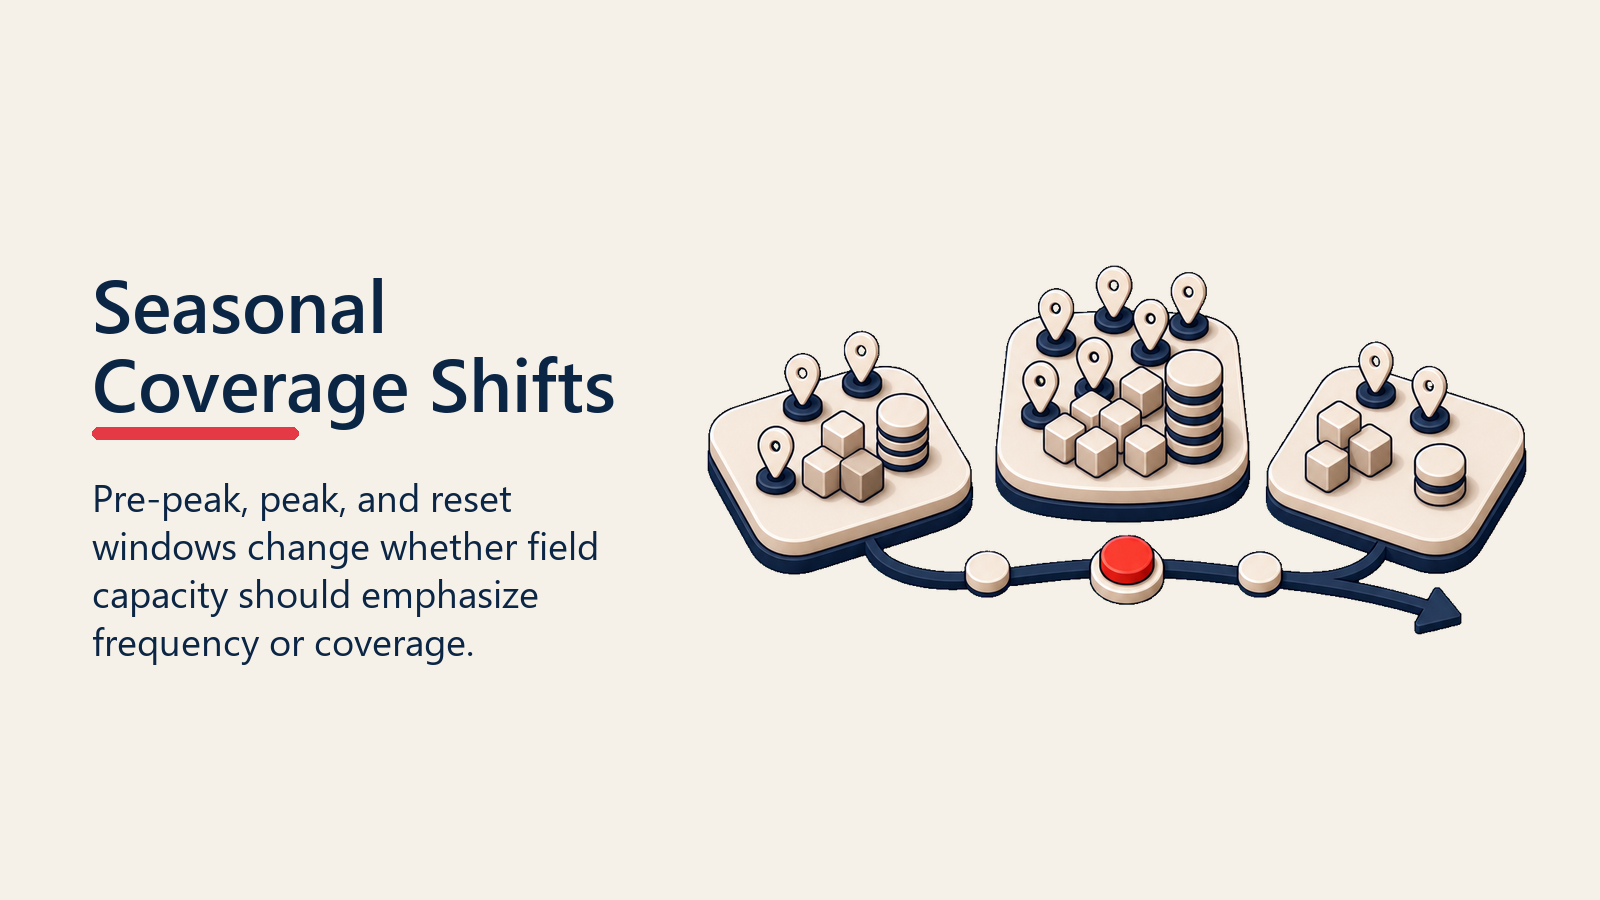
A practical seasonal adjustment framework works in three phases:
Pre-peak (4-6 weeks before): Frequency on Diamond and Gold accounts increases to lock in promotional participation, confirm stock orders, and audit in-store readiness. Coverage drives on unvisited outlets are paused or deprioritized unless a specific outlet is being recruited for the promotional program.
Peak execution (during promotional period): Frequency on all active accounts maintains at least the standard tier cadence. SFA monitoring tightens. Coverage gap visits are minimal because every call should be driving promotional compliance at accounts already in the system.
Post-peak reset (2-4 weeks after): Frequency normalizes back to tier standards. Coverage gap analysis runs on the full universe to identify accounts that should be recruited into the next window. The pharmaceutical field sales parallel is instructive here: pharma field teams run the same pre-peak, peak, and reset cadence around formulary listing windows and product launch events, and the structural discipline translates directly to FMCG promotion cycles.
The Quarterly Review Cadence
Coverage and frequency optimization is a discipline, not a project. The balance between coverage and frequency should be reviewed quarterly at minimum, with monthly SFA data reviews in between to catch drift before it compounds.
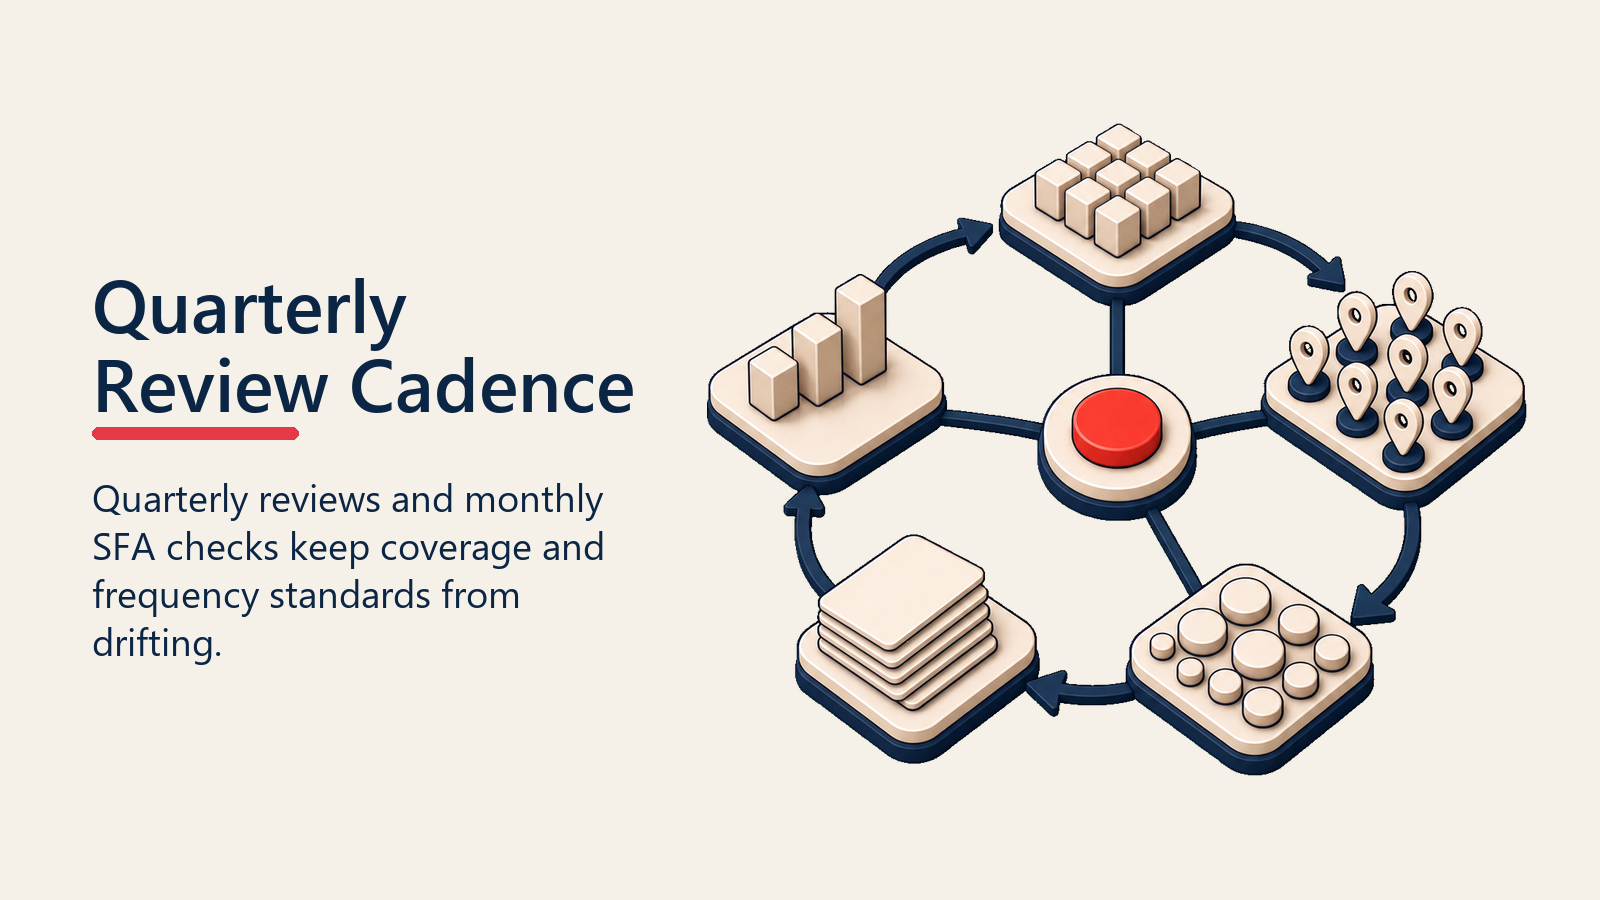
A quarterly review covers:
- Actual visit frequency per outlet tier versus the standard (SFA data)
- Coverage gap measurement: how many unvisited outlets exist in the universe, by tier
- Revenue-at-risk quantification from lapsed and never-visited accounts
- Over-service identification: which accounts are being visited more than the tier standard and whether that's justified
- Reallocation plan: which reps adjust routing to close gaps, and which accounts get frequency increases or decreases for the next quarter
The output of that review feeds directly into beat and journey planning for the next period. Routes change. Tier assignments update as outlets grow or shrink. New outlets enter the universe. Without a quarterly reset, the field team ends up serving an increasingly inaccurate version of the market.
Conclusion: Optimization Is an Ongoing Discipline
Coverage and frequency optimization isn't a one-time beat design exercise. It's the quarterly discipline of measuring where field capacity is going, comparing it to where commercial value says it should go, and making the adjustments that close that gap.
The math is available in every SFA system. The standards are straightforward to set by tier. The analysis template is a spreadsheet exercise, not a consulting project. What it requires is commercial leadership that treats field capacity as a finite resource to be allocated deliberately, not a fixed cost to be tolerated passively.
Get the frequency standards right by tier. Measure actual visits against them every month. Run the coverage gap analysis quarterly. Shift capacity toward coverage or frequency based on what the data shows, not what felt right last quarter. That discipline, applied consistently, is how distribution gains compound into market share.
Frequently Asked Questions about Coverage and Frequency Optimization
How often should outlet visit frequency standards be reviewed?
Frequency standards should be reviewed quarterly alongside the beat and journey planning cycle. The underlying tier classifications might not change, but the universe size shifts as outlets open and close, outlet performance moves accounts between tiers, and seasonal patterns affect when certain outlets need more attention. An annual standard that isn't reviewed against actual SFA performance data will drift out of alignment within two quarters.
What's the fastest way to find coverage gaps in the field?
Pull the active account list from your SFA and compare it against your current outlet universe. Any outlet in the universe with no visit in the past 90 days is a lapsed or never-visited account. Sorting by outlet tier immediately shows which gaps carry the most revenue risk. Diamond or Gold accounts with no visit in 90 days are a commercial emergency; Bronze accounts with no visit in 90 days might simply reflect correct deprioritization.
How do you stop reps from over-serving convenient accounts?
Visibility. When the SFA dashboard shows a rep's actual visit distribution versus the tier-frequency standard, over-concentration on convenient accounts becomes visible in the data rather than hidden in the call log. Pair that dashboard with a coaching conversation that asks the rep to justify high-frequency visits against actual commercial output at those accounts, and the behavior shifts. Incentive design also helps: if rep KPIs include coverage metrics (percentage of tier accounts visited at standard frequency) alongside volume numbers, convenience-routing carries a score penalty.
What's the right way to handle a temporary outlet tier upgrade during a seasonal peak?
Upgrade the tier classification in the SFA for the duration of the promotional period, document the justification, and set a review date. Don't leave temporary upgrades in place indefinitely or they become the new baseline without any assessment of whether the outlet's volume profile actually shifted. A well-managed tier system has an audit process that checks whether temporary changes were reversed or formalized based on post-peak performance data.
What is the difference between coverage rate and frequency compliance?
Coverage rate is the percentage of outlets in your addressable universe that have received at least one visit within a defined period (typically 90 days). Frequency compliance is the percentage of active accounts that are being visited at the cadence prescribed for their tier. Both matter and neither substitutes for the other. A team can have high coverage (most outlets visited at least once) and low frequency compliance (Gold accounts receiving one visit per month instead of two). The distribution data looks healthy; the execution is not. Measuring both separately is what surfaces the distinction.
How do you calculate revenue at risk from unvisited outlets?
Identify all outlets in the universe with no visit in 90 days, segment them by tier, and multiply the count in each tier by the average monthly order value for that tier. The result is the potential monthly revenue lost to zero-coverage accounts. This figure gives the commercial director a business case for a specific coverage drive with a measurable return target. It also converts a coverage gap from an operational metric into a financial one, which is the language that unlocks resource from commercial leadership.
Learn More

Senior Implementation Consultant
On this page
- The Coverage vs Frequency Trade-Off
- Volume-Frequency Curves and Diminishing Returns
- Frequency Standards by Outlet Tier
- Coverage Gap Analysis
- When Should You Shift Field Capacity Toward Coverage vs Frequency?
- Using SFA Data to Drive Decisions
- Seasonal Adjustments to Coverage and Frequency
- The Quarterly Review Cadence
- Conclusion: Optimization Is an Ongoing Discipline
- Learn More