Distributor Management and ROI: How FMCG Leaders Turn Partners into Growth Engines
Turn this article into takeaways for your work.


Each assistant summarizes the article only for you and suggests best practices for your work.
Your biggest channel partner is often your biggest blind spot.
FMCG companies routinely spend an estimated 12-18% of net revenue on distributor margins, incentive schemes, and trade terms, a widely used planning benchmark in commercial management, though the actual figure varies significantly by market, channel structure, and product category. That makes the distribution channel one of the largest cost lines in the commercial P&L. But ask most sales directors to quantify the return on that investment and they'll give you primary sales volumes. Not coverage gain. Not outlet penetration rates. Not cost-per-case delivered. Not the comparison between what the distributor model costs versus what a direct delivery alternative would cost in the same territory.
The distributor paradox is this: the more dependent your route-to-market is on third-party partners, the less visibility you have into whether those partners are actually earning their commercial terms. You see the revenue that flows through them. You don't see the revenue that doesn't flow through them because they're understocking, under-servicing, or quietly prioritizing the brand next to yours in their portfolio.
Fixing this requires treating distributor management as a revenue discipline, not a logistics function. That means selection rigor, contracting that builds in accountability, ROI measurement at the territory level, and a performance review cadence that catches problems before they become irreversible.
Distributor vs Direct Delivery vs Sub-Stockist
Before managing distributors, you need to be clear on when the distributor model earns its cost. Three commercial models cover most FMCG route-to-market configurations, and each has conditions under which it's the right choice.
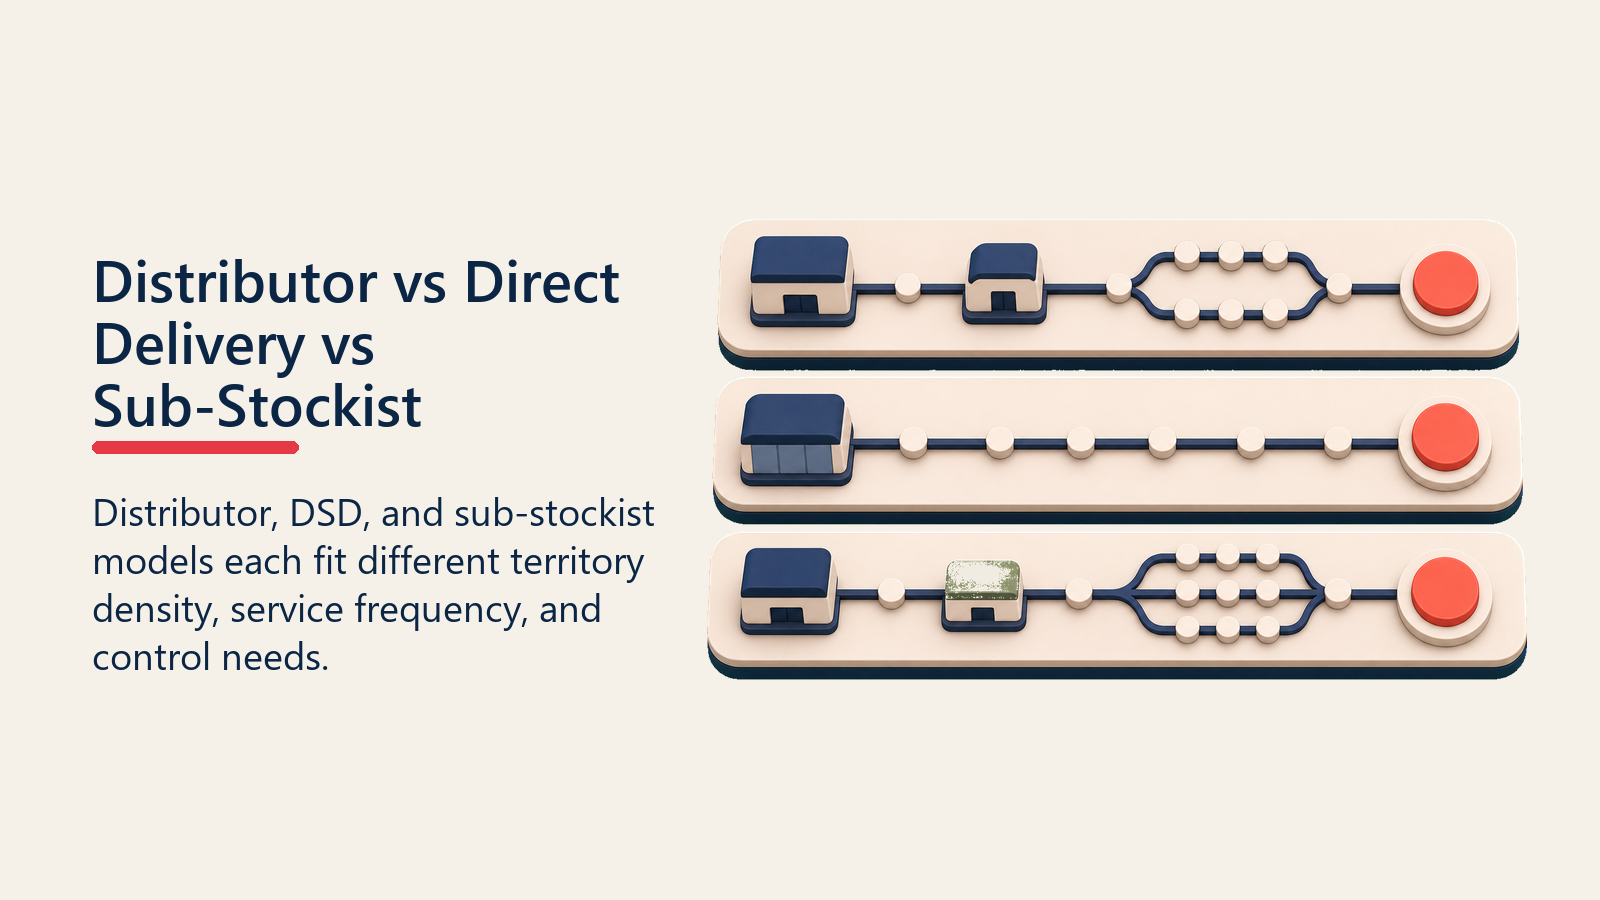
Primary distributors make sense when territory geography is broad (multiple districts or a large urban area), the outlet universe is fragmented (hundreds of small general-trade shops that can't be serviced economically by a direct fleet), and the required service frequency is 1-2 visits per outlet per week. The distributor absorbs the working capital burden of holding stock, manages their own van sales team, and takes credit risk on downstream customers. In exchange, they earn a margin that must be justified by the coverage and service frequency they actually deliver.
Direct store delivery (DSD) makes sense when your volume per outlet is high enough to justify a manufacturer-controlled van calling directly, when maintaining perfect in-store execution (planogram compliance, secondary display, promotional activation) is a brand-critical requirement that third parties can't reliably execute, or when the outlet universe is concentrated enough that a direct fleet is cost-competitive with a distributor margin. See Direct Store Delivery DSD for the full economics comparison.
Sub-stockists make sense for the last-mile problem: small-town or peri-urban outlets that a primary distributor's van routes don't reach economically. A sub-stockist holds stock transferred from the primary distributor and services a narrow catchment. They earn thinner margins, bear less risk, and provide reach that the primary distributor model alone can't generate cost-effectively. See Rural Distribution and Sub-Stockist Models for the management framework specific to this channel tier.
The decision between these models is a commercial calculation, not a default. Run the numbers by territory before committing to a configuration. Bain's emerging-market channel research confirms that successful FMCG companies need distinct execution models for traditional and modern trade simultaneously, and that treating one as a default route damages performance in both.
Key Facts: Distributor Management and ROI
- Distributors and intermediaries collectively capture an estimated 15-20% of total FMCG value-chain margin, making distribution one of the largest cost lines in the commercial P&L. This range reflects a common practitioner estimate; the actual figure varies by channel structure, market, and product category. Companies that track cost-per-case delivered alongside volume can identify territory-level distribution inefficiencies that aggregate revenue dashboards never surface.
- NielsenIQ analysis (2023) found that closing outlet coverage gaps in underpenetrated distributor territories can unlock more than 50% of incremental category sales sitting in stores the manufacturer is absent from, with one case demonstrating a 10% incremental market share gain from addressing a single regional distribution gap.
- FMCG companies using manual distribution tracking report 20-25% higher inventory costs than those using digital systems with structured secondary-sales data, according to McKinsey CPG channel research, a gap that distributor performance management directly narrows.
What Should the Distributor Selection Scorecard Include?
Selecting a distributor is one of the highest-impact decisions a sales director makes in a given territory. The wrong distributor costs you 6-12 months of market access and, once relationships are established, is politically and commercially difficult to replace. The right one becomes a genuine commercial extension of your field force.
Evaluate distributor candidates across six dimensions before making an appointment.
Geographic reach (actual, not claimed). Distributors routinely overstate coverage, especially in rural and peri-urban areas. Ask for a route list with outlet counts. Visit a sample of 15-20 outlets in different parts of the territory to verify that the distributor's van sales team actually calls on them and at what frequency. Coverage that exists only on paper is coverage that doesn't move product.
Financial health. A distributor who can't fund adequate stock levels will stockout during demand peaks, miss orders during their own cash-flow squeeze, and accumulate overdue accounts that eventually force you to put them on supply hold. Ask for working capital indicators relative to the stock value you expect them to hold. A distributor who is already extended across multiple principals and carrying significant debt is a stockout risk, not a growth partner.
Van sales team quality. In most FMCG markets, the distributor's van salesperson is the most frequent commercial contact your brand has with a general-trade outlet. How many do they have? What's their daily call frequency? Do they use handheld order management devices or paper records? A distributor with 8 van salespeople covering 2,000 outlets is operating at a call frequency that won't sustain shelf share. A distributor with 15 people, mobile order capture, and a daily call report is a genuine execution partner.
Warehousing and cold-chain. For ambient products, warehouse capacity and hygiene are the minimum requirements. For chilled, frozen, or temperature-sensitive products, cold-chain infrastructure is a non-negotiable qualification criterion. Inspect the facility, verify temperature monitoring systems, and check how they handle power outages during storage.
Existing portfolio conflicts. A distributor who already holds a directly competing brand has an inherent incentive conflict. They may still be an excellent partner with explicit commitment agreements in place, but you need to understand the conflict and negotiate share-of-voice commitments before appointment, not after you've discovered that your brand's secondary display space is consistently occupied by the competitor.
Reputation with outlets. Call 10-15 shop owners in the territory and ask them which distributors they prefer to buy from and why. Their answers reveal service reliability, payment flexibility, and commercial relationships that no due diligence document will show you.
Once you've selected the right partner, the contract is where you build in accountability.
Distributor Selection Scorecard
| Criterion | Weight | Evaluation Method | Minimum Threshold |
|---|---|---|---|
| Geographic coverage | 25% | Route list audit + outlet sample check | >80% of target outlets on active routes |
| Financial health | 20% | Working capital review, payment history | Positive working capital, no current supply holds |
| Van sales team size and frequency | 20% | Headcount, daily calls, order-capture method | Min 1 call per outlet per week for A-class outlets |
| Warehousing and cold-chain (if relevant) | 15% | Facility inspection, temperature monitoring | Pass inspection; logged temperature data available |
| Portfolio conflict exposure | 10% | Brands carried, willingness to commit share of voice | No direct competitor without explicit SOV commitment |
| Outlet reputation | 10% | Reference calls with 10-15 outlets in territory | Positive references from majority of outlets sampled |
Contracting Essentials
A signed distribution agreement is where most FMCG companies stop. But the contracting process is actually where you build the operational foundation of a commercial partnership. Four clauses matter most.
Volume targets with territory coverage requirements. The agreement should specify primary-sales volume targets by quarter, tied to the commercial terms the distributor earns. But volume targets alone reward the wrong behavior: a distributor who hits primary-sales targets by stacking stock in their own warehouse has not earned their incentive. Tie incentive eligibility to secondary-sales performance data and minimum outlet coverage metrics. See Secondary Sales and Stock Visibility for the data layer required to make this work.
Exclusivity terms with conditions for review. Territory exclusivity protects a distributor's commercial investment in building coverage and outlet relationships. But unconditional exclusivity protects a poorly performing distributor equally well. Structure exclusivity with performance conditions: the distributor holds the territory exclusively while achieving a defined minimum coverage and fill-rate standard. Fall below that standard for two consecutive quarters and exclusivity is subject to review.
Stock rotation obligations and near-expiry policy. The contract must specify minimum stock cover floors (typically 21-28 days based on average daily offtake), maximum stock ceilings (45-60 days to limit expiry risk), and who bears the cost of near-expiry product. A common structure allows the manufacturer to accept returns of product returned within 60 days of expiry, provided storage conditions are documented. Without a written near-expiry policy, disputes accumulate and trust erodes.
Secondary-sales reporting. This is the most commonly under-specified clause in FMCG distributor agreements. Define the reporting format, frequency, submission deadline, and the tool or template. Link incentive payments to reporting compliance. A distributor who doesn't submit secondary-sales data on time is a distributor whose performance you can't measure. Tie late or missing reports to a defined financial consequence.
With the contract in place, the next question is what ROI actually looks like across the five metrics that matter.
How Do You Measure Distributor ROI in FMCG?
The return on your distributor investment has five components. Track all five, not just primary sales volume.

Primary sales offtake. What moves from your warehouse or national distribution center into the distributor's warehouse. This is the baseline metric, but it's a lagging indicator of market performance and a measure of distributor stocking behavior, not consumer demand.
Secondary sales offtake. What moves from the distributor's warehouse to outlets. This is the actual demand signal. The gap between primary and secondary sales tells you whether the distributor is building inventory or depleting it. Consistent growth in secondary sales that isn't matched by primary sales growth tells you the distributor is running inventory down, which is a risk signal. Consistent growth in primary sales without matching secondary sales growth tells you stock is accumulating, which is an expiry risk.
Outlet coverage gain. Numeric distribution: what percentage of the targeted outlet universe in the territory is actively stocked with your brand? Month-on-month coverage gain measures whether the distributor is expanding reach or just servicing existing accounts. A distributor who is generating primary-sales growth through higher order volumes at existing outlets but isn't adding new outlets to coverage is not growing the business; they're deepening in accounts that may already be saturated. See Numeric and Weighted Distribution for the full measurement framework. NielsenIQ research on FMCG distribution shows that closing outlet coverage gaps can unlock over 50% incremental sales growth in underpenetrated territories.
Fill rate at outlet level. What percentage of outlet orders are fulfilled in full? Fill rate below 90% indicates either inadequate stock levels at the distributor, operational problems with van routing and order processing, or systematic stockouts on specific SKUs. A distributor who consistently mis-fills orders is eroding outlet loyalty to your brand.
Cost-per-case delivered. Total distributor cost (margin, incentives, trade terms, co-investment) divided by total secondary-sales cases delivered to outlets. This puts the distribution investment in its proper commercial context. A distributor who costs 15% of revenue to deliver 10,000 cases per month is costing you more per case than a distributor who costs 12% to deliver 8,000 cases per month (if their coverage and fill rate are equivalent). Compare cost-per-case across territories and distribution models to identify where the investment is earning its return and where it isn't.
ROI Calculation Example
| Metric | Territory A | Territory B |
|---|---|---|
| Monthly primary sales (cases) | 12,000 | 10,000 |
| Monthly secondary sales (cases) | 11,200 | 8,400 |
| Primary-to-secondary gap | 6.7% | 16% |
| Outlet coverage (numeric distribution %) | 78% | 65% |
| Fill rate | 94% | 87% |
| Distributor cost (% of net revenue) | 13% | 15% |
| Cost per case delivered | Baseline | 24% higher |
Territory B needs a conversation. Higher cost, lower secondary sales, wider primary-to-secondary gap, lower coverage, and lower fill rate. Before that conversation turns into a contract review, the commercial team needs to understand whether the underperformance is a distributor capability issue, a territory demand issue, or a target-setting problem. That diagnosis happens in the performance review cadence.
Performance Review Cadence
Monthly scorecard. Review the five ROI metrics above with the distributor's senior commercial contact (not just the order desk). Make the scorecard available to the distributor before the meeting so they arrive prepared to discuss trends, not just receive findings. The review should be 45 minutes: 15 minutes on performance data, 20 minutes on commercial priorities for the coming month (upcoming promotions, new SKU launches, outlet coverage campaigns), and 10 minutes on operational issues (delivery problems, credit queries, near-expiry claims).
Quarterly business review (QBR) agenda. The QBR is a strategic conversation, not a monthly scorecard with extra slides. Structure it around four questions:
- How did we perform this quarter against the commercial plan? (Data review: all five ROI metrics, plus trend analysis)
- What did the market tell us that changes our approach for next quarter? (Field intelligence synthesis, competitor moves, outlet feedback)
- What are the commercial priorities for next quarter and how does the distributor's operation need to support them? (Promotional calendar, coverage expansion targets, new SKU launches)
- What investments or support does the distributor need from us to deliver the plan? (Stock financing, co-investment in van sales headcount, training, marketing materials)
QBR attendance should include the distributor owner or general manager plus their commercial lead, and your regional sales manager plus your national distribution manager. The QBR is where the commercial relationship gets calibrated. It shouldn't be delegated to a territory rep on either side.
Annual contract reset. Once per year, the distribution agreement should be reviewed against market conditions. Territory boundaries may need adjustment as the outlet universe evolves. Coverage targets may need revision as numeric distribution matures. Incentive structures may need updating as competitive dynamics change. The annual reset is also where the exclusivity conditions get reviewed. A distributor who has consistently met performance thresholds earns confidence in their exclusivity for the coming year. One who has consistently missed targets needs a conversation about whether the model is right for the territory.
Corrective Action and Exits
Warning thresholds. Define the performance level that triggers a formal performance improvement conversation, separate from the monthly scorecard review. Commonly used thresholds: secondary-sales fill rate below 85% for two consecutive months; numeric distribution declining for two consecutive months; secondary-sales reporting compliance below 80% for one month; primary-to-secondary gap exceeding 20% for three months.
Performance improvement plan. When a distributor hits a warning threshold, the performance improvement plan (PIP) should be specific, time-bound, and tied to defined consequences. It should cover: the specific metrics that are underperforming, the root cause agreed between both parties, the specific actions the distributor will take (additional van sales headcount, route optimization, stock level adjustment), the support your company will provide, the review timeline (typically 90 days), and the outcome if targets aren't met.
Transition playbook. Exiting a distributor relationship is commercially and operationally complex. Outlets that have been serviced exclusively by that distributor need to transition to a new partner without a supply gap. Develop a transition playbook before you need it: the notice period required under the contract, the outlet communication protocol, the stock transfer process (how existing distributor stock transitions to the new partner), and the timeline for full transition. A distributor exit without a playbook creates stockout windows that damage brand availability in the territory for months.
For pharmaceutical distributor management frameworks that apply parallel principles on selection, contracting, and performance review, see Distributor and Stockist Management and Sales and Distribution Trade Alignment.
The Five-Metric Distributor ROI Model
The model evaluates whether distributor investment is creating market access, not just moving primary sales into the channel.
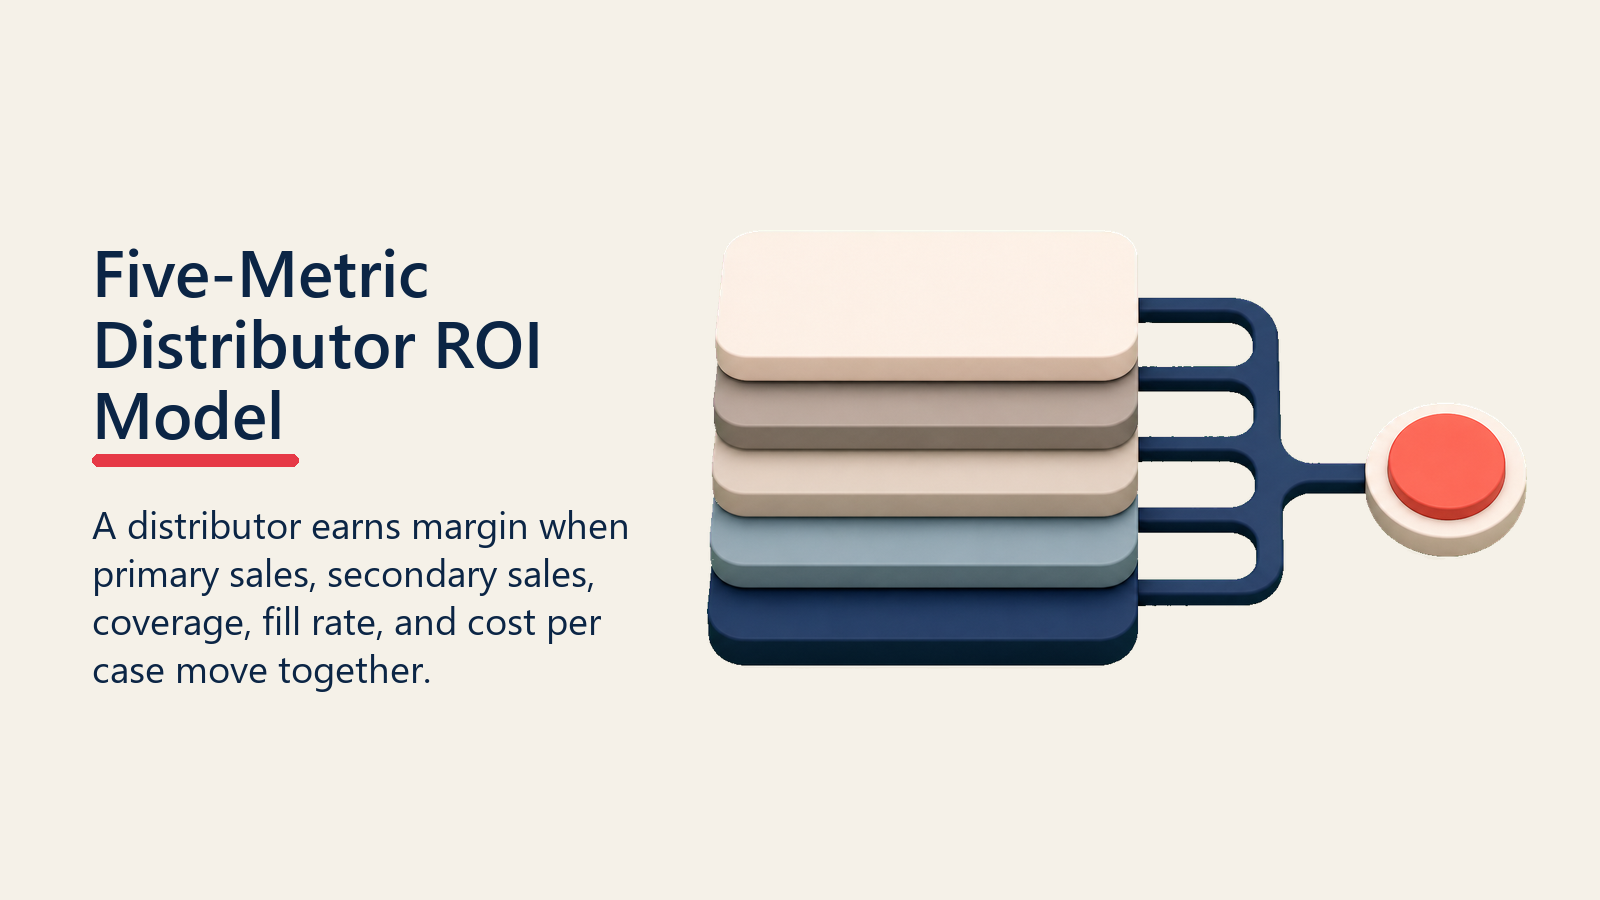
The Five-Metric Distributor ROI Model: Most FMCG organizations evaluate distributor performance on one metric: primary sales volume. This misses four of the five signals that determine whether distribution investment is earning its return. The full model tracks primary-sales offtake (distributor stocking behavior), secondary-sales offtake (actual market demand), outlet coverage gain (numeric distribution change month-on-month), fill rate at outlet level (execution quality), and cost-per-case delivered (investment efficiency). A distributor who scores well on primary sales but poorly on secondary-to-primary gap, fill rate, and coverage gain is earning margins without delivering the market access those margins are supposed to fund. The model only has diagnostic power when all five metrics are tracked simultaneously and reviewed at territory level, not just at national aggregate.
"The distributor paradox is this: the more dependent your route-to-market is on third-party partners, the less visibility you have into whether those partners are actually earning their commercial terms."
"A distributor exit without a playbook creates stockout windows that damage brand availability in the territory for months. The playbook has to be ready before you need it, not while the relationship is breaking down."
"The QBR is where the commercial relationship gets calibrated. A distributor who sits in a 45-minute monthly data review is a vendor. One who participates in a quarterly strategic conversation is a partner. The format you run shapes the relationship you get." (Based on distributor management frameworks published by Bain and NielsenIQ for emerging-market FMCG channel management, 2023.)
Conclusion
Distributors are a commercial investment, not a logistics cost. The margin and trade terms you pay them are a claim on the revenue they generate for your brand. Managing that investment means knowing what it's producing: secondary sales offtake, outlet coverage gain, fill rate, and cost-per-case delivered. Not just the primary-sales volume that flows through their warehouse.
The commercial leaders who build the selection rigor, contracting discipline, and performance review cadence described here don't just manage their distribution costs more effectively. They turn their best distributors into genuine commercial extensions of the field force: partners who understand the strategy, are motivated by the right incentives, and have the commercial capability to execute against the plan.
That's the distributor management ROI that justifies the investment. And it doesn't happen by accident.
Frequently Asked Questions about Distributor Management and ROI
How do you calculate distributor ROI in FMCG?
ROI on a distributor relationship has five components: primary-sales offtake (what they buy from you), secondary-sales offtake (what they sell to outlets), outlet coverage gain (numeric distribution change), fill rate at outlet level, and cost-per-case delivered. Total distributor cost as a percentage of net revenue, divided across these performance metrics, gives you a multi-dimensional ROI picture. A distributor costing 15% of revenue but delivering 95% fill rate and growing numeric distribution by 3 points per quarter is generating returns that justify that cost. One costing 14% with an 82% fill rate and flat coverage is not.
When should an FMCG company consider exiting a distributor?
Exit conversations are warranted when: fill rate stays below 85% after a 90-day performance improvement plan; secondary-sales reporting is consistently non-compliant despite contractual requirements; the distributor is actively promoting competing brands at the expense of your shelf share; working capital problems are causing systematic supply holds; or the territory's commercial potential requires a distributor with capabilities the current partner doesn't have and can't build. The decision to exit should be made before the relationship becomes so damaged that transition planning is rushed.
What is the right stock cover level to require from an FMCG distributor?
A commonly adopted contractual floor is 21 days of stock on hand (based on the distributor's average daily secondary-sales offtake), with a ceiling of 45-60 days to limit expiry risk. The floor prevents stockouts during normal demand periods. The ceiling prevents the distributor from tying up working capital in excess stock that then creates near-expiry risk. Calibrate these thresholds against your product's demand volatility, shelf life, and the distributor's logistics capability.
How often should quarterly business reviews happen?
QBRs should happen every 90 days with primary distributors, and twice per year with secondary or sub-distributor tier partners. The QBR cadence should be built into the distribution agreement as a contractual commitment, not an optional commercial courtesy. Distributors who know a QBR is coming with specific performance data prepare better. QBRs that are held irregularly tend to become complaints sessions rather than strategic planning conversations.
What is a fair distributor margin in FMCG?
The right distributor margin is the one that covers the distributor's operating costs (warehousing, van fleet, van salesperson headcount, fuel, credit risk on downstream customers) and leaves a net profit that makes the business worth running. In practice, FMCG distributor gross margins range from 4-8% of the selling price to outlets, with net margins typically landing at 1-4% after all operating costs. Distributors and intermediaries collectively capture an estimated 15-20% of total value-chain margin across primary and secondary transactions, a common practitioner planning range that varies by market and channel structure. If a distributor's margin is too thin to support adequate van headcount and outlet call frequency, you'll see underperformance in coverage and fill rate. Adjust margin structures before demanding performance improvements that the economics don't support.
How do you handle a distributor who is performing well commercially but has poor data compliance?
Treat data compliance as a commercial performance dimension, not a separate administrative issue. A distributor who refuses to submit secondary-sales data on time is a distributor whose performance you cannot measure, verify, or reward accurately. Link incentive payment eligibility to reporting compliance in the contract. When compliance drops below 75%, initiate a formal performance conversation under the same framework you'd use for fill rate underperformance. The most common reason for poor data compliance is that the distributor doesn't believe you'll act on it. Demonstrating that compliance drives incentive payments and that non-compliance has defined financial consequences changes the calculus.
When does it make sense to split a territory between two distributors?
Territory splitting makes sense when: the territory has grown large enough that a single distributor's van team can't maintain the required call frequency across all outlet tiers; the distributor is concentrating coverage in high-density urban parts of the territory and leaving rural and peri-urban areas underserved; or you need channel specialization, with one distributor focused on general trade and another on modern trade within the same geography. Split decisions should be based on coverage data and fill-rate analysis by geography within the territory, not on primary-sales shortfalls alone. A distributor who is missing targets in a specific district while hitting targets overall may need territory size reduction, not a full exit.
Learn More

Senior Implementation Consultant