Demand Planning and Field Alignment in FMCG: Using Ground-Level Data to Build Forecasts That Actually Hold
Turn this article into takeaways for your work.


Each assistant summarizes the article only for you and suggests best practices for your work.
A forecast built from primary sales data is a forecast of distributor stocking behavior, not consumer demand. That distinction matters more than most FMCG planning teams admit.
When you ship 10,000 cases to a distributor, that shipment shows up as revenue. But if 4,000 of those cases are still sitting in the distributor's warehouse three weeks later because a competitor ran an aggressive price promotion, your forecast was wrong. The market didn't take what you thought it would take. Your field rep probably knew by day three that the promotion was underperforming. The demand planner found out on day twenty-one when the distributor skipped their reorder.
That three-week gap is where FMCG companies lose money, accumulate slow-moving stock, and misread demand trends. Closing it requires a structural connection between the people who see the shelf every day and the people who build the numbers that determine production and inventory commitments.
This article explains how that connection works, what it needs to produce, and how you measure whether it's actually functioning.
Why Does the Gap Between Field and Planning Exist?
Field sales teams and demand planning teams don't just work in different offices. They work on fundamentally different clocks and draw from different data sources.
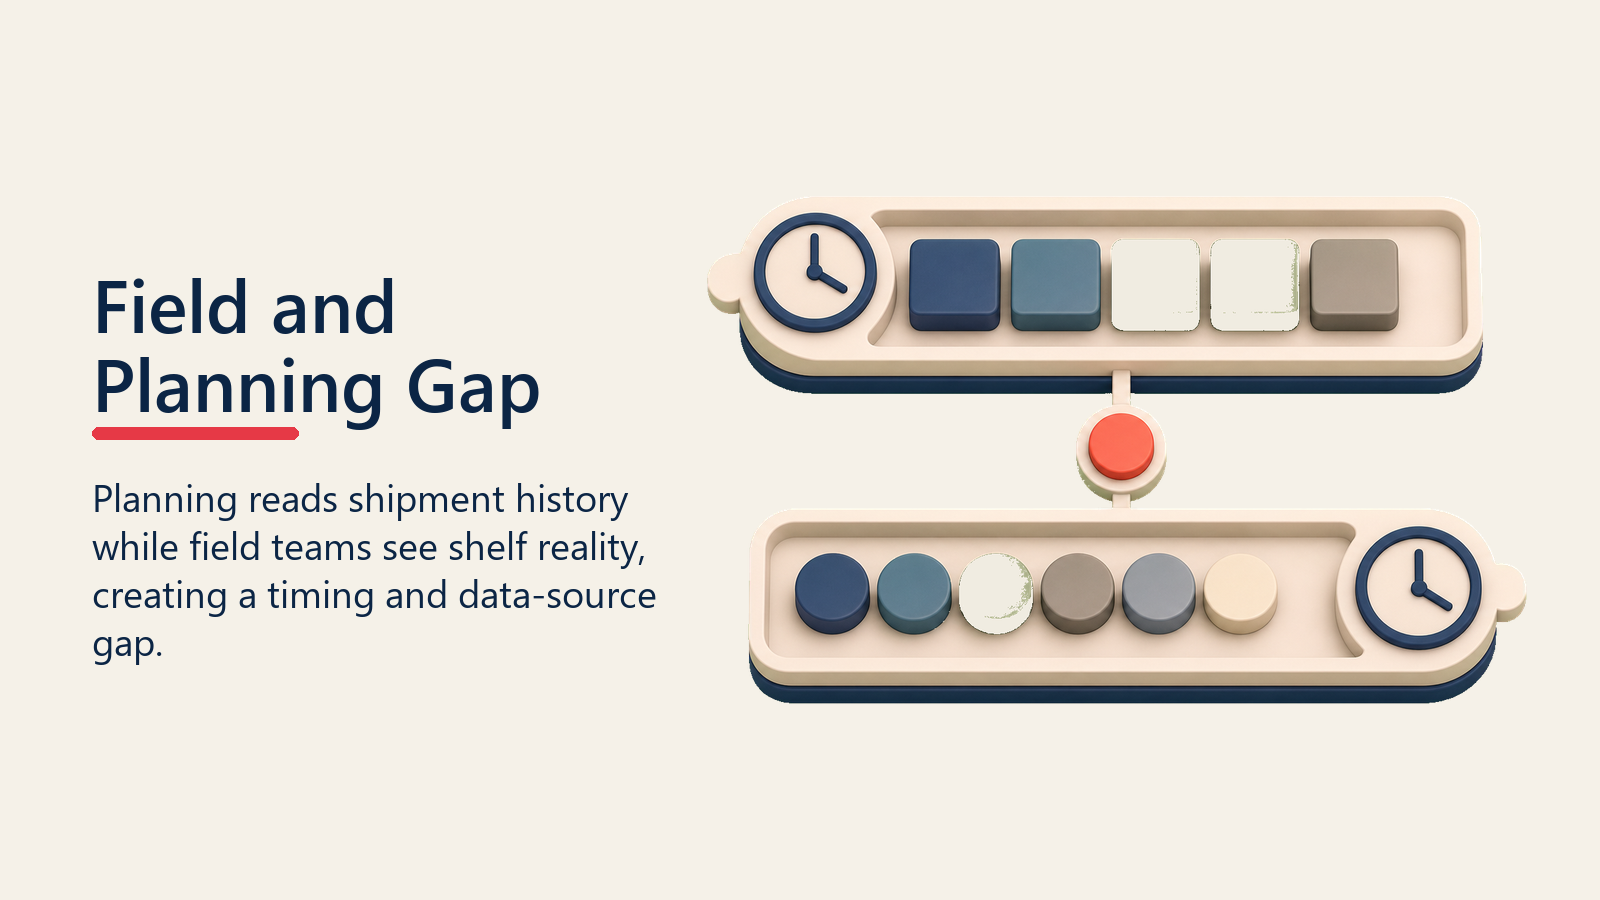
Demand planning works from the past. The primary inputs are shipment history, macro-category trends, planned promotional calendars, and statistical models. The sales and operations planning (S&OP) process is designed precisely to bring these inputs together with supply realities so that different parts of the business work from the same demand assumptions, but the process only works when field-level consumption signals feed into it reliably. These inputs are accurate as far as they go. They describe what happened, and they project based on patterns. But they can't see what's happening right now at the outlet level: which SKUs are stacking up, which shelves went empty three days after a promotion ended, or which new modern-trade format just opened on the edge of a distributor's territory and is pulling volume from the general-trade outlets the planner assumed would hold stable.
Field sales teams see the present. A distributor sales rep who visits 25 outlets a day sees sell-out velocity in real time. A territory manager who does a weekly trade check with key retailers knows exactly which SKUs are turning fast and which are accumulating dust. A field supervisor covering a regional hub gets the feedback from pharmacies and general-trade shops about whether a promotion actually drove basket size or just compressed margin.
But here's the problem: neither team has a structured channel to share what they know. Demand planning doesn't ask, field doesn't report, and the information dies in informal conversations and WhatsApp groups.
The result is a forecast that looks precise on a spreadsheet but is built on data that's weeks or months behind the market. So what specific observations actually help a planner, and which ones are noise?
Key Facts: Demand Planning and Field Alignment
- Traditional FMCG demand planning methods are commonly benchmarked at 25-40% MAPE at SKU level, a range documented by supply chain practitioners and vendors including Planster and EasyReplenish. AI-augmented approaches are reported to reduce forecast error materially, industry estimates suggest 8-15% MAPE is achievable, but the input quality gap from missing field data is the primary driver of error before any model improvement. Both figures reflect practitioner benchmarks rather than peer-reviewed measurement.
- Global retail out-of-stock rates averaged 6.5% of SKUs in 2023, down from 10.7% in 2022 but still representing significant lost sales, with store-level ordering and replenishment failures the dominant root cause category, not upstream production (FMI supply chain efficiency analysis, FMI 2024).
- McKinsey research on digital distribution in emerging Asia finds that FMCG companies using structured digital demand signals have meaningfully lower inventory costs than those relying on manual tracking. The 20-25% cost differential cited in McKinsey CPG channel research reflects the efficiency gap that field-to-planning alignment directly addresses. (McKinsey, Staying Ahead of the B2B Ecosystem Disruption in Emerging Asia)
Field Data That Improves Forecasts
Not everything a field rep observes is useful to a demand planner. The signal has to be specific, structured, and consistent to be usable. These are the four categories of field observation that materially improve forecast accuracy.
Outlet stock depth and days-of-cover at territory level. When field reps record stock levels during outlet visits, the aggregated data tells the demand planner whether secondary stock is running high or low relative to the expected sell-out rate. A territory where outlets are carrying 12 days of stock when normal is 7-8 days signals a pull-through problem. A territory where outlets are at 3 days of stock heading into a peak period signals a likely out-of-stock risk. Neither signal appears in shipment data until it's too late to act.
Promotion uptake rates at outlets versus planner projections. Demand planners typically model promotional volume lifts based on historical promotion performance or category benchmarks. Field reps see the actual uptake at outlet level within days of a promotion launching. If the lift is running 30% below projection in a key territory, that's an early signal to adjust the demand plan, redirect stock, or escalate the underperformance to trade marketing. See Trade Marketing and Field Alignment for how to build this feedback channel into the promotional cycle.
New outlet openings and closures. Demand planners work from static outlet universe models that update slowly. Field reps encounter new outlets, relocated stores, and closures as they happen. A new modern-trade format in a growth city can absorb several hundred cases per week that weren't in the demand plan. An outlet closure removes demand that was being forecast. These changes accumulate, and the delta between the planner's outlet universe and reality gets bigger every quarter.
Competitor activity and shelf displacement. When a competitor runs a deep-discount promotion or launches a new SKU with strong in-store support, field reps observe the shelf impact immediately. Gartner's research on demand planning with consumption data points to this kind of downstream sell-out signal as the data that most improves baseline forecast accuracy, precisely because it reflects what is happening at the shelf rather than what moved into the distributor's warehouse. They see their product get secondary-positioned, watch outlet owners switch reorder priority, and hear the feedback from counter staff. This is exactly the kind of demand-disrupting signal that statistical models can't generate.
That's the raw material. The question is how you build a structured channel to move it from the field into the plan.
The Alignment Mechanism
Observing these signals is only useful if there's a structured process to get them into the demand planning system. Three mechanisms make that connection work.
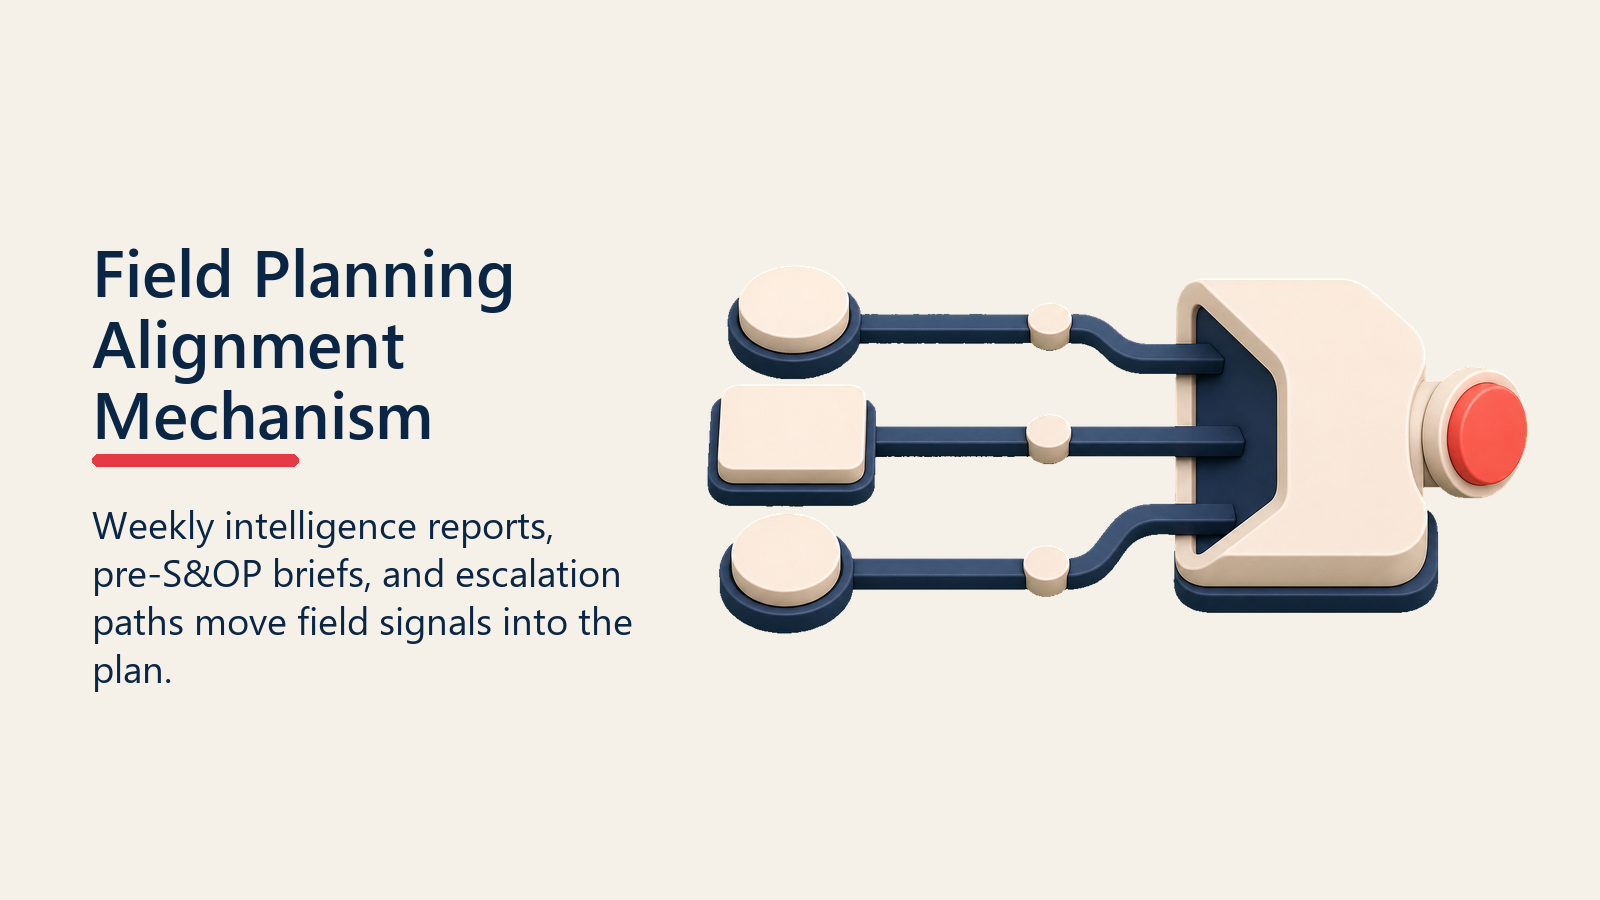
Weekly field intelligence report. This is a standard template completed by territory managers every Friday before 6pm. The template captures five fields per territory: current average outlet days-of-cover by SKU tier, promotional uptake versus plan (expressed as a percentage), any new outlet openings or closures in the week, observed competitor activity with brief description, and one SKU-level alert (overstocked, at risk of OOS, or running normally). The completed reports are aggregated by the regional sales manager and forwarded to the demand planning team as a single input by Monday morning. The discipline is in the template design: five structured fields produce usable data. Open-ended commentary produces noise.
Template: Weekly Field Intelligence Report
| Field | Data Format | Completion Deadline |
|---|---|---|
| Territory name and rep ID | Text | By 5 pm Friday |
| Average outlet days-of-cover by SKU tier (A/B/C) | Numeric (days) | By 5 pm Friday |
| Promotional uptake vs plan this week | Percentage (+/-) | By 5 pm Friday |
| New outlet openings / closures (count and location) | Count + brief text | By 5 pm Friday |
| Competitor activity observed | Brief text (max 50 words) | By 5 pm Friday |
| One SKU-level alert: OOS risk / overstock / normal | Text with SKU code | By 5 pm Friday |
Territory manager input into the monthly S&OP cycle. Sales and operations planning cycles typically happen once a month. Most FMCG companies run the S&OP process without territory-level field input, relying on regional sales managers to represent the market. This works when regional managers have synthesized field intelligence before they walk into the room. It doesn't work when they haven't. Build a structured pre-S&OP field brief into the calendar: regional managers prepare a one-page market state summary, drawing on the previous four weeks of field intelligence reports, and present it at the start of the demand review. The demand planner then has ground-level context before presenting the statistical forecast, rather than discovering gaps in discussion.
Escalation protocol for demand signals that change the short-term plan. Not every field signal waits until Friday's report or next month's S&OP. A competitor product launch that's visibly clearing your stock from secondary display positions, a regional weather event flooding distribution routes, or a distributor warehouse fire that destroys two weeks of stock are all signals that need to reach the demand planning team within 24 hours, not at the next scheduled sync. Define the escalation path: territory manager to regional manager to demand planning contact within the same business day. Define the threshold for escalation: any event likely to shift demand more than 15% versus plan in a given territory over the next four weeks. Write it down and train to it.
But data flows in both directions. The field alignment mechanism only sustains itself when reps see that what they report changes what they receive.
The Feedback Loop: What Field Gets Back from Planning
Field alignment isn't just a data extraction exercise. Reps and territory managers who contribute intelligence need to see it reflected in decisions that affect their work. Without feedback, the weekly field report becomes a task done to comply with a directive, not a communication that changes anything. Three categories of feedback matter.
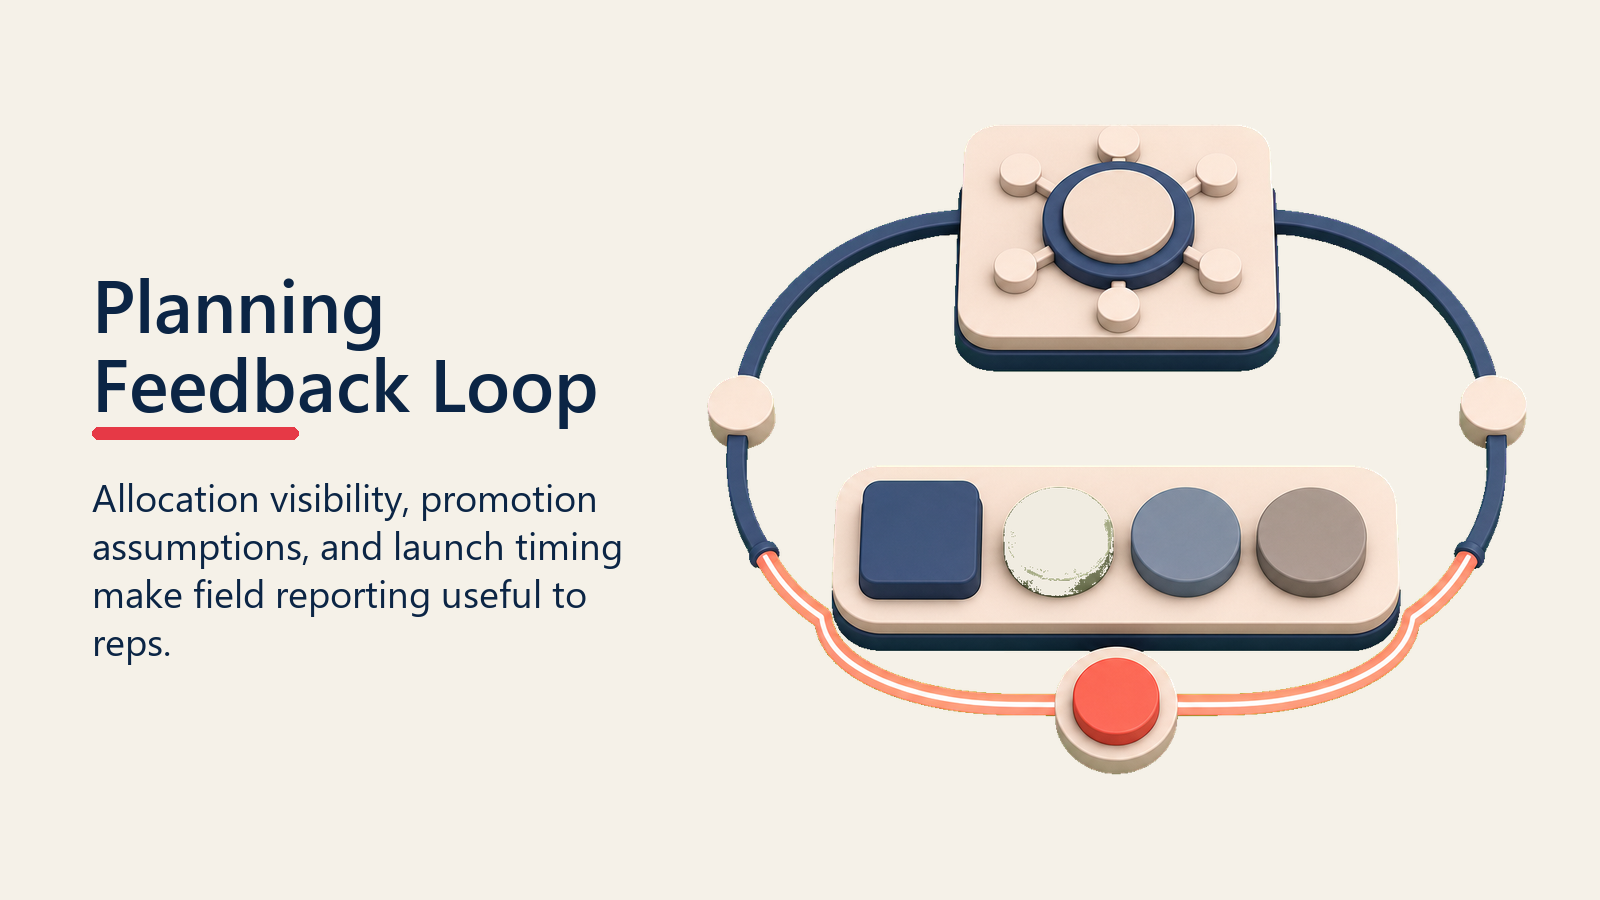
Allocation visibility before stockouts hit. When the demand planning team identifies that a high-velocity SKU is running below safety stock in a region, they should communicate allocation decisions to the field before the stockout happens, not after. Field teams who receive advance notice of constrained supply can prioritize outlet servicing, manage distributor expectations, and direct available stock toward the highest-value outlet universe. This is not a logistics update; it's a commercial decision that field leadership needs to own. Connect this to Secondary Sales and Stock Visibility for the real-time data layer that makes early allocation signals possible.
Promotional volume confirmation. After the demand team models a promotional lift and commits to production and stock builds, the field should receive the underlying assumptions: expected volume lift by territory, stock allocation per distributor, and the timeline for product availability. When field reps know what the planner expected, they can report back meaningfully on whether it's playing out. When they don't know the plan, their feedback on promotion performance is impressionistic rather than calibrated.
New SKU launch timing by territory. Launch timing in FMCG often cascades unevenly across territories. Field reps are the last to learn when a launch has been delayed in their territory or when stock will arrive. Communicating confirmed launch dates, initial allocation quantities, and any territory-specific sequencing to field leadership before commercial activation means the field can plan outlet seeding and distributor briefing rather than improvising when stock arrives.
With the feedback loop established, the next question is how to know whether the whole mechanism is actually working.
How Do You Measure Whether Field-Planning Alignment Is Working?
Alignment that isn't measured is alignment that drifts. Three metrics tell you whether the field-to-planning connection is functioning.
Forecast accuracy at territory level. Standard demand planning metrics track forecast accuracy at SKU-category or regional level. Add a territory-level accuracy cut. If forecast accuracy at territory level is materially worse than at regional level, the aggregation is masking local demand signal failures that the field intelligence process should be catching. Track the mean absolute percentage error (MAPE) at territory level quarterly.
OOS incidents linked to forecast miss. When an outlet reports an out-of-stock, trace it back. Was it a distribution failure (the stock existed but didn't get there) or a forecast miss (the stock didn't exist because demand was underforecast)? Tracking the share of OOS events attributable to forecast miss identifies how much of the OOS problem is a planning problem versus an execution problem. See Outlet Out-of-Stock Reduction for the full diagnostic framework.
Field intelligence report submission rate. This is the input metric. If territory managers are submitting field reports at less than 90% weekly compliance, the alignment mechanism isn't functioning, regardless of what the dashboard shows. Track submission rate by territory and region. Use it in regional manager performance conversations.
| KPI | Measurement | Target | Review Trigger |
|---|---|---|---|
| Forecast accuracy (MAPE) at territory level | Monthly | Within 5 percentage points of regional MAPE | Any territory >25% MAPE for two consecutive months |
| OOS incidents attributed to forecast miss | Monthly | Below 30% of total OOS events | Exceeds 40% in any region |
| Field intelligence report submission rate | Weekly | Above 90% across all territories | Any region below 80% for two weeks |
| S&OP field brief completion | Monthly | 100% of regions | Any region missing pre-S&OP brief |
These metrics don't sit in isolation. The data flows they generate feed directly into how distributors are managed and how route-to-market decisions get made.
Integration with Broader Commercial Operations
Demand and field alignment doesn't sit in isolation. The data flows it creates feed directly into distributor management and route-to-market decisions.
When field intelligence reveals that a distributor's territory is consistently running below expected sell-through rates, it's a signal that either the distributor's van sales team isn't executing or the demand in that territory is structurally weaker than the plan assumed. Either way, the action is different from the action you'd take if the weakness didn't show up until a primary sales miss at month-end. See Sales and Distributor Alignment for the commercial management framework.
When field intelligence reveals geographic pockets of strong demand growth that aren't reflected in current distributor coverage, it's an input into route-to-market design: do you add a sub-stockist, extend the distributor's van sales routes, or shift to a different delivery model in that geography? FMCG Sales KPIs and Metrics provides the measurement structure that connects field intelligence to commercial performance decisions.
The planning methods that govern how demand signals translate into production and procurement commitments, and the supply-chain visibility layer that works alongside field alignment to reduce stock imbalances, are covered in the Learn More section below.
The Three-Layer Field Intelligence Model
The model separates stable historical signals from planned commercial events and live market observations from the field.
The Three-Layer Field Intelligence Model: Most FMCG planning functions treat demand forecasting as a two-input problem: historical shipment data plus a promotional calendar. Field alignment adds a third input layer that the other two can't replicate. Layer 1 is historical pattern data (ERP-sourced, backward-looking). Layer 2 is forward calendar data (planned promotions, launches, price changes). Layer 3 is real-time market observation: what field reps see at outlet level today, not what the data said three weeks ago. Forecast accuracy improvements come almost entirely from closing the latency gap in Layer 3. The statistical models in Layer 1 don't need to be replaced; they need better inputs, and Layer 3 provides them.
"A forecast built from primary sales data is a forecast of distributor behavior, not consumer demand. The field team is the only part of the organization that can close that gap in real time."
"The weekly field intelligence report is not a reporting task. It's the input that makes the demand plan accurate enough to be worth executing."
"Submission rate on field intelligence reports is the leading indicator. Forecast accuracy is the lagging indicator. Most planning teams only measure the lagging one." (Supply chain practitioner principle; consistent with benchmarking literature from the field planning community.)
Conclusion
Field intelligence is a free demand signal that most FMCG companies systematically ignore. The information exists. Reps collect it every day through their outlet visits and distributor conversations. But without a structured channel to get that intelligence into the demand planning process, it dissipates in casual conversation and informal message threads.
Building the channel costs less than the stockouts, overstock write-offs, and promotional misalignments it prevents. A five-field weekly template, a pre-S&OP field brief process, and a defined escalation protocol are not complex systems. They're communication disciplines that create the connection between where demand happens and where demand is planned.
Once that connection exists, forecasts improve immediately. Not because the statistical models changed, but because the inputs finally reflect what's actually happening at the shelf.
Frequently Asked Questions about Demand Planning and Field Alignment in FMCG
Why is primary sales data not enough for FMCG demand planning?
Primary sales measure what moves from the manufacturer or national importer into the distributor's warehouse. That's a measure of distributor stocking behavior, not consumer pull-through. Distributors forward-buy ahead of price increases, hold more stock before long weekends, and cut orders when their working capital is strained. All of those behaviors show up as demand signal noise in primary data. Secondary sales (what the distributor sells out to outlets) and field-observed stock levels are much closer to actual consumer demand.
How do you get field reps to submit intelligence reports consistently?
Consistency comes from two things: the template must be short enough to complete during a normal working day (five structured fields, not a narrative essay), and reps need to see that the data changes decisions. If territory managers watch their promotional uptake reports influence the next month's stock allocation, they continue submitting. If reports disappear into a spreadsheet and nothing changes, submission rates fall within two months.
What's a reasonable forecast accuracy target for territory-level FMCG planning?
Industry practice varies by category velocity and market volatility, but a commonly used target is a mean absolute percentage error (MAPE) below 20% at SKU-territory level for core SKUs. High-velocity, stable SKUs should achieve 10-15% MAPE; promotional and seasonal SKUs typically run higher. The key diagnostic is not the absolute accuracy level but the gap between regional and territory accuracy: if territory accuracy is significantly worse, local demand signals aren't getting into the plan.
How often should field intelligence feed into the S&OP process?
Weekly field reports should aggregate into a monthly S&OP input. The weekly cadence captures real-time signals and allows rapid escalation of significant demand events. The monthly aggregation provides the structured format that demand planners can incorporate into statistical models without being overwhelmed by weekly volatility. Quarterly territory manager participation in full S&OP reviews adds the qualitative market context that numbers alone can't convey.
What is the escalation threshold for field demand signals that should bypass the weekly report?
Any event likely to shift territory demand by more than 15% versus plan in the next four weeks warrants same-day escalation rather than waiting for the Friday report. Practical triggers include: a competitor launching a new SKU with aggressive in-store support, a regional weather event disrupting distribution routes, a major distributor warehouse incident, or a promotional event at a modern-trade account that's visibly clearing your product from general-trade outlet secondary display. Document the escalation threshold in writing and train territory managers to it. An unwritten threshold is a threshold no one uses.
How does field-to-planning alignment differ from a standard sales force automation (SFA) implementation?
SFA systems automate field activities: route management, call recording, order capture, and outlet compliance tracking. Field-to-planning alignment is a process design question: are the right observations flowing from field teams to demand planners, and is planning feeding back to the field in time to change behavior? SFA generates data. Alignment structures determine whether that data reaches the planning function in a usable form and on a usable timeline. Companies often implement SFA and discover that forecast accuracy doesn't improve because no one built the bridge between the data the SFA captures and the planning process that needs it.
What makes a good pre-S&OP field brief?
A one-page market state summary prepared by the regional manager before each monthly S&OP demand review, drawing on the previous four weeks of field intelligence reports. It should include: the three most significant demand deviations observed (positive and negative), any territory where promotional uptake ran more than 20% above or below plan, any competitor activity that materially shifted shelf dynamics, and the regional manager's adjustment to the statistical forecast for the coming month with rationale. One page, not a deck. The planning team uses it to stress-test the statistical model before the demand review meeting begins.
Learn More

Senior Implementation Consultant
On this page
- Why Does the Gap Between Field and Planning Exist?
- Field Data That Improves Forecasts
- The Alignment Mechanism
- The Feedback Loop: What Field Gets Back from Planning
- How Do You Measure Whether Field-Planning Alignment Is Working?
- Integration with Broader Commercial Operations
- The Three-Layer Field Intelligence Model
- Conclusion
- Learn More