Retail Execution Analytics: Turning Field Data Into Distribution and Shelf Performance Decisions
Turn this article into takeaways for your work.


Each assistant summarizes the article only for you and suggests best practices for your work.
FMCG field teams collect more data than ever before. Call reports. Photo audits. GPS tracks. Order records. Secondary sales feeds from distributors. And yet most commercial leaders will tell you the same thing: they have more reports and less clarity.
The data problem in retail execution isn't volume. It's translation. Field data is captured but not converted into decisions. Supervisors see call compliance percentages. Area managers get weekly outlet coverage tables. National managers receive monthly trend slides. And somewhere in all of that, the question that actually matters, which outlets in which territories are costing us distribution and shelf space right now, never gets answered.
Retail execution analytics is the practice of converting field activity data into specific commercial decisions about coverage, assortment, and in-store compliance. Not dashboards. Not reports. Decisions. This article covers how to build that practice.
What Retail Execution Analytics Covers
Retail execution analytics spans everything between the DSR's (Direct Sales Representative's) field activity and the commercial outcome it's supposed to produce. The metrics it tracks are:
Call compliance: did the DSR visit the planned outlet, on the planned beat, on the planned day? Call compliance is the foundation. Without it, everything downstream is guesswork.
Numeric distribution: what percentage of the target outlet universe stocks each priority SKU? Numeric distribution tracks breadth, are we in enough doors?
Weighted distribution: what percentage of total sales value in the category do the outlets stocking each priority SKU represent? Weighted distribution tracks quality, are we in the right doors?
Must-sell compliance: at the outlets the DSR visited, what percentage confirmed that must-sell SKUs were ranged, in-stock, and priced correctly? Must-sell compliance is the conversion step between being stocked and being sold.
Planogram adherence: is the product placed where it should be on shelf, facing the right direction, with correct shelf space allocation? Planogram adherence drives sales velocity once distribution is established.
Out-of-stock rate: what percentage of visits found a priority SKU listed but not available on shelf? Out-of-stock is the gap between distribution as recorded (ranged) and distribution as it exists (stocked and available). Deep learning research published in Sensors demonstrates that automated shelf image analysis, using AI image recognition (software that reads shelf photos to identify products and flag gaps), can detect fully empty out-of-stock positions at over 86 percent average precision, underscoring why AI-assisted photo audit is now a credible alternative to manual spot checks.
Promotion uptake: during promotional periods, what percentage of targeted outlets have activated the promotion correctly, POS materials present, promotional price applied, featured placement secured?
Each of these metrics describes a different failure mode in the path from field activity to commercial outcome. A brand can have 85% numeric distribution and still lose a significant share of its volume opportunity because out-of-stock rates are high and planogram compliance is low. Analytics that only track distribution breadth miss the compliance and availability problems that undermine it.
For the broader framework connecting these metrics to commercial outcomes, FMCG Sales KPIs and Metrics covers how these indicators connect to volume targets and market share measurement.
Key Facts: Retail Execution Analytics
- The global average out-of-stock rate for mainstream FMCG products across developed markets is approximately 8.3%, a figure documented by researchers Thomas Gruen and Daniel Corsten in a widely cited study and confirmed by Grocery Manufacturers Association benchmarks. A typical retailer loses about 4% of sales to stockouts. (GMA/Grocery Out-of-Stock Study)
- Enterprise AI image recognition platforms report 90 to 95 percent or better SKU-level accuracy from standard shelf photos in live field conditions, making photo-based planogram audit a credible alternative to manual spot checks at scale (VisionGroup Retail, a retail image-recognition vendor, reports this range in their 2026 shelf audit analysis; independent peer-reviewed benchmarks for live FMCG deployments vary).
- Promotions at the retail level cause order swings of 200-400% at the manufacturer level, a documented consequence of stockout and forward-buying dynamics that leading-indicator analytics is designed to anticipate before the damage reaches secondary sales data. (Supply Chain Math, Bullwhip Effect research)
Data Sources and Their Reliability
Not all field data is equal. Before building analytics on top of it, commercial leaders need to understand what each data source actually measures and how reliable it is.
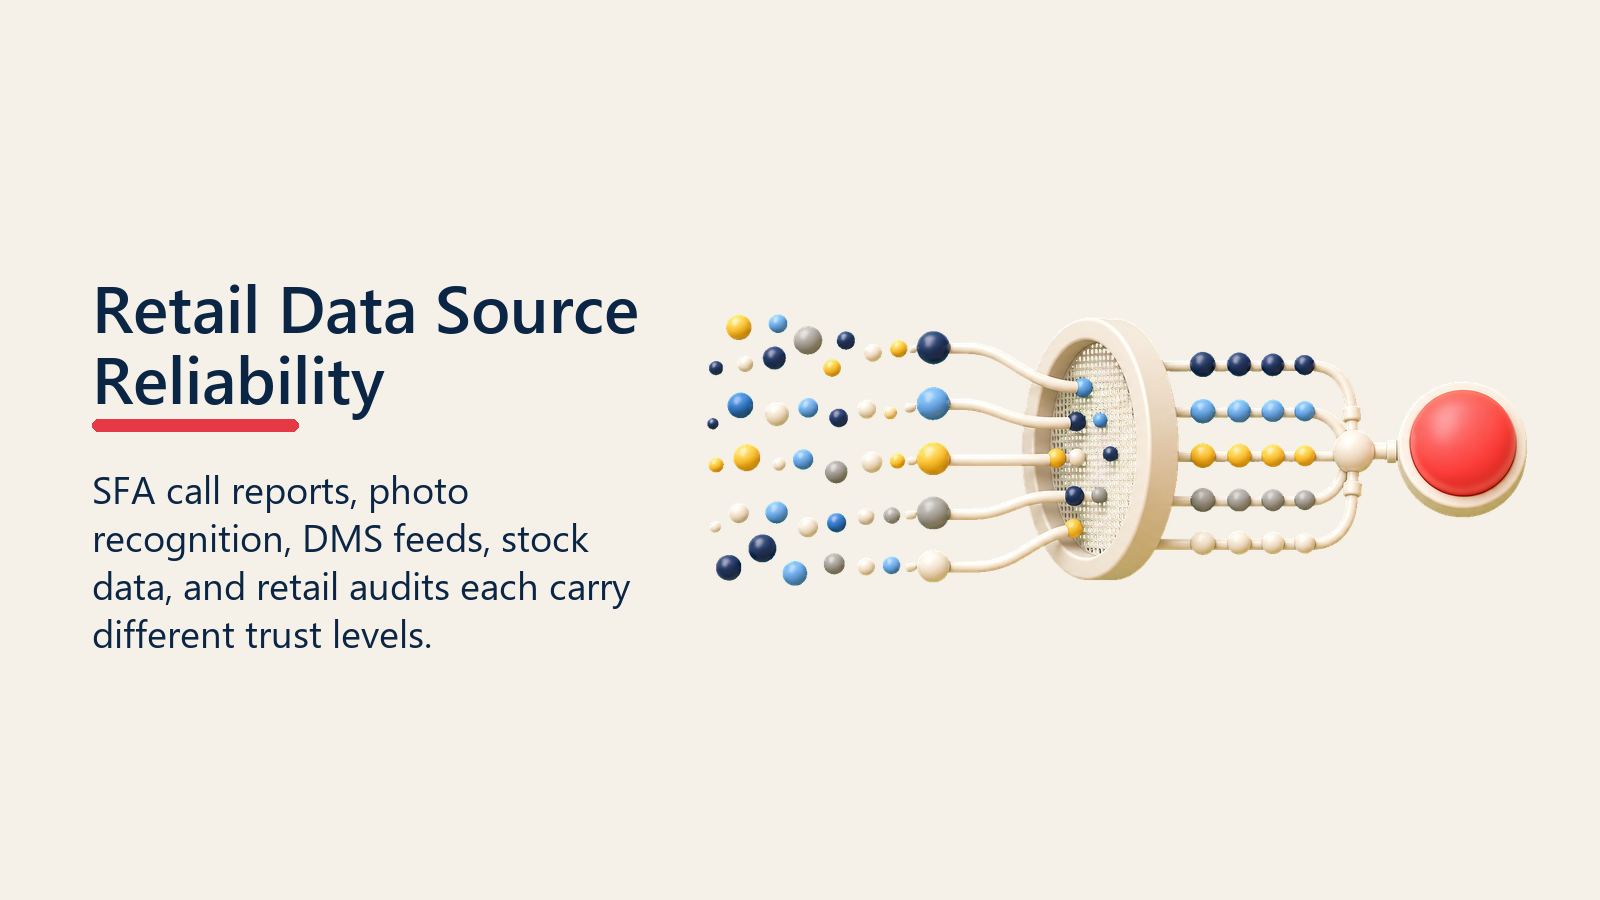
SFA (Sales Force Automation) call reports record what the DSR says happened at each outlet. They're the most current data source, available in near real time, and also the most susceptible to self-reporting bias. A call report that says must-sell SKUs were compliant is only as reliable as the DSR who completed it. Photo evidence and manager spot checks calibrate self-reported data, but they don't replace the need for data quality governance.
Photo recognition data (images captured by the DSR at the outlet, processed by AI image recognition) is more objective than self-reported call data. A 2020 peer-reviewed study on deep learning for retail product recognition confirms that computer vision systems can identify individual SKUs on shelf and flag planogram gaps, stock-tracking failures, and compliance deviations from a single photo. AI image recognition can detect shelf share, planogram compliance, competitor presence, and POS material installation from a shelf photo within seconds. But photo data is only as complete as photo submission rates, and it only covers what the photo captures. A DSR who takes a photo of the compliant section and not the non-compliant one is gaming photo evidence in the same way GPS can be gamed.
DMS secondary sales feeds record actual transactions from the distributor to the outlet. This is the closest thing to ground truth for what's actually moving through the channel. DMS data typically arrives with a 1-3 day lag depending on the distributor's system and reconciliation processes. It's more reliable than self-reported call data but more complex to interpret: secondary sales reflect distributor stocking patterns, ordering cycles, and credit constraints as well as underlying demand.
Distributor stock feeds show inventory on hand at the distributor level. They're useful for identifying stock-out risk before it reaches outlets but often arrive with a 24-48 hour lag and require product code alignment between distributor systems and the principal's master data.
Third-party retail audit data from providers who physically audit outlets provides independent verification of numeric distribution, shelf share, and compliance. It's typically the most reliable data source and the least current (most retail audit providers deliver monthly or quarterly data) and covers a sample rather than the full outlet universe.
The integration requirements connecting these sources are covered in SFA and Distributor Management Systems, which describes the technology architecture that makes field data usable for analytics.
The Metric Hierarchy: Leading and Lagging Indicators
The most important structural decision in retail execution analytics is understanding which metrics predict outcomes and which confirm them.
| Metric Type | Examples | Prediction Horizon | Actionability |
|---|---|---|---|
| Leading indicators | Call plan adherence, must-sell coverage, visit frequency by outlet tier | 4-8 weeks ahead of volume impact | High, can be changed now |
| Coincident indicators | Out-of-stock rate, planogram compliance, promotion uptake | Current week's volume impact | Medium, requires field response within days |
| Lagging indicators | Secondary sales volume, numeric/weighted distribution, market share | Confirms past 4-13 weeks of activity | Low, can explain what happened, not change it |
The management implication is direct: lagging indicators tell you where you've been. Leading indicators tell you where you're going. Most FMCG review meetings spend 80% of the time discussing lagging indicators (volume vs. target, distribution vs. last month) and 20% discussing leading indicators (call adherence, must-sell compliance). That ratio needs to reverse.
A territory with strong call plan adherence this week and high must-sell coverage is building toward volume growth in 4-8 weeks. A territory with declining call adherence and rising out-of-stock rates is setting up for a volume problem that will show up in the secondary sales data after the damage is done. Leading indicator analytics lets commercial leaders intervene before the miss rather than explain it afterward.
Analysis Cadence: When to Look at What
Retail execution analytics doesn't produce value by existing. It produces value through a defined cadence of review, interpretation, and action.
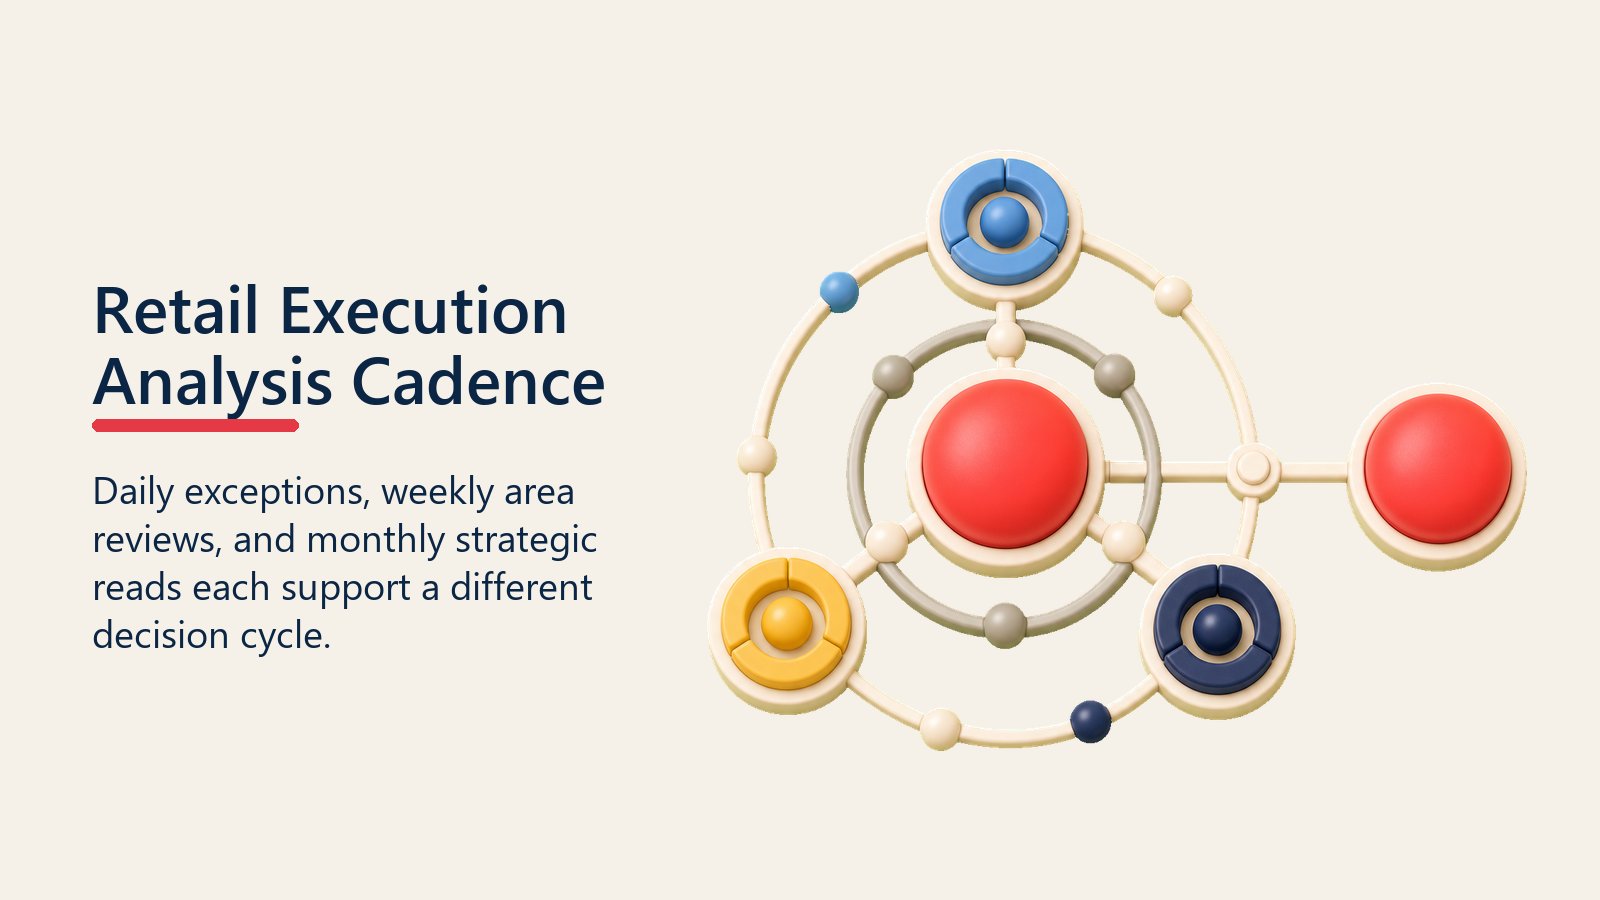
Daily exception reports are for the field. The area manager's daily view should flag which beats are running behind plan, which DSRs have low call report completion rates, and which high-priority outlets haven't been visited in more than their scheduled frequency window. This isn't a report to be read. It's a set of signals to act on before the market closes.
Weekly area reviews are for supervisors and area managers. The weekly view should cover beat adherence across the team, must-sell compliance rates by DSR and product group, distribution gaps in priority outlets, and volume versus target from secondary sales data available within the week. The weekly review supports coaching conversations: which DSRs need support, which outlets need attention, which product categories are showing compliance gaps.
Monthly strategic reads are for regional managers and commercial directors. Monthly analytics should cover numeric and weighted distribution trends across the territory, out-of-stock rates by channel and outlet tier, promotion uptake rates against plan, and secondary sales trends versus prior year and versus territory plan. Monthly reads drive resource allocation decisions: where to add field force effort, where to redirect trade promotion spend, where distributor issues are capping performance.
FMCG Sales Dashboards describes how these cadences map to specific dashboard designs for each organizational level. But first, the cadence question runs into a structural problem most FMCG operations get wrong: which level of the organization should be looking at which level of the data?
Outlet-Level vs. Territory-Level Analysis
One of the most common analytics mistakes in FMCG commercial operations is staying at the territory level when the decision requires outlet-level data, and drilling to the outlet level when the decision belongs at the territory level.

Territory-level analysis is right for: resource allocation decisions (should we add a DSR in this geography), channel strategy reviews (are wet markets outperforming modern trade in this area), and trend tracking against targets (is distribution building at the planned rate).
Outlet-level analysis is right for: coaching conversations (which specific outlets has this DSR been missing), compliance interventions (which outlets in the modern trade channel have planogram compliance below standard), and opportunity identification (which high-potential outlets by category index are currently not stocked on a priority SKU).
The discipline is knowing which level to operate at for each decision. Territory averages hide the outlet-level patterns that explain them. But outlet-level data without aggregation creates noise that obscures the territory-level signal. The commercial leaders who get the most from retail execution analytics are the ones who can move fluidly between levels depending on the question they're answering.
For the relationship between outlet-level data and distribution measurement, Numeric and Weighted Distribution covers how to calculate and interpret distribution metrics at both levels. And one of the biggest shifts in how that data gets collected is happening at the shelf itself.
What Can Photo-Based Execution Audit Actually Measure?
Photo-based execution audit has changed what's possible in retail compliance measurement. Five years ago, compliance checking meant supervisor spot checks and periodic third-party audits that produced data weeks after collection. Today, AI image recognition can process a DSR's shelf photo in seconds and return: shelf share percentage, number of facings by SKU, planogram compliance score, competitor presence, and whether POS materials are installed correctly.
The practical use cases in FMCG field operations are:
Shelf share measurement at the outlet level. A supervisor who can see the shelf share photo data for every outlet their team visited this week can identify shelf space losses before they show up in secondary sales data. If a competitor has expanded their share at 12 outlets in the territory in the last two weeks, that's a signal worth responding to immediately.
Planogram compliance at scale. A field force of 200 DSRs visiting 20 outlets each per day can generate 4,000 shelf compliance data points daily. No team of supervisors can review 4,000 photos manually. AI image recognition routes exceptions to supervisor queues automatically: only the outlets with planogram compliance below threshold, or where the photo shows a missing SKU, appear in the review queue. Supervisors spend their time on exceptions, not on confirming that compliant outlets are compliant.
POS material deployment verification. Trade promotion spend on POS materials is wasted if the materials aren't in the outlet. Photo audit during promotional periods confirms POS material presence at each outlet visited, providing a deployment completion rate that lets trade marketing see whether the promotion is actually activated in the market.
The Perfect Store and the Call Steps framework describes the in-store execution standards that photo audit is designed to measure. What matters now is what supervisors do with that data once it arrives.
Connecting Analytics to Coaching
The purpose of retail execution analytics isn't to generate reports. It's to give supervisors the specific, data-grounded information they need to coach their teams effectively.
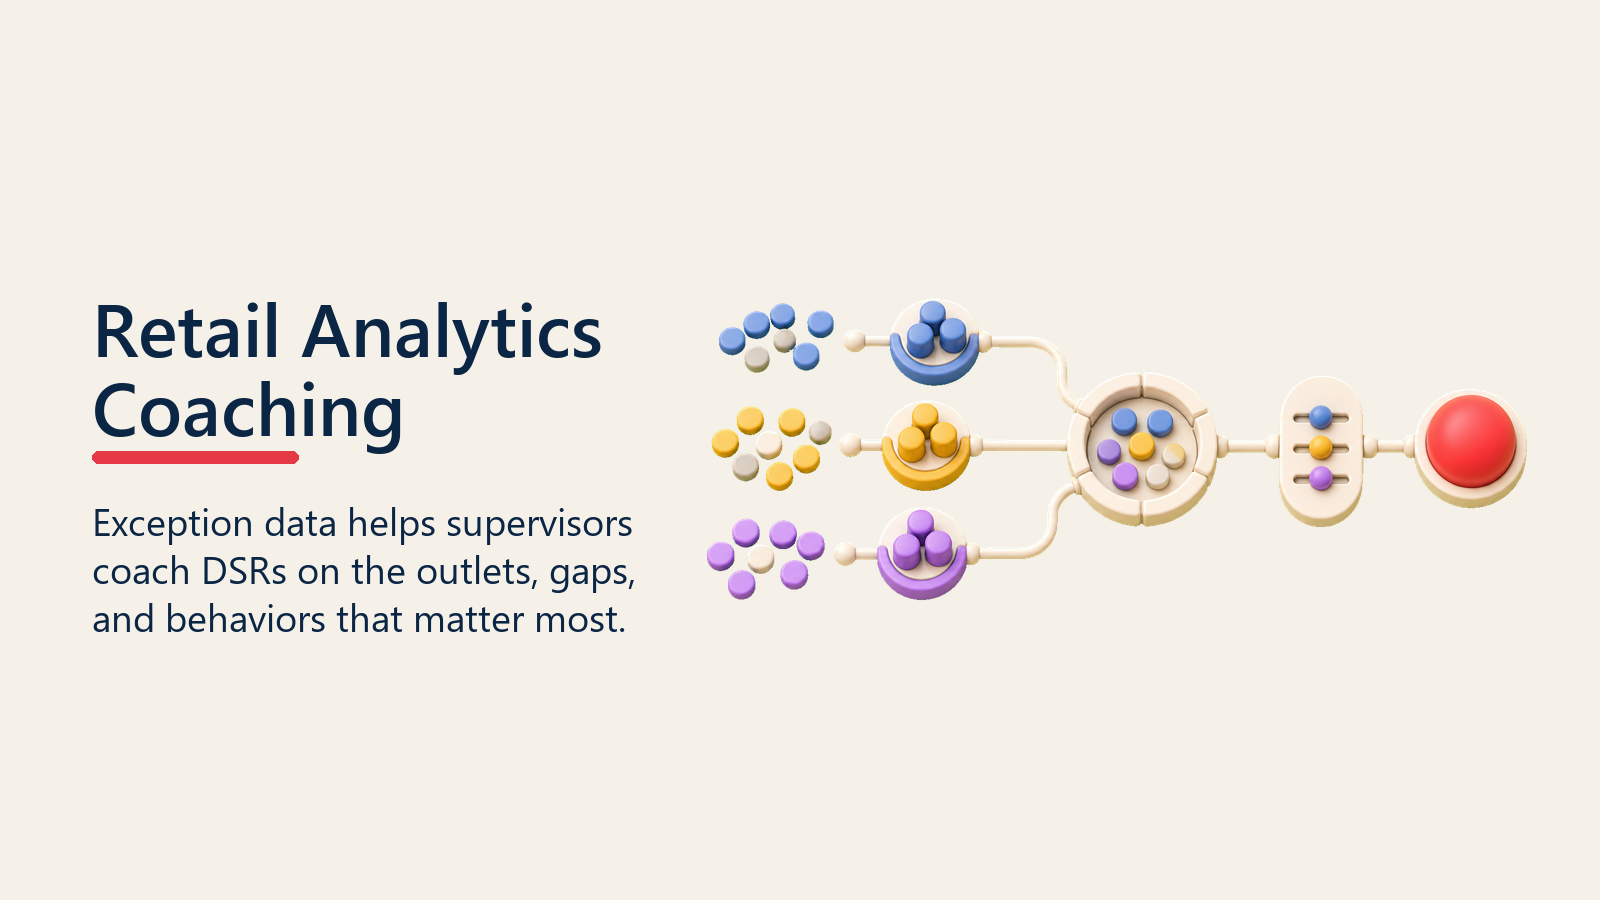
The distinction matters because analytics deployed as a reporting exercise creates a cycle where data is reviewed after the fact to explain results, not before the fact to change them. Analytics deployed as a coaching tool creates a cycle where supervisors walk into ride-alongs knowing exactly which outlets their DSR has been underserving, which compliance gaps they need to address, and which behaviors they want to reinforce.
A supervisor who knows that a DSR's must-sell compliance rate in modern trade outlets is 72% (against a team average of 84%), that three of their top-10 volume outlets haven't had a visit in the last 10 days, and that their photo submission rate is the lowest on the team has specific observations to bring to a coaching conversation. That conversation is different from a generic discussion of target attainment.
For this to work, the analytics layer needs to surface DSR-level data in a format that supervisors can act on without spending 30 minutes of their own analysis time. Exception-flagged DSR dashboards, ranked by the metrics most predictive of the supervisor's territory outcome, make coaching insights accessible rather than buried in exports.
Territory Analytics and Sales Dashboards in the pharmaceutical growth library describes how the same coaching-from-data principle applies in pharma field force management, with parallel structures for supervisor dashboards, coaching cadences, and metric selection.
The Pipeline Coverage Analysis framework from pipeline management applies a related concept to B2B sales: identifying coverage gaps in the pipeline before they become misses, using the same leading-indicator logic that retail execution analytics applies to distribution and compliance.
Closing the Loop Between Field Activity and Commercial Outcomes
The test for whether a retail execution analytics practice is working is simple: can you trace a commercial outcome back to a specific field activity decision, and can you identify a field activity gap before it produces a commercial miss?
If your secondary sales dipped 8% in a territory last month and the analytics tells you that call plan adherence dropped from 88% to 71% six weeks earlier, and that must-sell compliance in your priority modern trade accounts fell below 75% during the same period, you've closed the loop. You understand what happened, why it happened, and when it started. More importantly, you know what leading indicators to watch to catch the same pattern early next cycle.
The Revenue Operations Dashboard framework describes how commercial operations leaders structure multi-source analytics into decision views, a design principle that applies directly to how retail execution data should be presented alongside volume and distribution outcomes.
Most FMCG commercial operations have the raw data to do this. What they're missing is the analytical structure: a clear metric hierarchy with leading and lagging indicators, a defined cadence that connects daily field data to weekly coaching and monthly strategy, and a data quality standard that makes the data trustworthy enough to act on.
Build the structure. Connect the data. And the field activity that's already happening becomes commercial intelligence rather than compliance paperwork.
Quotable Nuggets
"When a consumer can't find what they're looking for, 70% will buy a different brand and 30% will leave the store entirely, making out-of-stock not just a lost sale, but a competitor acquisition event.", Retail OOS research (source)
"Enterprise image recognition platforms operating under standard field conditions achieve 90 to 95 percent or better accuracy at the SKU level, a threshold at which the technology becomes trustworthy for operational decisions.", VisionGroup Retail, 2026, a retail image-recognition vendor (source)
The Lead-Coincide-Lag Analytics Hierarchy: A practical framework for structuring retail execution analytics so each organizational level acts on the right time horizon.
- Leading indicators (call plan adherence, must-sell coverage, visit frequency): 4-8 weeks ahead of volume impact; highest actionability for field teams and area managers
- Coincident indicators (out-of-stock rate, planogram compliance, promotion uptake): current-week volume impact; requires field response within days
- Lagging indicators (secondary sales volume, numeric/weighted distribution, market share): confirms past 4-13 weeks of activity; low actionability for commercial correction
The discipline is investing review time in proportion to actionability. Most FMCG review meetings invert this hierarchy, spending 80% of the time on lagging indicators explaining what already happened.
Learn More

Senior Implementation Consultant
On this page
- What Retail Execution Analytics Covers
- Data Sources and Their Reliability
- The Metric Hierarchy: Leading and Lagging Indicators
- Analysis Cadence: When to Look at What
- Outlet-Level vs. Territory-Level Analysis
- What Can Photo-Based Execution Audit Actually Measure?
- Connecting Analytics to Coaching
- Closing the Loop Between Field Activity and Commercial Outcomes
- Learn More