FMCG Sales KPIs and Metrics: The Dashboard Every Commercial Team Should Run On
Turn this article into takeaways for your work.


Each assistant summarizes the article only for you and suggests best practices for your work.
There's a version of the monthly business review that plays out in FMCG companies everywhere. The regional manager presents the revenue number: up 4% versus plan, or down 6%, or flat. The conversation then jumps immediately to what to do about next month. Nobody can explain why this month happened the way it did, because nobody was tracking the metrics that would have told them three weeks ago that the number was going to miss.
The commercial teams that consistently hit their numbers don't have better products or more reps. They have better visibility. They track the metrics that precede revenue, not just revenue itself. They know their numeric coverage before the revenue reports arrive. They know their strike rate and lines per order mid-week, not mid-month. They review out-of-stock rates and planogram compliance scores as execution data, not as audit findings.
That's the difference between a team that's always reacting to results and a team that's steering toward them.
The KPI Architecture: Three Levels of Measurement
Key Facts
- Bain's survey of 120 consumer products executives found 90% ranked in-store execution among their top five business priorities, yet fewer than half felt their sales forces were operating at full potential. The gap traced primarily to weak strike rate and lines-per-order performance, not to insufficient call volume.
- NielsenIQ's distribution research in Vietnam found that a manufacturer with 85% national numeric distribution was still absent from 44,000 priority outlets representing 57% of category sales, illustrating that numeric distribution KPIs can mask severe weighted distribution gaps if not tracked alongside each other.
- Research consistently puts average FMCG grocery out-of-stock rates at 8% across retail channels, with fast-moving SKUs and promoted lines running higher. That 8% translates directly into lost sales volume on those SKUs during those periods, since most shoppers confronted with a stockout switch to a competitor brand rather than waiting. (ECR Europe and GMA research, widely cited in on-shelf availability literature.)

FMCG commercial measurement works at three levels, each with a different purpose and a different audience.
Strategic KPIs measure market position and financial performance. They're reviewed monthly and quarterly by the sales director and commercial leadership. They answer the question: "Are we building the business we planned?"
Operational KPIs measure the quality of commercial execution. They're reviewed weekly by area managers and regional managers. They answer the question: "Are we executing the plan correctly?"
Activity KPIs measure the consistency of field force behavior. They're reviewed daily by supervisors and in daily huddles with field teams. They answer the question: "Are the reps doing what the plan requires?"
The three levels cascade. If activity metrics are strong (high call completion, good strike rates) but operational metrics are lagging (low in-store compliance, high out-of-stock rates), the problem is execution quality rather than effort. If operational metrics are strong but strategic metrics are lagging, the problem is either market-level factors or a gap between what the field is measuring and what's actually driving category demand.
Understanding which level is broken saves enormous amounts of time in monthly business reviews that currently spend an hour diagnosing a miss that the data could have explained in five minutes.
Distribution KPIs
Distribution is the foundation of the FMCG sales growth model. Without the right outlets stocking the right SKUs, execution and demand creation have nothing to work with.
Numeric Distribution (ND)
Definition: The percentage of all outlets in the universe that carry at least one of your SKUs. Formula: (Outlets stocking your brand / Total outlets in universe) x 100 Frequency: Weekly or bi-weekly update from SFA data, monthly formal review.
Numeric distribution is the coverage metric. It tells you how much of the outlet universe you're reaching. An ND of 70% in your target geography means 30% of eligible outlets have none of your product. Each percentage point of ND gain represents a discrete set of outlets that just became revenue-generating.
Weighted Distribution (WD)
Definition: The percentage of category sales volume flowing through outlets where your brand is stocked. Formula: (Category volume in outlets where you're stocked / Total category volume in universe) x 100 Frequency: Monthly, from distributor data or retail audit.
WD is more commercially relevant than ND because it weights outlets by their volume contribution. See numeric and weighted distribution for the full methodology. A company with 65% ND but 80% WD is present in the outlets that matter most. A company with 80% ND but 55% WD is covering many small outlets while missing the high-volume accounts.
New Outlet Activation Rate
Definition: The number of previously unserved outlets that placed their first order in the period. Formula: New outlets activated / Period target Frequency: Weekly.
This is the growth engine for numeric distribution. It tracks not just the stock of covered outlets, but the flow of new activations. A team with strong ND but zero new activations is in maintenance mode, not growth mode.
SKU Distribution per Outlet
Definition: The average number of your SKUs stocked per active outlet. Formula: Total SKU-outlet combinations / Active outlets Frequency: Monthly.
This metric captures depth alongside coverage. A high ND with low SKU depth means the outlet carries your product but not your range. Range expansion within existing outlets is often a faster volume driver than activating new ones. So once you have the distribution foundation, what does good execution inside those outlets actually look like?
Execution KPIs
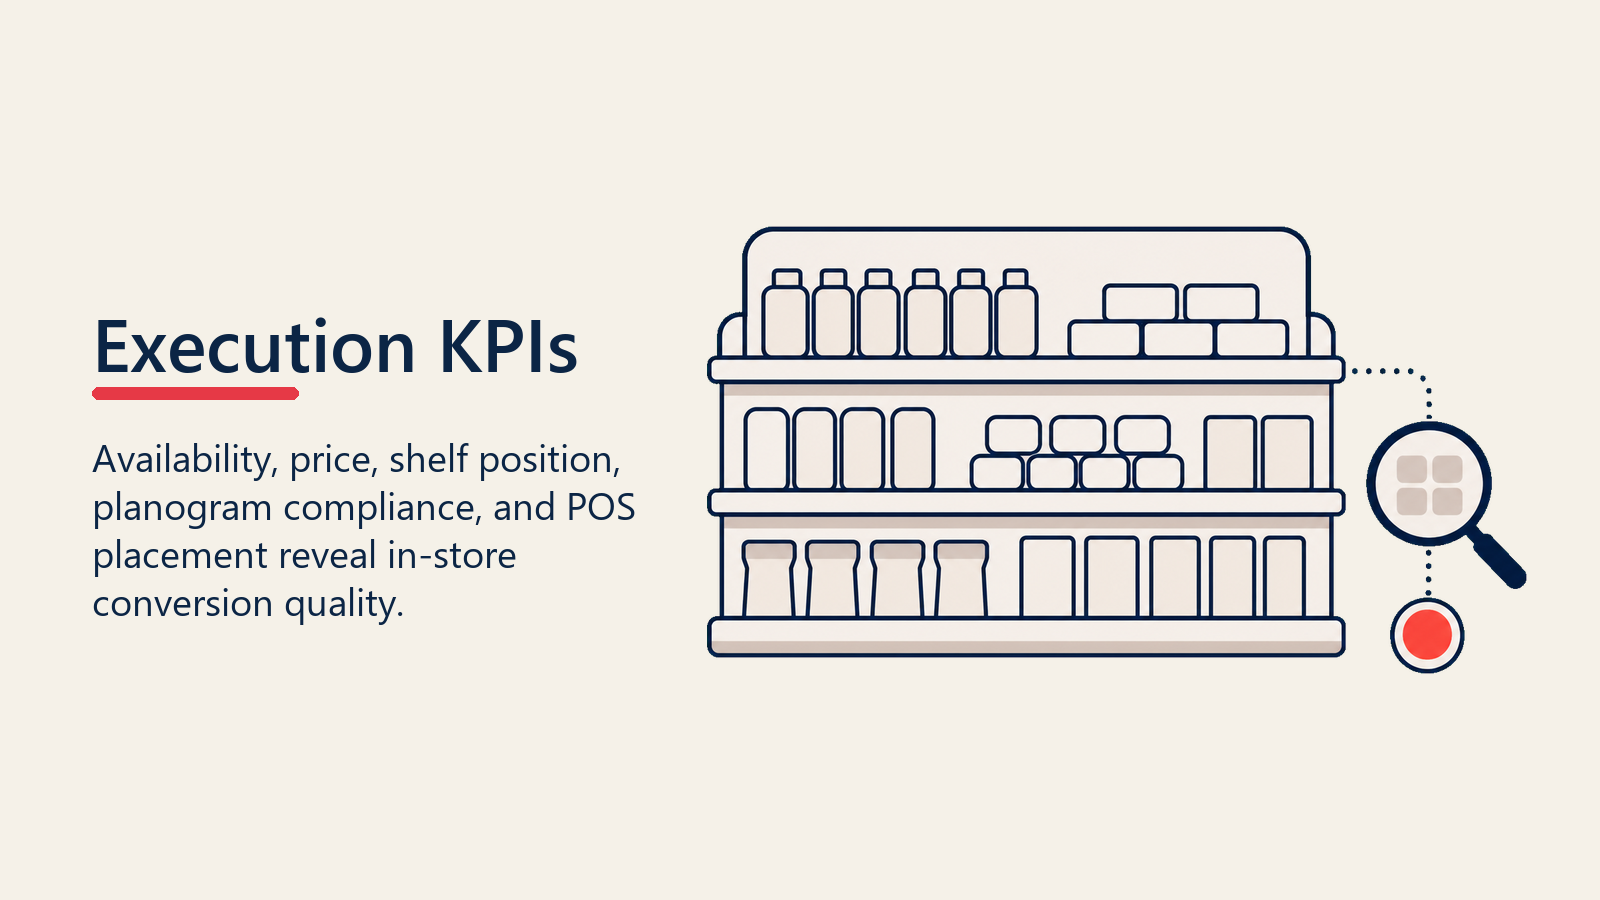
Execution KPIs measure what's happening inside the outlet at the point of purchase. They're the leading indicators of in-store conversion.
Perfect Store Compliance Rate
Definition: The percentage of outlets that meet all defined perfect store criteria in a given visit (availability on all listed SKUs, price compliance, planogram adherence, and active POS placement). Formula: (Outlets meeting all criteria / Outlets audited) x 100 Frequency: Calculated per visit cycle, reviewed weekly.
Perfect store is a composite score that captures whether the outlet is set up to convert shopper traffic into purchase. A perfect store rate of 40% means 60% of your covered outlets have at least one compliance gap that's costing you conversion.
Out-of-Stock Rate
Definition: The percentage of outlet visits where a listed SKU is found to be out of stock (OOS) on the shelf. Formula: (SKU-outlet visits with OOS / Total SKU-outlet visits) x 100 Frequency: Captured per visit, reviewed weekly.
Out-of-stock is the most directly measurable form of revenue loss in FMCG field sales. If your lead SKU is out of stock at 15% of visits, you're losing roughly 15% of potential sales volume on that SKU in those outlets during those periods. NielsenIQ defines on-shelf availability as a core distribution health metric alongside weighted and numeric distribution, since a product technically "in distribution" still loses sales if it isn't physically on the shelf.
The industry-wide average OOS rate in FMCG grocery sits at around 8%, based on research consistently cited by ECR Europe and the Grocery Manufacturers Association. During promotional periods, the rate runs higher, which is the most commercially damaging scenario: brand investment drives shopper demand to an empty shelf, and the lost sale goes to a competitor that maintained availability. The practical implication is that out-of-stock tracking needs to intensify in the two weeks before and during any major promotion, not just during routine audit cycles. Retail execution analytics systems can now flag out-of-stocks from photo recognition, allowing faster remediation than manual audit cycles.
Share of Shelf
Definition: The percentage of total product facings in the category allocated to your brand, at the outlet or territory level. Formula: (Your facings / Total category facings) x 100 Frequency: Monthly from rep audit data.
Share of shelf is a proxy for in-outlet competitive position. Gaining a facing from a competitor in 500 general trade outlets across a region is a significant execution win that won't show up in revenue data for 4 to 6 weeks, but will show up in share of shelf immediately.
Planogram Compliance Rate
Definition: The percentage of outlets where your products are positioned according to the agreed shelf layout for that outlet tier. Formula: (Outlets compliant with planogram / Outlets with agreed planogram) x 100 Frequency: Bi-weekly from rep audit, monthly from formal compliance review.
In modern trade and organized general trade, planogram compliance determines whether the brand is in the eye-level position or buried on a lower shelf behind a competitor. Compliance rates below 70% typically indicate that the planogram agreement isn't being enforced at the outlet level, which means the negotiated shelf position isn't delivering the commercial value the trade investment was meant to secure.
POS Placement Rate
Definition: The percentage of outlets where active point-of-sale materials (shelf talkers, price cards, display units) are in place and in good condition. Formula: (Outlets with active POS / Outlets covered) x 100 Frequency: Monthly.
POS at the outlet creates the last-meter shopper pull that converts awareness into purchase. A well-distributed brand with poor POS placement leaves conversion to chance.
Productivity KPIs
Productivity KPIs measure the commercial output of the field force against the investment in rep time and coverage.
Calls per Day
Definition: The average number of outlet visits completed per working day per rep. Formula: Total outlet visits in period / (Working days x Number of reps) Frequency: Daily from SFA system.
Calls per day is the base productivity measure. But it only means something in context: a rep covering a dense urban beat should average 22 to 30 calls per day. A rep covering a rural beat or a modern trade route will average significantly fewer. Review calls per day against route type, not a single company-wide target.
Order Strike Rate
Definition: The percentage of outlet visits that result in a confirmed order. Formula: (Visits with an order placed / Total visits) x 100 Frequency: Daily or weekly.
Strike rate is the commercial effectiveness metric within coverage. A rep with 70% strike rate is converting 7 of every 10 visits into orders. A rep with 50% strike rate is losing half their visit investment to non-converting calls. The gap between average and high performers on this metric, multiplied across a field team of 50 reps, represents substantial revenue opportunity. Bain's survey of 120 consumer products executives found that while 90% ranked in-store execution among their top five priorities, fewer than half felt their sales forces operated at full potential, and the root cause in most cases was weak strike rate and lines-per-order performance rather than insufficient call volume.
Lines per Order
Definition: The average number of distinct SKUs included in each order. Formula: Total order lines in period / Total orders placed Frequency: Weekly.
Lines per order measures range depth in each sale. A rep averaging 2.1 lines per order while the portfolio has 8 eligible SKUs for the outlet tier is leaving range expansion opportunities on the table. Coaching interventions on lines per order are often more effective than coaching on calls per day because they target conversion quality rather than volume.
Value per Order
Definition: The average gross order value per confirmed order. Formula: Total revenue / Total orders placed Frequency: Weekly.
Value per order, combined with strike rate and calls per day, produces the revenue per rep per day calculation that's the core productivity output metric.
Revenue per Rep per Day
Definition: Total revenue generated by the field team divided by total field-days worked. Formula: Total period revenue / (Rep count x Working days) Frequency: Weekly.
This is the economic productivity metric that connects directly to FMCG field sales economics. It's the numerator in the return-on-field-investment calculation. A rep generating $450 per day in an urban market against a $52 daily cost (from the P&L model) produces an 8.6x daily revenue multiple. Whether that multiple justifies the headcount depends on gross margin rates and corporate cost allocation. And the channel-level picture adds another layer of complexity.
Channel KPIs
Channel KPIs measure the health of the distribution chain between the manufacturer and the outlet.
Secondary Sales vs Primary Offtake
Definition: The ratio of confirmed sell-out from the distributor to outlets (secondary) against manufacturer sell-in to distributor (primary). Formula: Secondary sales volume / Primary sales volume (per period) Frequency: Weekly, reconciled monthly.
When primary exceeds secondary consistently, distributor stock is building. This looks good in short-term revenue reports but creates channel health problems: the distributor may push product onto outlets that aren't moving it, driving expiry risk, and they'll resist future orders once their storage capacity is saturated. A healthy channel maintains secondary sales within 5 to 10% of primary offtake over rolling 4-week periods.
Distributor Stock Days
Definition: The number of days of selling capacity remaining in the distributor's current inventory, at current sell-through rate. Formula: Distributor stock on hand / Average daily secondary sales Frequency: Weekly.
Stock days is the pipeline management metric for the distributor channel. Below 7 days risks an outlet supply gap. Above 30 days suggests over-stocking that ties up distributor working capital and reduces their willingness to take incremental orders. Target range is typically 10 to 21 days depending on replenishment cycle. Sales forecasting methods inform the stock day targets by SKU and season.
Fill Rate
Definition: The percentage of ordered quantity actually supplied to the distributor or outlet in a given cycle. Formula: (Quantity supplied / Quantity ordered) x 100 Frequency: Per order cycle, monthly aggregate.
Fill rate below 95% creates downstream problems: outlet stockouts, rep credibility damage, and distributor dissatisfaction. It's a supply chain metric, but it belongs in the commercial dashboard because its consequences are commercial. A 90% fill rate means 10% of what the trade ordered was unavailable, which translates directly into missed secondary sales.
The Full KPI Reference Table
Use the reference table as a diagnostic map, with each KPI tied to the decision cadence and owner who can act on it.
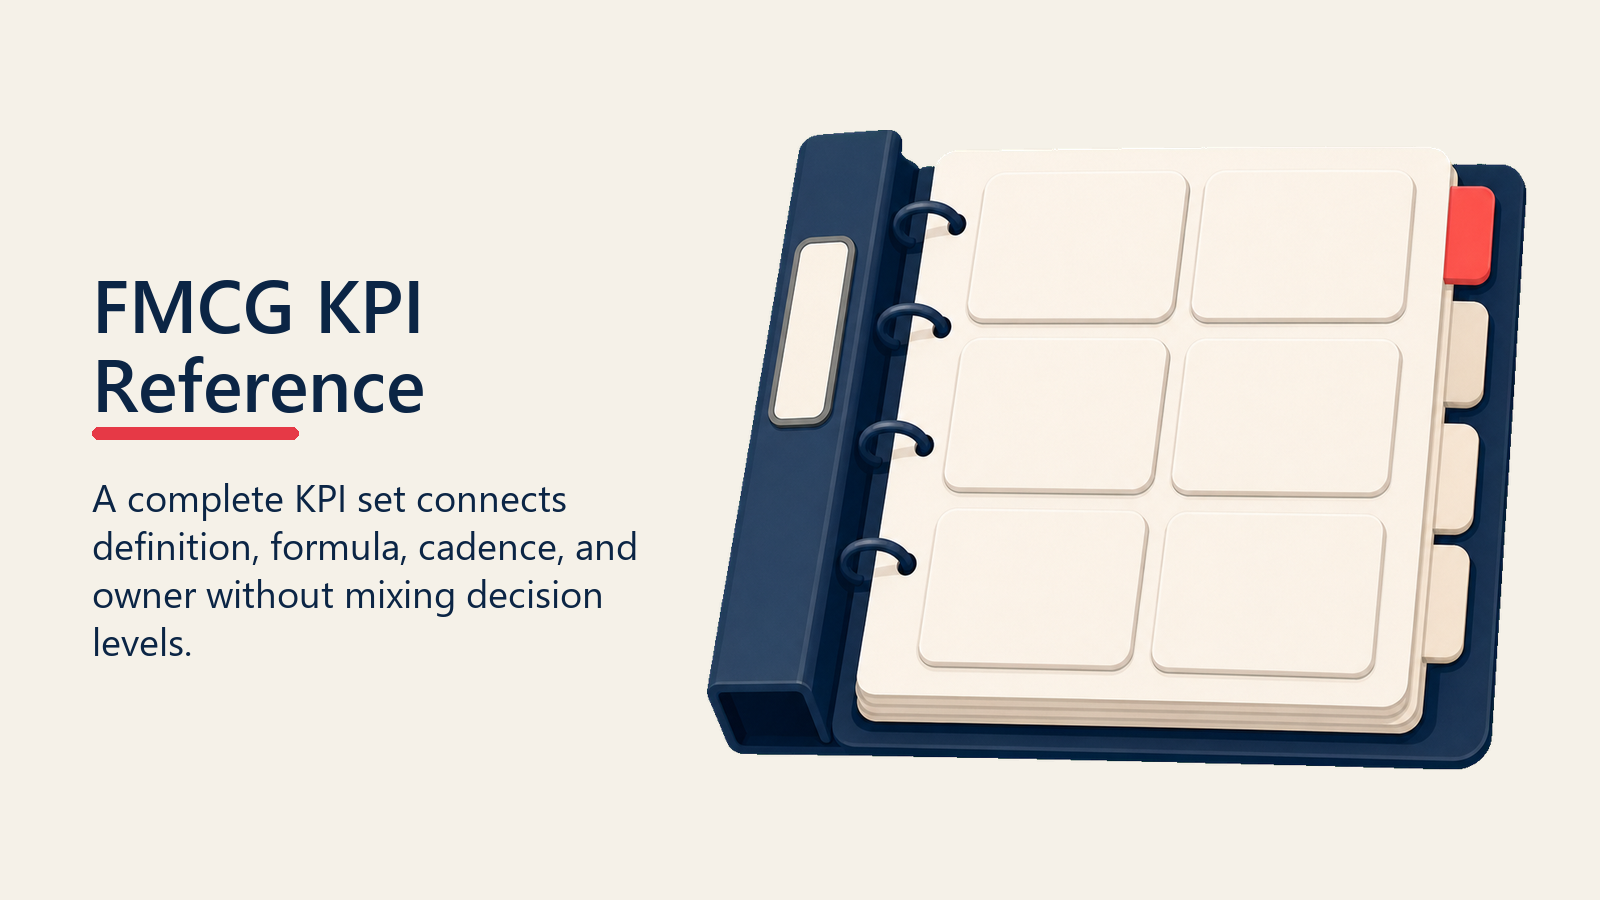
The Three-Level FMCG Commercial Dashboard: a structured KPI architecture that organizes metrics by decision cadence and audience: Strategic KPIs (monthly/quarterly, sales director level) measure market position and financial performance; Operational KPIs (weekly, area manager level) measure execution quality and are the leading indicators of the monthly number; Activity KPIs (daily, supervisor level) measure field behavior consistency. The key diagnostic insight is that a gap at the activity level requires different intervention than a gap at the operational level, and conflating the two produces coaching that doesn't match the actual problem.
| KPI | Definition | Formula | Frequency | Owner |
|---|---|---|---|---|
| Numeric distribution | % outlets stocking brand | Stocked outlets / Universe x 100 | Bi-weekly | Area manager |
| Weighted distribution | % category volume in stocked outlets | WD volume / Total volume x 100 | Monthly | Regional manager |
| New outlet activation | New outlets ordered in period | Count of first orders | Weekly | Area manager |
| SKU depth per outlet | Avg SKUs per active outlet | SKU-outlet / Active outlets | Monthly | Area manager |
| Perfect store rate | % outlets meeting all criteria | Compliant outlets / Audited x 100 | Weekly | Supervisor |
| Out-of-stock rate | % visits with OOS on listed SKU | OOS incidents / SKU-visits x 100 | Weekly | Supervisor |
| Share of shelf | % facings held by brand | Brand facings / Total facings x 100 | Monthly | Area manager |
| Planogram compliance | % outlets planogram-compliant | Compliant / Total with planogram x 100 | Bi-weekly | Area manager |
| Calls per day | Avg daily outlet visits per rep | Total visits / (Days x Reps) | Daily | Supervisor |
| Strike rate | % visits resulting in order | Orders / Visits x 100 | Weekly | Supervisor |
| Lines per order | Avg SKUs per order | Total lines / Total orders | Weekly | Supervisor |
| Value per order | Avg order value | Revenue / Orders | Weekly | Area manager |
| Revenue per rep per day | Daily productivity | Revenue / (Reps x Days) | Weekly | Area manager |
| Secondary vs primary | Sell-out to sell-in ratio | Secondary / Primary | Weekly | Distributor manager |
| Distributor stock days | Days of inventory at current sell-out | Stock on hand / Daily secondary sales | Weekly | Distributor manager |
| Fill rate | % of ordered quantity supplied | Supplied / Ordered x 100 | Per cycle | Supply chain / commercial |
What Review Rhythm Makes KPIs Actually Change Behavior?
The KPIs are only useful if they're reviewed at the right frequency by the right people and connected to action. A weekly out-of-stock rate visible to an area manager on Thursday can generate a field correction before the week ends. The same metric visible only in the monthly business review arrives too late to prevent the revenue loss it describes.
Daily huddle (10 minutes, supervisor with field team): Calls per day from yesterday vs target. Strike rate. Out-of-stock incidents flagged. What's being done about gaps in today's beat.
Weekly area review (30-45 minutes, area manager with supervisors): Strike rate trend. New outlet activations vs weekly target. Out-of-stock rate. Planogram compliance from this week's audits. One coaching topic per supervisor based on the data.
Monthly business review (2 hours, regional manager with area managers and distributor managers): Full KPI set against plan. Weighted and numeric distribution vs target and prior month. Perfect store compliance rate. Secondary vs primary reconciliation. Distributor stock days. Revenue per rep per day by area. One territory deep-dive. FMCG sales dashboards should pre-populate these reviews with current data so the 2 hours are spent on analysis and action planning, not number-reading.
Quarterly commercial review (3 hours, sales director with regional managers): Strategic KPI set. Market share vs target. Weighted distribution gain. Revenue vs plan by channel and region. Key initiative performance. RTM efficiency metrics. Workforce productivity trends. Field economics review using the revenue operations dashboard.
Sample Weekly Scorecard: Area Manager View
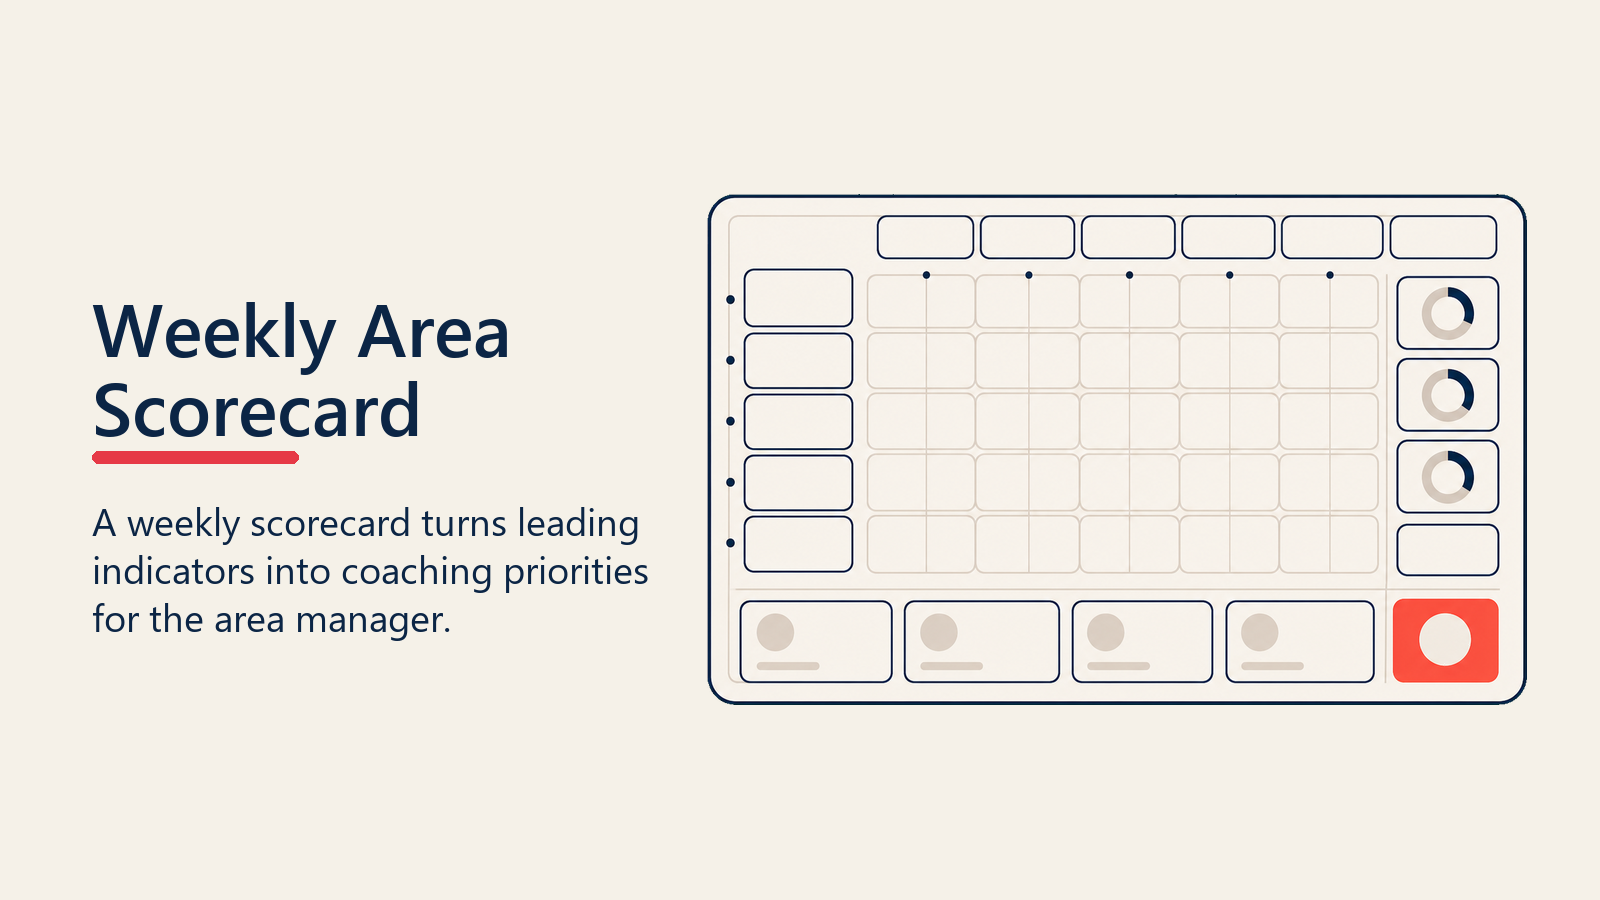
The weekly scorecard gives the area manager a one-page view of their territory's performance against the leading indicators that drive the monthly number.
| Metric | This week | Last week | Weekly target | Status |
|---|---|---|---|---|
| Calls per day (avg) | 24.3 | 23.1 | 25 | Yellow |
| Call completion rate | 91% | 89% | 95% | Yellow |
| Strike rate | 71% | 68% | 70% | Green |
| Lines per order | 3.4 | 3.2 | 3.5 | Yellow |
| Value per order | $38.20 | $36.80 | $38.00 | Green |
| Out-of-stock rate | 8.2% | 9.1% | <7% | Red |
| New outlet activations | 12 | 9 | 15 | Red |
| Planogram compliance | 74% | 72% | 80% | Red |
| Revenue per rep per day | $441 | $418 | $450 | Yellow |
Three metrics in red. The area manager now has a clear agenda for this week's coaching: out-of-stock rate (why are outlets running out? Is it delivery frequency, rep not following up on gaps, or a fill rate issue from the distributor?), new outlet activation (which reps are below activation target? Is the beat designed for activation or only for maintenance?), and planogram compliance (which outlet tiers are non-compliant? Is this a rep issue or an outlet owner resistance issue?).
That conversation is data-driven, specific, and actionable. Compare it to a conversation that starts with "we're at 96% of monthly revenue plan" and you understand why the second conversation produces fewer behavior changes.
Conclusion: KPIs Only Work When They're Visible, Timely, and Connected to Coaching
Building the KPI framework is the easy part. The hard part is making the metrics visible to the people who can change them (field supervisors and area managers), making them timely enough to allow correction within the same week, and connecting them explicitly to coaching conversations rather than leaving them as numbers in a dashboard nobody looks at.
Territory analytics and sales dashboards are the infrastructure that makes visibility possible. But the dashboard alone doesn't change behavior. It's the area manager's weekly review that connects the out-of-stock rate to a specific rep, to a specific set of outlets, to a specific coaching conversation that happens on Tuesday morning rather than when the monthly revenue report arrives.
The FMCG sales growth model tells you which levers drive revenue. These KPIs are what you track to know whether you're pulling the right levers hard enough, early enough to make a difference.
Frequently Asked Questions about FMCG Sales KPIs and Metrics
What's the difference between numeric and weighted distribution as KPIs?
Numeric distribution measures the percentage of all outlets in the universe that carry at least one of your SKUs. It measures coverage breadth. Weighted distribution measures the percentage of total category sales volume flowing through outlets where your brand is stocked. It measures coverage quality. You can have high numeric distribution but low weighted distribution if you're present in many small outlets but missing the large-volume accounts. Both matter, but weighted distribution is the better proxy for commercial impact.
What is a good order strike rate for FMCG field sales?
Strike rate varies by channel and route type. Urban general trade van sales reps should target 70 to 85%. Pre-sell routes in semi-urban territory typically run 55 to 70%. Modern trade key account reps run 85 to 95% because visits are usually pre-planned and inventory needs are confirmed in advance. What matters more than the absolute number is the trend over time and the gap between your best and worst performers.
Why does secondary vs primary sales ratio matter?
The ratio between distributor sell-out (secondary sales) and manufacturer sell-in (primary sales) is the channel health indicator. When primary consistently exceeds secondary, distributor inventory is building. This can mask a sell-out problem for several months while the primary sales line looks healthy. When it reverses (secondary exceeds primary), the distributor is drawing down stock and may be approaching a supply gap. The ratio should stay within 5 to 10% of 1:1 over rolling 4-week periods for a healthy channel.
How often should FMCG KPIs be reviewed?
Activity metrics (calls per day, strike rate, out-of-stocks flagged) should be reviewed in daily huddles. Operational metrics (execution scores, new outlet activations, strike rate trend, lines per order) should be reviewed weekly at the area manager level. Strategic metrics (weighted distribution, market share, secondary vs primary) should be reviewed monthly. The cadence matters as much as the metrics: weekly visibility on a leading indicator gives the field team time to correct. Monthly visibility only allows you to explain what already happened.
What is distributor stock days and why does it matter?
Distributor stock days measures how many days of selling capacity remain in the distributor's current inventory at the current sell-through rate. Below 7 days risks outlet supply gaps. Above 30 days ties up the distributor's working capital and reduces their willingness to accept incremental orders. The healthy range is typically 10 to 21 days depending on your replenishment cycle. When stock days trend above 30 consistently, primary sales look healthy while secondary sales are stalling, which is the early signal of a channel health problem.
How do you use lines per order as a coaching metric?
Lines per order measures how many distinct SKUs the rep includes in each order. A rep averaging 2.1 lines per order when the portfolio has 8 eligible SKUs for that outlet tier is consistently leaving range-expansion opportunity on the table. The coaching intervention is specific: in the next five visits to Gold-tier accounts, the rep should review the assortment against the outlet's minimum SKU standard and explicitly propose the missing lines. Lines-per-order coaching is often faster to convert into revenue than calls-per-day coaching because it improves the commercial quality of existing visits rather than adding new ones.
What does fill rate below 95% actually cost in commercial terms?
A fill rate of 90%, meaning 10% of what the trade ordered wasn't supplied, translates directly into 10% of ordered volume lost from secondary sales in that cycle. For a distributor ordering $200,000 per month, a 90% fill rate is $20,000 in missed secondary sales every month, before accounting for the downstream effects on outlet service levels, rep credibility, and distributor confidence in the supply chain. Fill rate belongs in the commercial dashboard, not just the supply chain review, because its consequences show up in the field before they show up in the finance report.
Learn More

Senior Implementation Consultant
On this page
- The KPI Architecture: Three Levels of Measurement
- Distribution KPIs
- Execution KPIs
- Productivity KPIs
- Channel KPIs
- The Full KPI Reference Table
- What Review Rhythm Makes KPIs Actually Change Behavior?
- Sample Weekly Scorecard: Area Manager View
- Conclusion: KPIs Only Work When They're Visible, Timely, and Connected to Coaching
- Learn More