Beat and Journey Planning: How to Design Rep Routes That Maximize Coverage and Productivity
Turn this article into takeaways for your work.


Each assistant summarizes the article only for you and suggests best practices for your work.
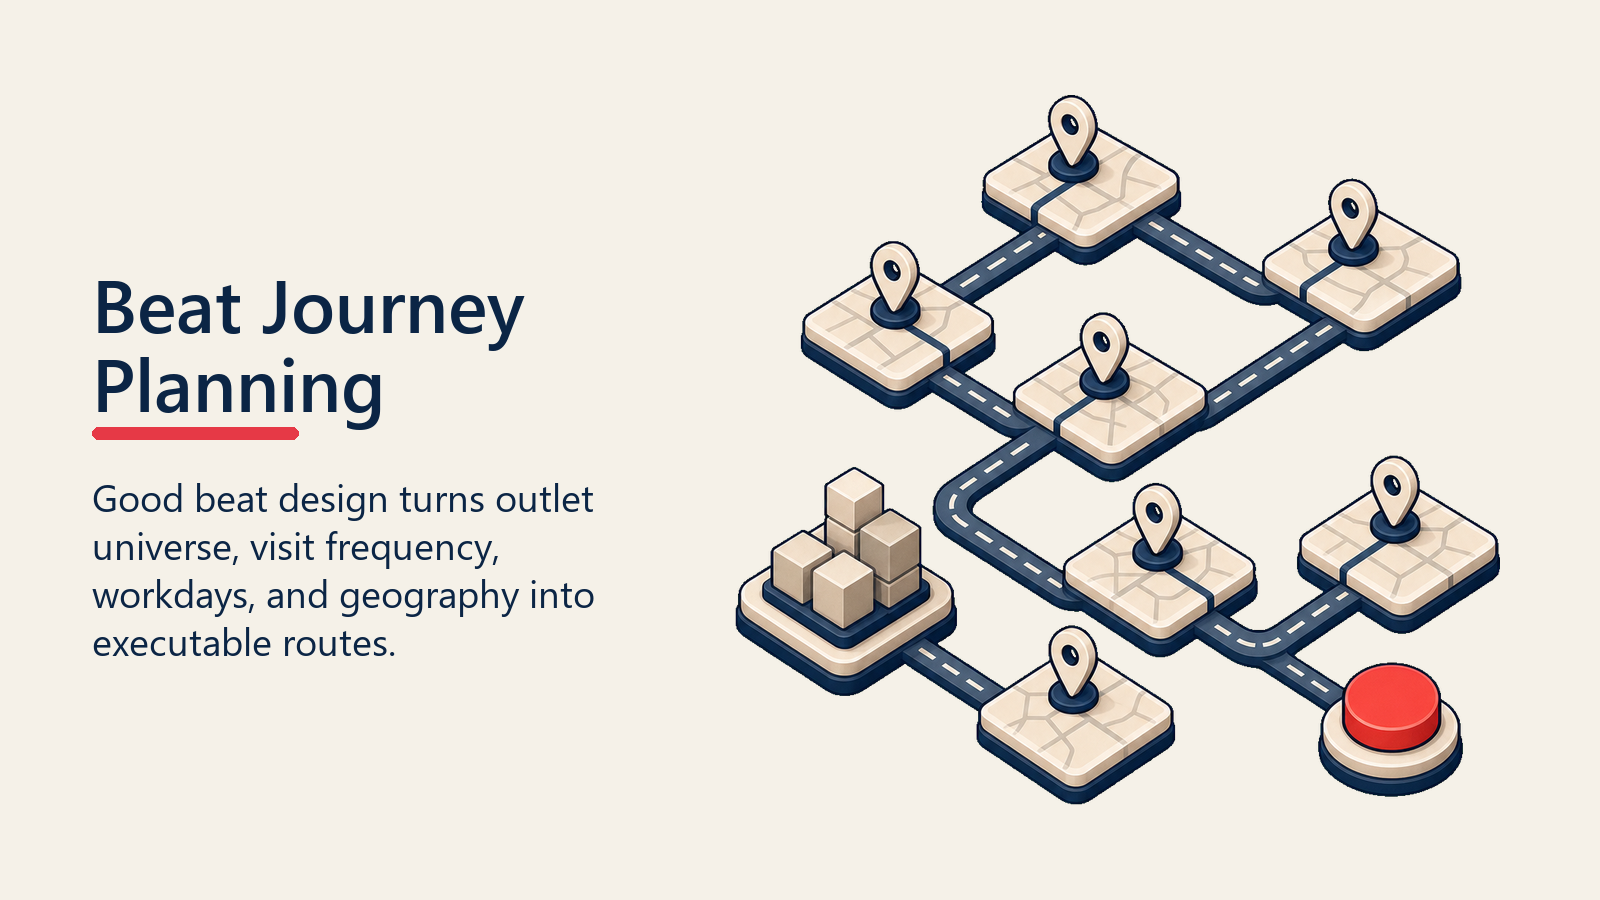
A poorly designed beat costs the company money every single working day. That's not a figure of speech. If a rep's route has them driving across town to visit a low-tier outlet before doubling back to a cluster of high-tier accounts they could have hit in sequence, the wasted travel time is a direct cost. If the beat covers more outlets than a rep can actually visit at the required call standard in a working month, some of those visits aren't happening. If the beat ignores call frequency requirements and leaves Diamond accounts going three weeks between visits, volume is leaking at the exact accounts where it matters most.
Beat design is an engineering problem. It has inputs (outlet universe, tier-based frequency standards, available working days, geography), a design process (sequencing, capacity checking, load balancing), and measurable outputs (journey plan adherence, coverage rate, call-to-order productivity). Area managers who treat it as an administrative task produce routes by intuition or legacy habit. They leave productivity on the table at a cost that compounds across every rep in every territory.
What a Beat Is
Before designing one, it helps to be precise about what a beat actually is, because the terms get used interchangeably in ways that create confusion.
Beat: A defined set of retail outlets assigned to a single rep for regular coverage. The beat is the rep's territory at the outlet level: every outlet the rep is responsible for visiting, maintaining, and selling to. In formal sales management literature, this maps to what is called a sales territory: the customer group or geographic area for which a salesperson holds responsibility, sized and balanced to prevent both under-service and over-service of accounts.
Journey Plan (JP): The sequence and schedule of outlet visits within the beat. A journey plan answers: which outlets does this rep visit on Monday, in what order, and at what time? It takes the beat's outlet list and turns it into an executable daily schedule.
Call Cycle: The repeating time period over which all outlets in the beat are visited at least once. If a rep has a four-week call cycle, every outlet in the beat appears in the journey plan at least once over four weeks. High-frequency tiers appear more often within each cycle.
These three concepts nest together. The beat defines scope. The call cycle defines frequency. The journey plan defines daily execution. Get any of the three wrong and the others break down.
Key Facts: Beat and Journey Planning
- According to FieldAssist's 2026 FMCG field sales productivity benchmarks (FieldAssist is an SFA and retail execution platform), average FMCG field teams spend 45% of working hours on travel and transit versus 35% on in-store selling, with the remaining ~20% on admin and other tasks. High-performing teams improve that split to roughly 25% travel and 55% selling. Route resequencing is the primary lever that closes the gap.
- Journey plan adherence rates below 85% consistently correlate with weaker coverage metrics and lower call-to-order conversion, because reps who deviate from planned routes most often skip the lowest-priority accounts, which accumulate into meaningful coverage gaps over a quarter. (Practitioner benchmark; individual market results vary.)
- Beat redesigns triggered by territory realignment or headcount changes that are not completed within four weeks of the triggering event typically produce two to three months of degraded coverage as reps improvise routes without a formal plan. (Field operations observation; no published academic benchmark available.)
Quotable Nuggets: Beat and Journey Planning
- "A beat that looks reasonable on a spreadsheet can be physically impossible to execute once actual travel distances and traffic patterns are applied." The capacity check step separates a workable beat from an aspirational one.
- Bain's consumer-products commercial excellence practice reports that consumer goods companies that elevate route-to-market planning to a strategic level achieve 2-4 percentage point increases in gross margins alongside coverage efficiency gains, across more than 100 CPG commercial excellence engagements.
- A beat with a load factor above 1.10 (more visits required than capacity allows) will produce systematic visit skipping. The accounts skipped most often are Bronze and Silver accounts that don't flag in any reporting system until they have lapsed entirely.
The Beat Capacity Framework: A load-balancing method that calculates total monthly visit demand per beat (Diamond outlets x 8 + Gold x 4 + Silver x 2 + Bronze x 1), compares it against rep monthly visit capacity (net selling days x target daily visits), and expresses the result as a load factor. A load factor of 0.90-1.00 indicates a healthy beat. Above 1.10, the beat is over-designed and visits will be skipped. Below 0.80, the rep has unused capacity and should carry new outlet acquisition work.
Beat Design Inputs
Beat design starts with four inputs. Treating any of them as approximate produces a beat that will need revision within weeks of launch.

Outlet Universe by Segment and Geography
The starting point is a complete, current outlet list with GPS coordinates and tier classification. Without GPS, beat geography becomes guesswork. Without tier classification, you can't apply differentiated visit frequencies. If your outlet census has gaps, fix them before building beats. See Outlet Universe and Census for how to produce a census-quality outlet database, and Outlet Segmentation and Classification for how to assign tiers before the beat design process starts.
Call Frequency by Outlet Tier
| Tier | Visits per Month | Notes |
|---|---|---|
| Diamond | 8 (twice weekly) | High-frequency; must be protected in any capacity crunch |
| Gold | 4 (weekly) | Standard for most volume-critical accounts |
| Silver | 2 (fortnightly) | Mid-tier; can flex to monthly if capacity is tight |
| Bronze | 1 (monthly) | Minimum coverage; consider indirect service for very low-potential Bronze |
These frequency standards are the input to total monthly visit demand. Multiply outlets per tier by their visit frequency and you get total monthly visits required. That number drives field force sizing and individual beat capacity.
Available Working Days per Rep per Month
Gross working days in the month, minus weekends, public holidays, off-days, and one training day per month, gives net available selling days. In most markets this runs at 20-22 days per month. Some days will be partially absorbed by distributor meetings, area manager ride-alongs, or administrative tasks. Net selling days for field visits typically land at 18-20 per month.
Divide net selling days by the call cycle length to get daily visit targets. A rep with a four-week (20 selling day) call cycle and a beat of 300 outlets should be visiting an average of 15 outlets per day, assuming uniform frequency. With tiered frequency, the calculation gets more complex but the principle is the same: total monthly visit demand divided by available selling days equals daily visit load.
Travel Time and Geography Constraints
This is where beat design most often goes wrong. A beat that looks reasonable on a spreadsheet can be physically impossible to execute once actual travel distances and traffic patterns are applied.
The practical constraint is dwell time. A Diamond visit takes 45-60 minutes. A Bronze visit takes 15-20 minutes. If a rep is visiting 15 outlets per day with a mixed tier composition, the total dwell time might be 5-6 hours. Add a 30-minute lunch break and you have 5.5-6.5 hours of selling time. Total available work hours per day (typically 8-9 in the field) minus dwell time gives the available travel time budget: roughly 2.5-3 hours per day for all travel combined.
If the beat's outlets can't be visited at their required frequency within a travel time budget of 2.5-3 hours per day, the beat is over-loaded. Either headcount needs to increase, outlet count needs to decrease, or frequency standards need to be revised. This is the capacity check that most beat designs skip, which is why so many beats are theoretically executable and practically impossible.
The Design Sequence
Building a beat follows a defined sequence. Skipping steps leads to beats that fail the capacity check after launch, forcing a redesign with disruptive rep reassignments.
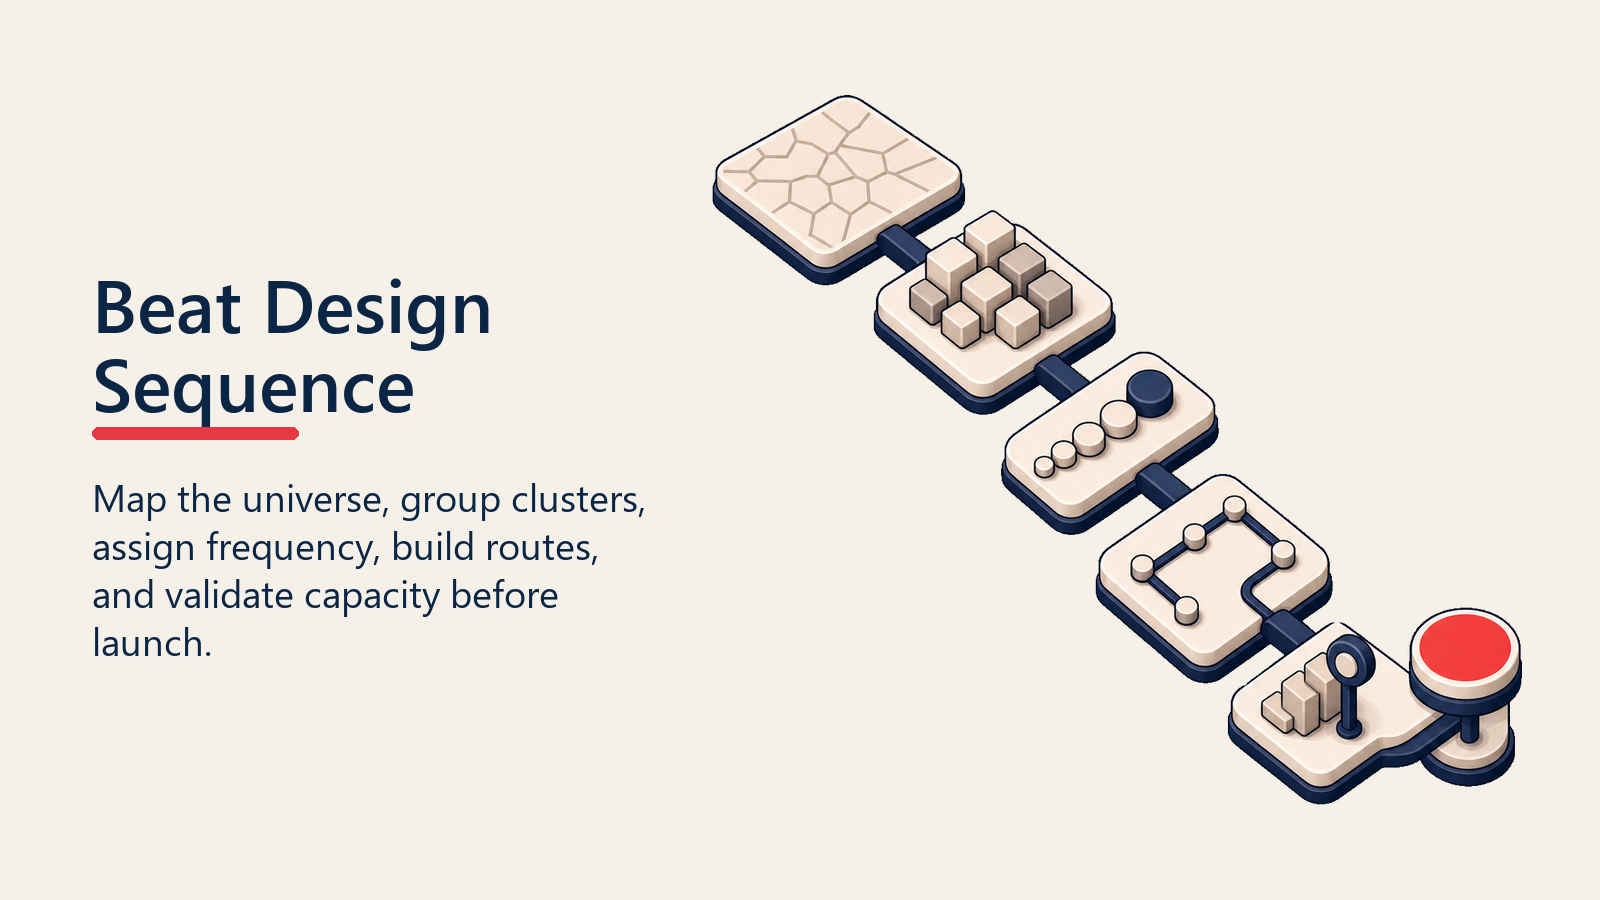
Step 1: Map the outlet universe Plot all outlets in the territory by GPS. Group them visually by geographic cluster. Clusters that form naturally usually correspond to market areas, street grids, or commercial zones. These clusters are the building blocks of beat geography.
Step 2: Apply frequency weights Colour-code the map by tier. Diamond and Gold outlets should drive the geographic anchors of each beat: high-value clusters should sit at the centre of a beat, not on the periphery, so the rep reaches them early in each day rather than late when time pressure builds.
Step 3: Assign outlets to beat clusters Group outlets into beats such that each beat has a manageable geographic footprint and a volume of visit demand that fits within one rep's monthly capacity. At this stage, don't worry about daily sequence. You're allocating outlets to beat pools, not scheduling visit days.
Step 4: Sequence the daily journey plan Within each beat, sequence the daily route to minimise travel distance. The classic approach is a milk-run pattern: start at the point farthest from the depot or start-of-day location, spiral back toward the endpoint, and avoid backtracking. Cluster visits within small geographic zones before moving to the next zone.
In practice, perfect optimisation isn't the goal. A plan that's 85% optimal and executable without Sales Force Automation (SFA) navigation is more valuable than a theoretically perfect route reps can't follow unaided.
Step 5: Build the call cycle schedule Assign each outlet to specific days and weeks within the four-week cycle. Diamond outlets appear twice per week on fixed days. Gold weekly. Silver fortnightly. Bronze monthly. Distribute load evenly across working days so Monday and Friday aren't systematically lighter than midweek.
Capacity Check
Before finalising a beat design, run the capacity check. This is the step that separates a workable beat from an aspirational one.
Total monthly visit demand per beat: (Diamond outlets x 8) + (Gold outlets x 4) + (Silver outlets x 2) + (Bronze outlets x 1) = total monthly visits required
Rep monthly visit capacity: Net selling days per month x target daily visits = total monthly visits available
The target daily visit count comes from dwell time analysis: how long does an average visit take (weighted by tier mix), and how many such visits can fit into a day after accounting for travel?
Capacity ratio: (Total monthly visits required) / (Total monthly visits available) = load factor
A load factor of 0.90-1.00 is healthy: the beat is fully utilised but not overloaded. A load factor above 1.10 means the beat is over-designed and visits will be skipped. Below 0.80 means the beat is under-loaded and either more outlets should be added or the rep has capacity to take on new outlet acquisition work.
Here's a worked example: a beat with 15 Diamond, 60 Gold, 120 Silver, and 90 Bronze outlets requires (15x8) + (60x4) + (120x2) + (90x1) = 690 total monthly visits. A rep with 20 selling days and 15 calls per day can execute 300 visits per month. That's a severe over-load ratio of 2.3. The beat needs to be split or the frequency standards revised. Run this check before launch, not after.
Beat Workload Balancing
When designing multiple beats across an area, uneven workload distribution creates resentment, turnover risk, and coverage inconsistency. A rep carrying 400 monthly visit equivalents while the rep in the next territory carries 250 will burn out, skip visits, or leave.
Balance beat workloads by:
- Ensuring each beat has a similar load factor (not just a similar outlet count)
- Distributing Diamond and Gold outlets proportionally, not concentrating them in one rep's territory
- Factoring travel geography: a territory with the same outlet count but more dispersed geography has a higher effective load than a dense urban territory
After an initial design, compare load factors across all beats in the area. If variance is above 15%, rebalance by moving outlets between adjacent beats before assigning reps. That workload balancing is what the gross-margin gains noted by Bain's commercial excellence practice depend on: route-to-market planning only elevates to strategic level when beats are properly balanced, not just designed. See Field Force Sizing and Structure for how beat count and rep count interact at the area level.
Journey Plan Adherence
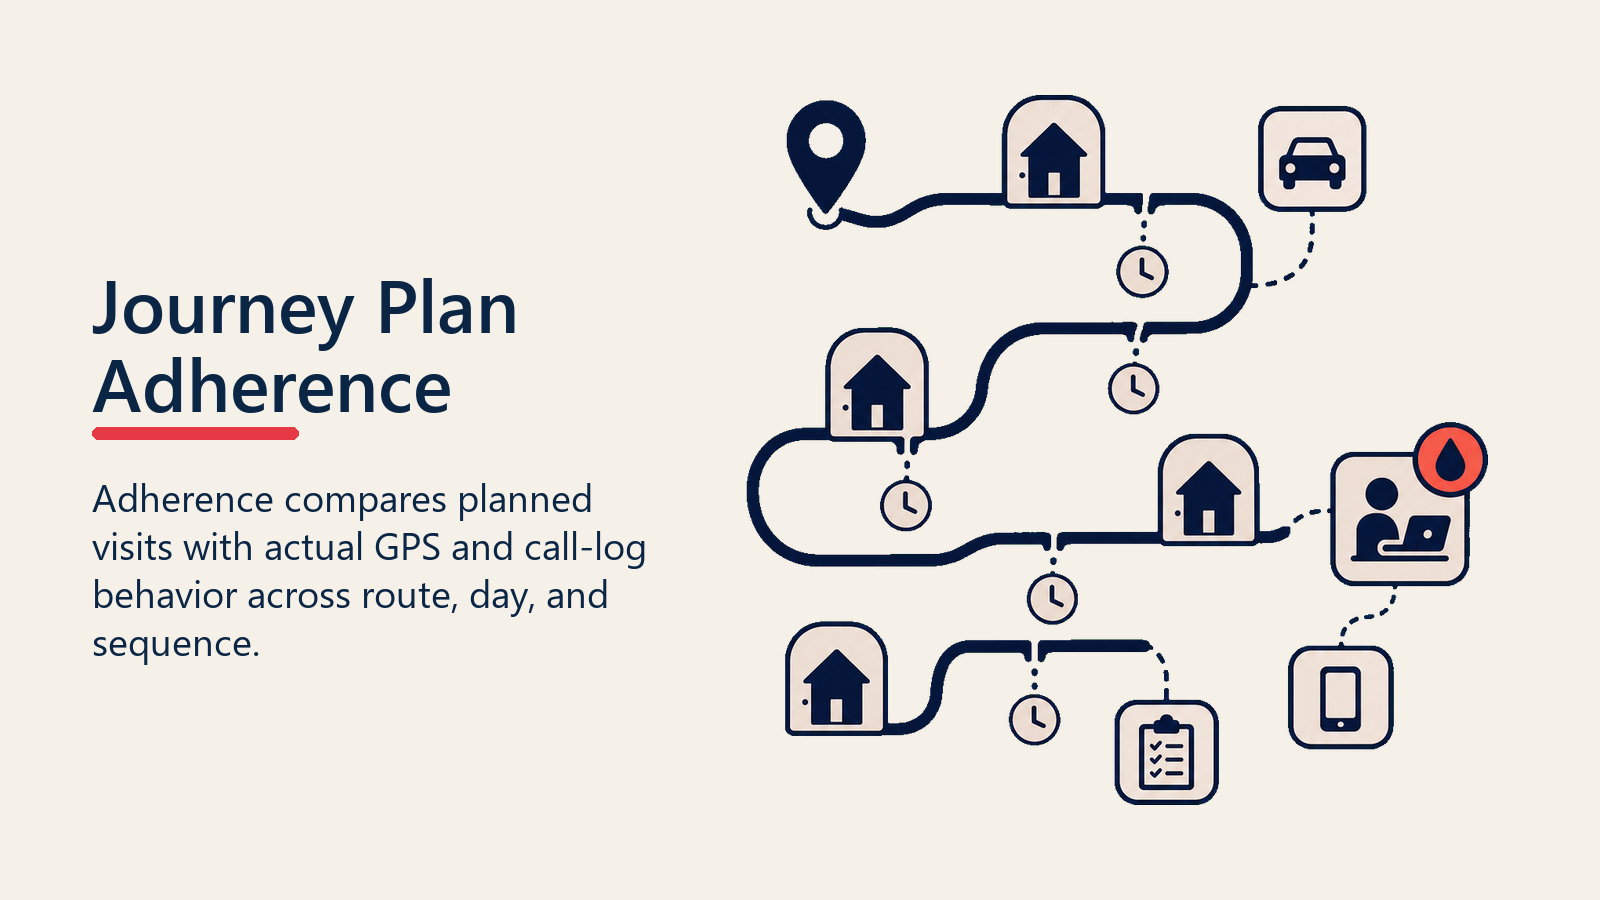
A well-designed journey plan only delivers value if reps follow it. Journey plan adherence is the measure of how closely actual visit patterns match the planned schedule.
What to measure:
- Outlet visit compliance: did the rep visit the planned outlets on the planned day?
- Visit sequence compliance: did the rep follow the planned route order, or did they sequence visits in a way that added travel time?
- Visit time compliance: for Diamond and Gold outlets, did the rep arrive within a reasonable window of the planned visit time?
How to measure it: SFA GPS data is the primary source. Modern SFA platforms log the GPS coordinates and timestamp of every call record. Matching call records against the journey plan schedule (planned day, planned outlet) gives a compliance percentage at the individual and aggregate level.
Track adherence weekly, not monthly. A rep who is 60% compliant in week one of a four-week cycle has time to recover if the issue is caught early. Monthly review means by the time you see the problem, half the cycle has already been lost.
Adherence benchmarks:
| Adherence Rate | Interpretation |
|---|---|
| 90-100% | Excellent; beat design is executable and rep is disciplined |
| 80-90% | Good; minor deviations typically weather or emergency-related |
| 70-80% | Needs attention; likely beat design issues or rep capacity problems |
| Below 70% | Beat redesign required; current design is not executable |
When adherence drops below 80%, the first question is whether it's a rep behaviour issue or a beat design issue. A rep who deviates because the route is physically impossible isn't a compliance problem; the beat is a design problem. SFA and Distributor Management Systems covers how to use SFA data to distinguish genuine route deviation from design-forced deviation.
Beat Review Cycle
Beats aren't designed once and left unchanged. Three events require a formal beat review immediately, not at the next quarterly cycle:
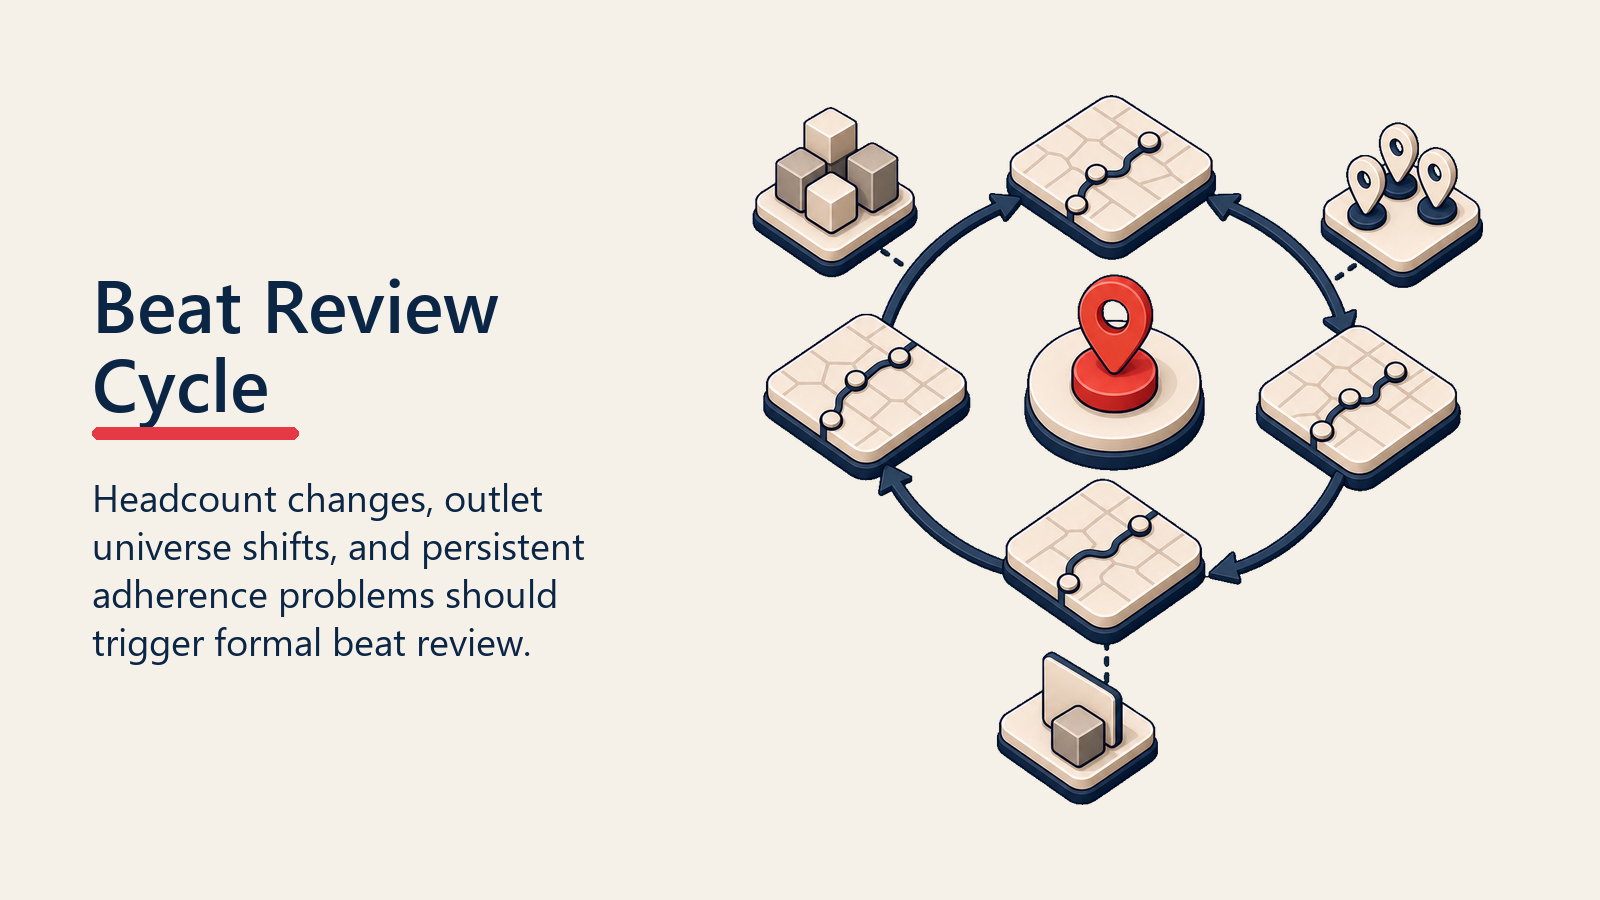
Headcount change: When a rep joins or leaves, the affected territory's beats need immediate redesign, within two weeks, not a temporary patchwork of informally redistributed outlets. Run the design process: count the outlets, check load capacity, build a new journey plan.
Territory realignment: When area boundaries change or new areas are created, beat boundaries shift. Outlets near the boundary need deliberate reassignment, not default to habit.
Outlet census update: When a census refresh adds or removes significant numbers of outlets, the affected beats need recalibration. Adding 200 new outlets to a territory without adjusting beats means those outlets are covered only incidentally, not systematically.
Beyond event-triggered reviews, run a scheduled beat health check every six months: review load factors, adherence rates, and coverage metrics for each beat, and address chronically over-loaded or under-adhered beats before they become performance problems.
The Beat and Route Journey Planning framework from pharmaceutical field sales offers direct parallels: the design logic is structurally similar to FMCG beat design, with the same capacity constraints and the same trade-off between geographic efficiency and call frequency compliance. For territory routing principles, Territory-Based Routing covers geographic assignment logic applicable across B2B and FMCG field operations.
Frequently Asked Questions about Beat and Journey Planning
What is a beat in FMCG field sales?
A beat is the defined set of retail outlets assigned to a single rep for regular coverage. It is the rep's territory at the outlet level: every outlet the rep is responsible for visiting, maintaining, and selling to. A beat differs from a journey plan (the scheduled sequence of daily visits within the beat) and a call cycle (the repeating time period over which all outlets are visited at least once). The three nest together: the beat defines scope, the call cycle defines frequency, and the journey plan defines daily execution.
How many outlets should a rep's beat contain?
Beat size depends on outlet tier mix and dwell time, not a universal number. The right answer comes from the Beat Capacity Framework: calculate total monthly visit demand by multiplying each tier's outlet count by its required visit frequency, then divide by the rep's monthly visit capacity (net selling days x target daily calls). A beat where visit demand exceeds capacity by more than 10% is over-designed and will produce systematic visit skipping. A common starting point for a mixed-tier traditional trade beat is 250-350 outlets per rep, but this varies widely by geography and tier composition.
What is journey plan adherence and what's a healthy rate?
Journey plan adherence is the percentage of planned outlet visits a rep actually completes on the scheduled day, measured from SFA GPS and call log data. A rate of 90% or above indicates a well-designed, executable beat and a disciplined rep. Rates between 70-80% usually signal a design problem (the beat is over-loaded or geographically impractical) rather than a behavior problem. Rates below 70% require a formal beat redesign: the current route is not executable at the planned frequency.
How do you balance workload across multiple beats in an area?
Compare load factors across all beats after the initial design. If variance in load factors exceeds 15% between the lightest and heaviest beats, rebalance by moving boundary outlets from over-loaded to under-loaded beats before assigning reps. Key principle: distribute Diamond and Gold accounts proportionally, not concentrated in one rep's territory. Factor geography: a sparse rural territory with the same outlet count as a dense urban territory carries a materially higher effective load due to travel time.
When should a beat be redesigned versus adjusted?
Adjustment (moving individual outlets between beats or modifying the daily sequence) is appropriate when load factors are sound and adherence is strong but minor routing inefficiencies appear. Redesign is required when: a rep joins or leaves, territory boundaries change, a census update adds or removes more than 10-15% of outlets in a beat, or adherence rates drop below 70% and the root cause is confirmed as beat design rather than rep behavior. A beat that hasn't been formally reviewed in 12 or more months should be treated as a redesign candidate regardless of whether a specific trigger event has occurred.
What SFA data is most useful for beat health monitoring?
Three metrics from SFA GPS and call logs: (1) actual visit count per outlet versus the tier frequency standard, which immediately surfaces over-served and under-served accounts; (2) journey plan adherence by rep and beat, which distinguishes design problems from behavior problems; (3) average dwell time per outlet by tier, which reveals whether the allocated call time in the beat matches the actual time reps need to complete the structured call steps. All three should be reviewed weekly for the area manager and monthly in aggregate for the sales director.
Learn More
For FMCG area managers and sales directors building or rebuilding their beat and journey planning capability, these resources connect beat design to the broader field sales execution framework:
- Outlet Segmentation and Classification - tier-based frequency standards that drive beat capacity calculations
- Coverage and Frequency Optimization - translating frequency standards into coverage commitments
- FMCG Field Sales Economics - the unit economics of a well- and poorly-designed beat
- Field Force Sizing and Structure - how beat count and rep count are calibrated together
- SFA and Distributor Management Systems - using SFA GPS data to measure journey plan adherence
- Territory-Based Routing - geographic assignment principles for field force territory design
- Beat and Route Journey Planning - pharmaceutical field sales beat design framework with parallel methodology

Senior Implementation Consultant