New Product Launch and Distribution Build: The Field Execution Playbook for FMCG
Turn this article into takeaways for your work.


Each assistant summarizes the article only for you and suggests best practices for your work.
Marketing builds the product. The field sales team builds the distribution. And in most FMCG companies, the second job is where new products actually die.
A new SKU (stock keeping unit, the individual product code trade teams track) can pass every consumer test, clear every trade marketing review, and still fail commercially because it never got listed in enough outlets to reach the shopper. Distribution build isn't a formality that happens after launch. It's the launch. Everything else, the packaging, the ad spend, the influencer campaign, only pays off if a shopper can find the product on a shelf near them.
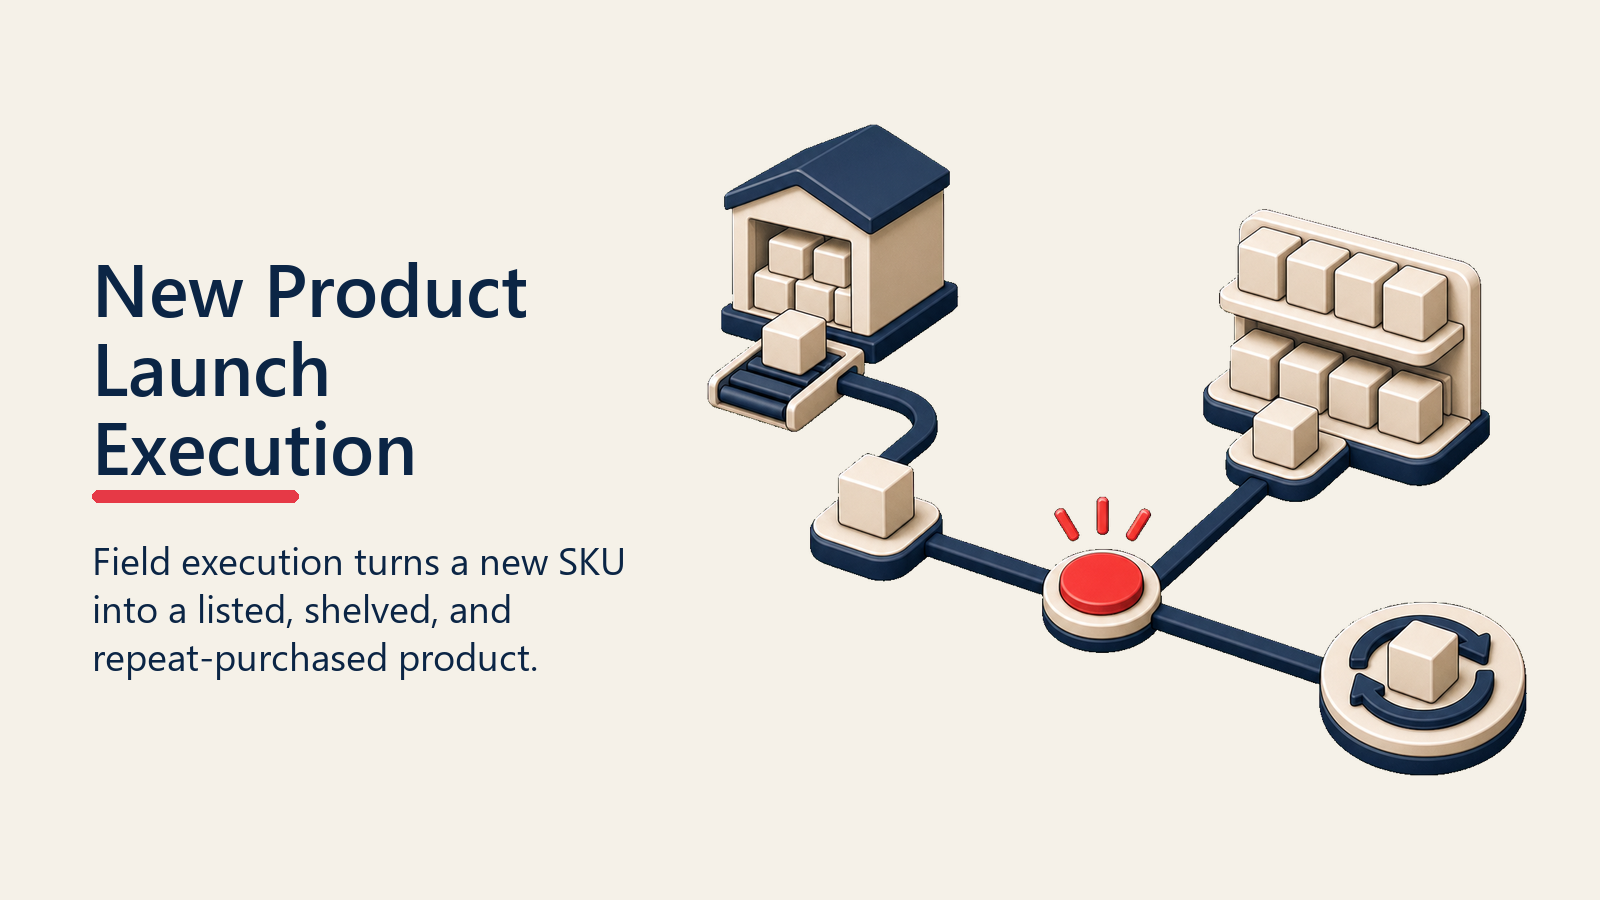
This article covers the mechanics of turning a new product from a warehouse SKU into a distributed, shelved, and repeat-purchased item: pre-launch readiness, the listing sequence, launch-week execution, and the 90-day window where most launches actually succeed or fail.
Why Most New FMCG Products Fail at the Shelf, Not in the Market
Industry estimates commonly cited in CPG innovation research put new product failure rates at 70-80%, a figure repeated widely enough across trade-marketing sources that it should be read as a directional benchmark rather than a single definitive study result. Harvard Business Review's analysis of why product launches fail makes a related point worth applying to distribution specifically: companies routinely skip the validation work needed to know whether a product is actually ready, and the same shortcut happens on the go-to-market side when a launch date gets set before the field team has a structured pitch, trade terms, and POS material in hand. A product that tastes fine, is priced reasonably, and has a clear positioning still fails when the field force can't get it into enough outlets fast enough to build the velocity data that justifies continued trade support.
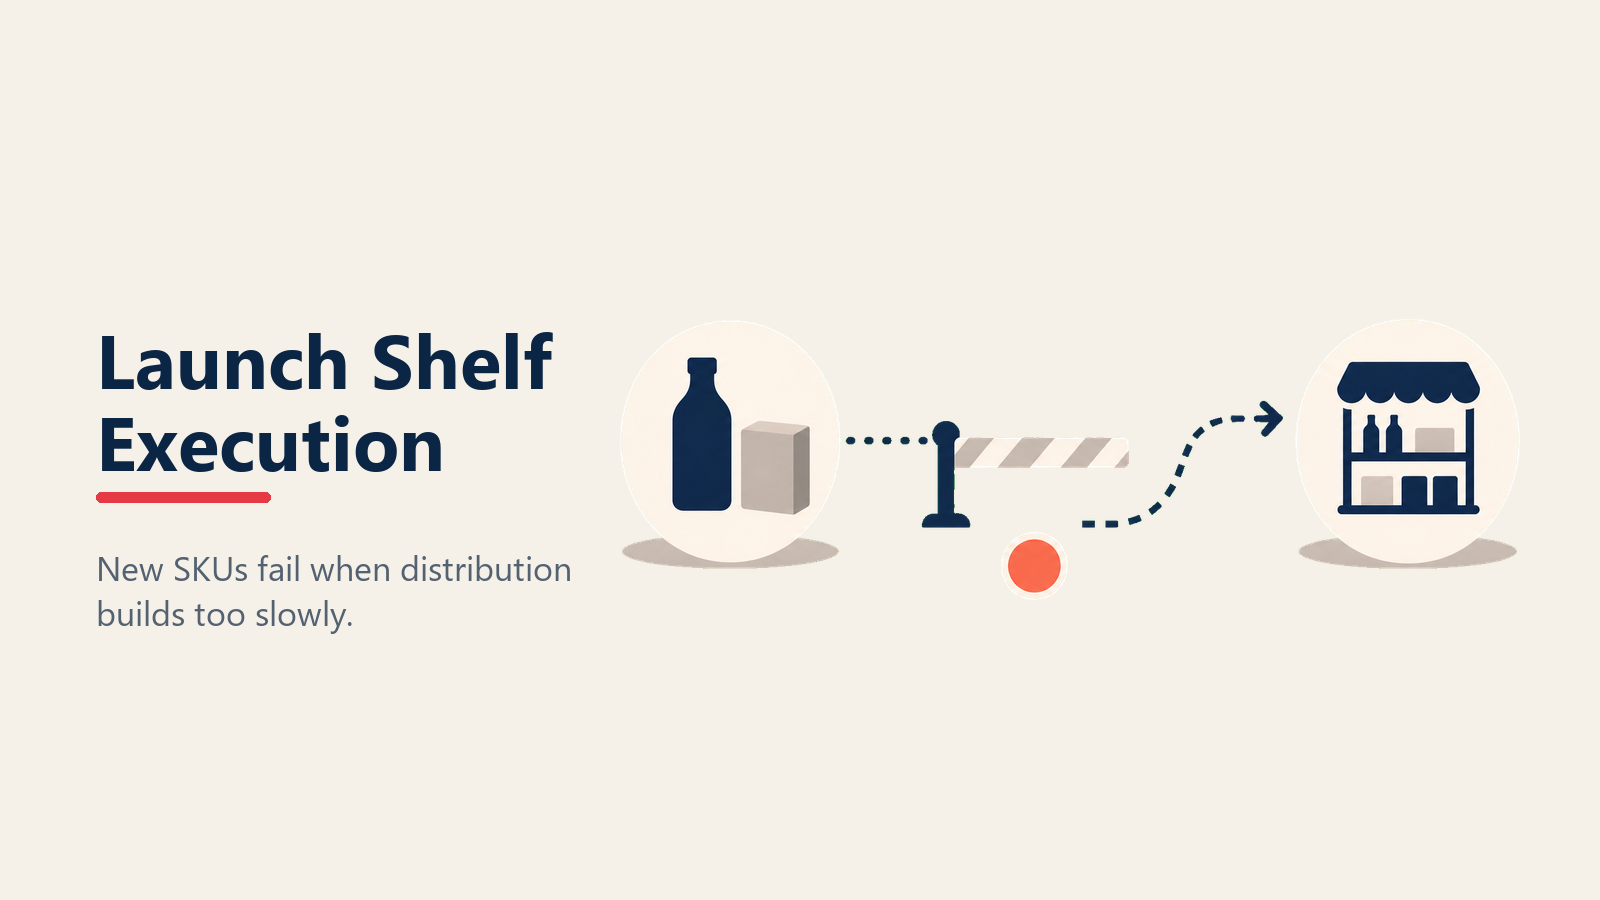
The failure pattern looks like this: marketing sets an ambitious listing target. The sales team, already carrying a full call plan and existing SKU targets, treats the launch as one more item to pitch during the regular call. Reps mention the new product, but don't have a structured pitch, don't know the trade terms, and don't have point-of-sale material ready. Distribution builds slowly over 8-10 weeks instead of the 2-3 weeks the launch plan assumed. By the time meaningful distribution is achieved, the marketing spend window has closed, and the product enters a slow decline before it ever had a fair shot at repeat purchase.
The fix isn't more marketing spend. It's treating distribution build as its own workstream with its own targets, timeline, and accountability, distinct from business-as-usual selling. And that means giving it a dedicated owner, not folding it into whatever the territory rep already has on their plate this month. See FMCG Sales Growth Model for how distribution build fits into the broader growth framework alongside penetration and frequency.
Key Facts: New Product Launch Execution
- Products that reach 40%+ numeric distribution within the first 3 weeks of launch are, in common trade-marketing practice, associated with meaningfully higher odds of sustained listing after 6 months compared to products that build distribution slowly.
- A launch scorecard tracked weekly during the first 8 weeks catches distribution-build problems while there's still time to course-correct, versus a monthly review that surfaces the problem after the launch window has closed.
- Outlets that stock a new SKU but never receive a second delivery within 30 days are the leading cause of "phantom distribution," where a product is technically listed but functionally unavailable to shoppers.
Pre-Launch Readiness: What the Field Team Needs Before Day One
A launch that starts without field readiness starts behind. Four things need to be in place before the first sales call.
The pitch, reduced to 30 seconds. Reps in general trade get 60-90 seconds of an outlet owner's attention per visit. If the new product pitch requires three minutes to explain, it won't get delivered consistently. Reduce it to what the outlet owner actually needs to hear: what it is, why shoppers will want it, what margin they earn, and what the introductory trade terms are.
Trade terms and the ordering minimum. Reps need to know exactly what they're authorized to offer: introductory pricing, minimum order quantity, any launch-period credit terms, and how long the introductory offer runs. Ambiguity here creates inconsistent commitments across the territory and outlet-owner confusion when terms differ between reps.
Point-of-sale (POS) material, sized to the outlet tier. A large modern-trade format needs different POS material than a small general-trade counter. Have both ready, not a single generic kit that doesn't fit either format well. See In-Store Merchandising and Planograms for how new-SKU shelf placement should integrate into the existing planogram rather than compete against it.
A must-sell mandate with consequences. If the new product is a strategic priority, it needs to be added to the must-sell list with a defined listing target per route, and sales manager review of rep-level compliance. Without a mandate, the new SKU competes for attention against every existing product in the rep's bag and usually loses. See the Must-Sell List and Assortment guide (linked under Learn More) for how to build and enforce this list.
The Listing Sequence: Which Outlets First
Distribution build is faster and more durable when it follows a sequence rather than a flat "sell everywhere at once" instruction. Call this sequence The Proof-Point Cascade: each tier's early wins become the sales argument for the next tier, so momentum compounds instead of resetting with every new outlet conversation.
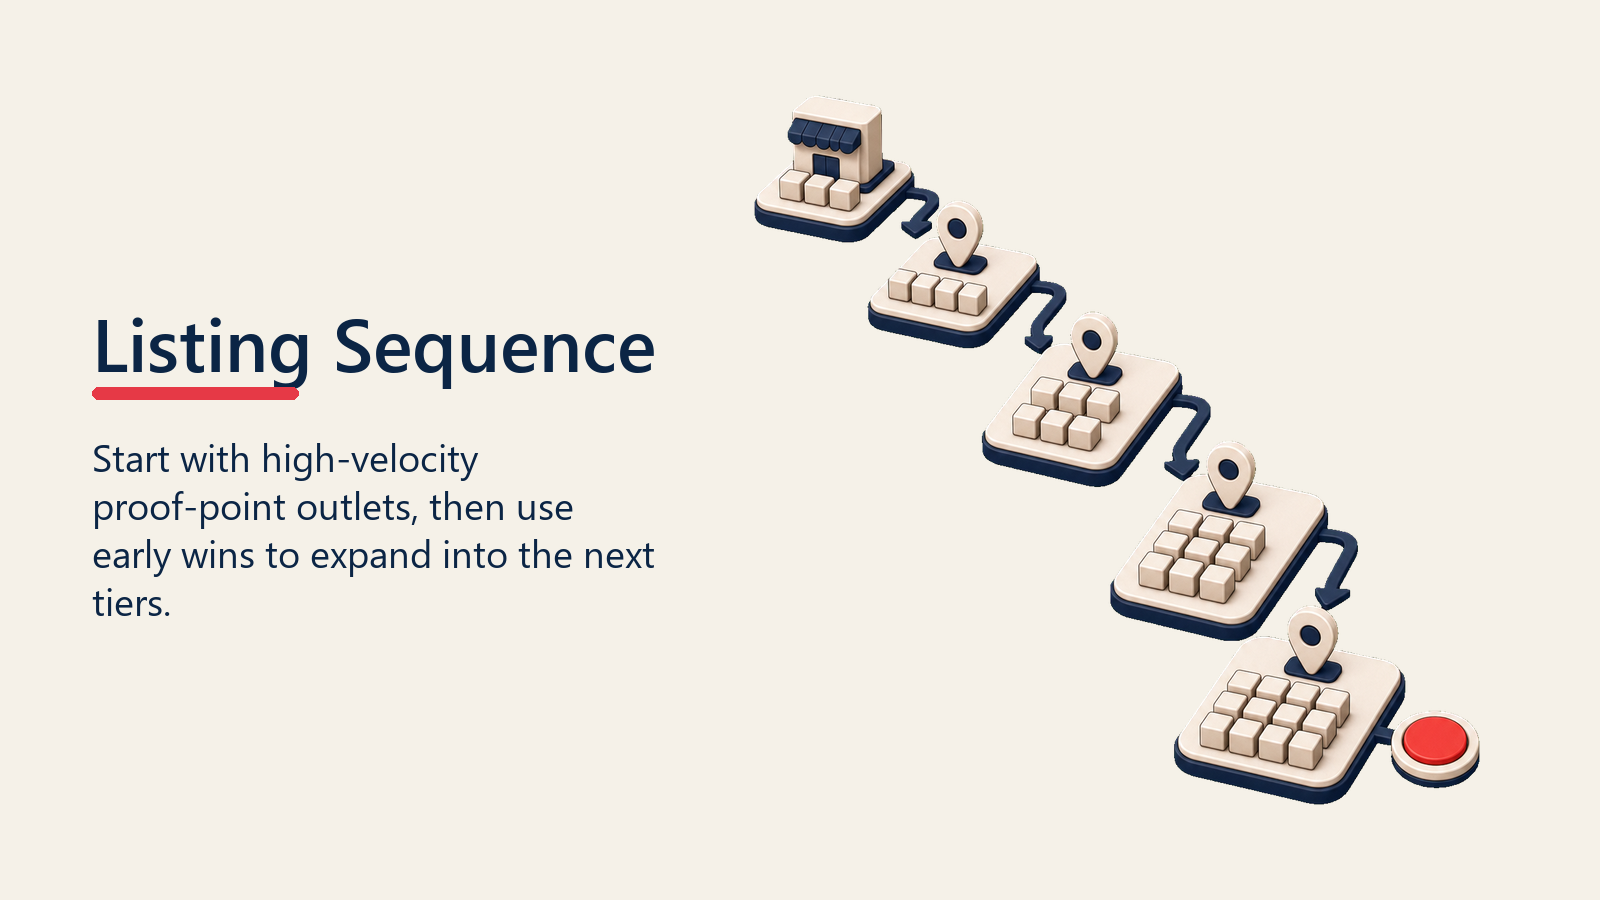
Tier 1: High-velocity outlets in the target consumer segment. Start with outlets that already move high volumes of the category the new product competes in. These outlets have the foot traffic to generate early sales velocity data, which becomes the proof point for the next tier.
Tier 2: Outlets with strong owner relationships. Outlets where the rep has an established relationship convert to a listing faster and are more likely to give the product visible shelf space rather than burying it in a back row. Use these relationships to build momentum in weeks 2-3.
Tier 3: Broad-based distribution across the remaining route. Once tiers 1 and 2 are generating early sales data, use that data as social proof for the broader outlet base: "This is already moving well at three shops on your street." This sequencing gets a stronger initial listing rate than starting broad with no proof points.
Tier 4: Modern trade and key accounts, run in parallel. Modern trade listing decisions run on a separate, longer timeline (category review cycles, headquarters buyer approval) and should be initiated at the same time as general-trade tier 1, not after. See General Trade and Modern Trade eB2B for how the two channels differ in launch cadence.
Launch Sequencing Table
| Week | Focus | Target Outlets | Key Metric |
|---|---|---|---|
| Week 1-2 | Tier 1 high-velocity outlets | Top 20% by category volume | Listing rate, first order size |
| Week 3-4 | Tier 2 relationship outlets | Reps' highest-trust accounts | Listing rate, shelf placement quality |
| Week 5-8 | Tier 3 broad distribution | Remaining route universe | Numeric distribution %, repeat order rate |
| Ongoing | Tier 4 modern trade | Key accounts, chains | Category review outcome, planogram inclusion |
Launch Week Execution: The Checklist
The first week determines whether the launch has momentum or starts flat. Use a structured checklist rather than trusting individual reps to remember every step.
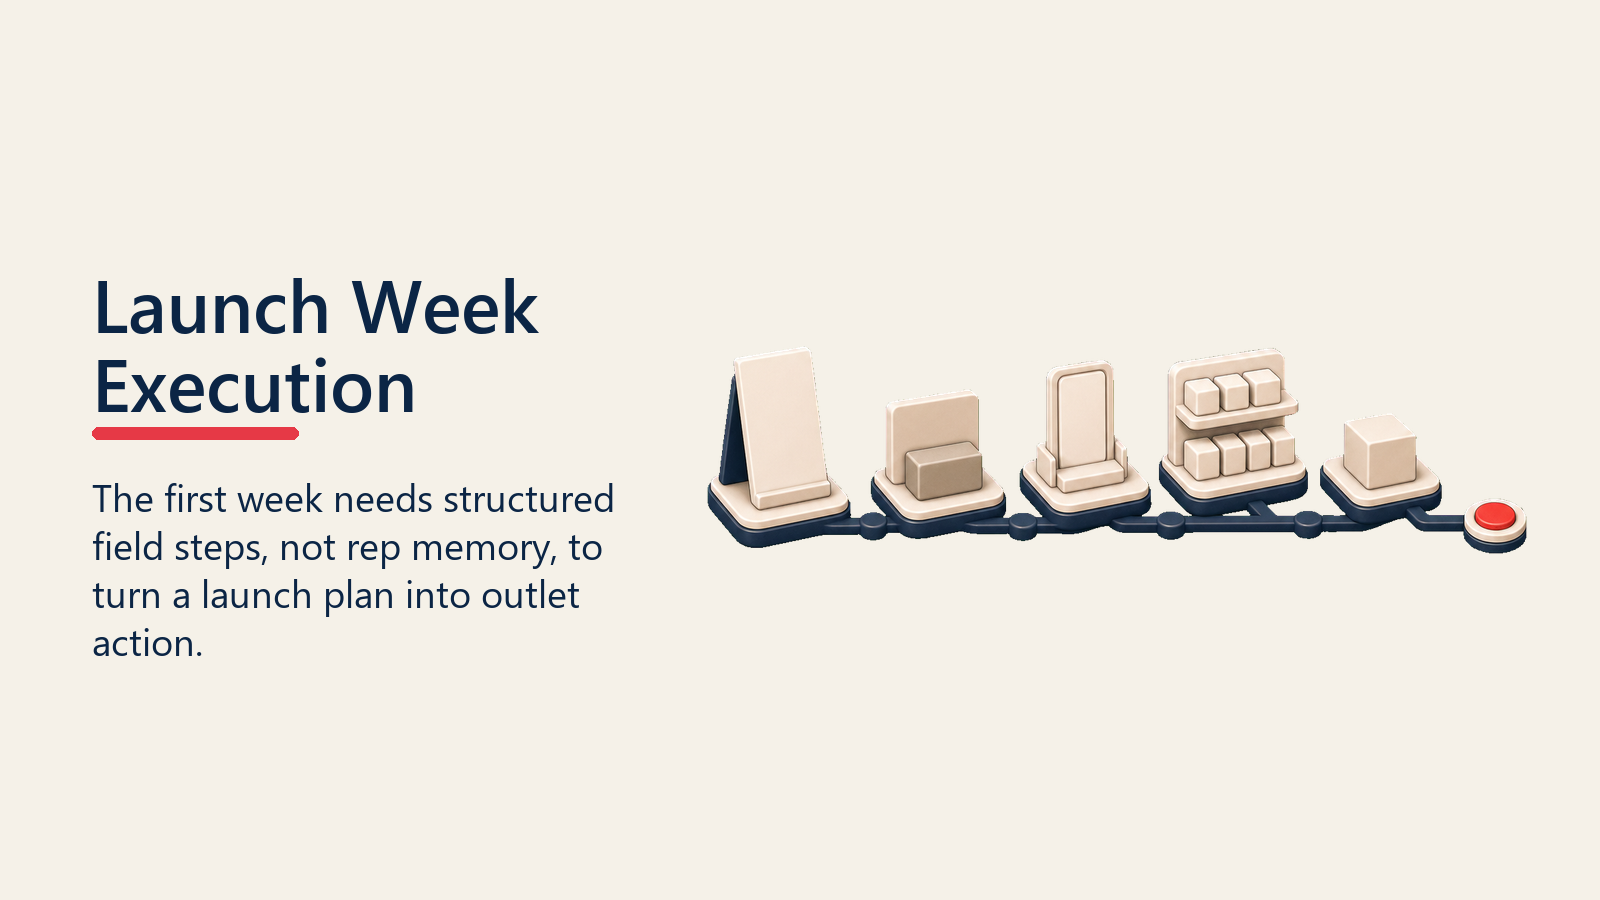
- Every rep has the pitch script and can deliver it without notes
- Every rep has correct trade terms and knows the introductory offer expiry date
- POS material is loaded in the van or bag before the route starts, not requested mid-week
- Sales manager rides with at least 2 reps in week 1 to observe pitch delivery and coach in real time
- Daily listing count is reported by end of day, not aggregated at week end
- Any outlet that declines is logged with a reason code (price, shelf space, no trust in category, other)
- Distributor stock levels are checked daily against the listing rate to prevent early stockouts
- First-week photos of shelf placement are collected for at least 20% of newly listed outlets
That reason-code log matters more than most launch teams realize. If 40% of declines cite "no shelf space," the problem is a merchandising conversation, not a pricing one. If 40% cite price, the trade terms need review before week 3. Skip the reason code and you're just guessing at the fix.
Distribution Velocity Tracking: The 90-Day Window
Numeric distribution alone doesn't tell you if a launch is working. A product can be technically listed in 60% of target outlets and still be failing if half of those outlets never reorder. Track distribution build against three layers.
Numeric distribution. The percentage of target outlets that have the product listed at least once. This is the easiest metric to track and the easiest to inflate through one-time forced sell-in that doesn't reflect real demand.
Weighted distribution. Numeric distribution adjusted for outlet sales volume, so a listing in a high-volume outlet counts more than a listing in a low-volume one. See Numeric and Weighted Distribution for the calculation method. NielsenIQ's research on distribution efficiency frames this the same way: weighted distribution divided by numeric distribution is the efficiency signal that tells you whether a launch is landing in the stores that actually move volume, not just the ones that said yes first.
Repeat order rate. The percentage of outlets that placed a second order within 30 days of the first. This is the metric that separates real distribution from phantom distribution. An outlet that received the product once and never reordered is not distributed; it's a one-time favor to the rep.
90-Day Launch Scorecard
| Metric | Week 4 Target | Week 8 Target | Week 12 Target |
|---|---|---|---|
| Numeric distribution | 35-40% | 55-60% | 70%+ |
| Weighted distribution | 40-45% | 60-65% | 75%+ |
| Repeat order rate | 45%+ | 60%+ | 70%+ |
| Out-of-stock rate at listed outlets | Under 15% | Under 10% | Under 8% |
If repeat order rate is lagging behind numeric distribution at week 8, that's the earliest reliable signal the launch is building phantom distribution rather than real demand. Catch it before the marketing team starts celebrating listing counts that don't mean what they think.
Quotable Nuggets
A product listed in an outlet that never reorders within 30 days isn't distributed, it's a one-time favor to the rep, and that distinction is what separates real distribution from phantom distribution.
Weighted distribution divided by numeric distribution is the efficiency signal that shows whether a launch is landing in the stores that move volume, not just the ones that said yes first, according to NielsenIQ's analysis of product distribution.
How Do You Manage the Distributor Side of a Launch?
A launch fails just as often on the distributor side as the rep side. Distributors need clear stock allocation, not a general instruction to "carry the new SKU."
Set a minimum stock allocation per distributor based on the territory's target listing rate, not the distributor's guess at demand. Distributors under-order new products by default because they carry the inventory risk if it doesn't sell, so the manufacturer needs to either guarantee a return policy for a defined launch window or provide a phased minimum order commitment tied to the launch plan.
Track distributor-level sell-in versus sell-out separately during the launch. A distributor who has bought the launch allocation but isn't moving it to outlets is building the exact phantom distribution problem the repeat-order metric is designed to catch. See Distributor Management and ROI for the broader framework on holding distributors accountable to secondary sales, not just primary sell-in.
Coordinate the launch allocation with existing route planning so vans aren't making special unscheduled trips to deliver the new product outside the normal beat cycle. An off-cycle delivery breaks the delivery rhythm outlets expect and adds cost the launch budget didn't plan for. See Beat and Journey Planning for how to fold a launch SKU into existing routes without disrupting them.
Cross-Functional Coordination: Where Launches Break Down
Most launch failures trace back to a coordination gap between the teams that plan the launch and the team that executes it in the field.
Marketing and sales timeline mismatch. Marketing often plans a launch date based on production readiness and media buy schedules, without confirming the sales team has had time to brief reps, secure trade terms approval, and prepare POS material. Build a minimum 3-week field-readiness runway into every launch calendar, non-negotiable regardless of media timing pressure.
Trade marketing and finance on introductory pricing. Introductory trade terms need finance sign-off before reps commit them in the field. A rep who promises a discount that finance later reverses damages trust with the outlet owner and makes the next launch harder to sell.
Sales leadership visibility during the critical window. The first 4 weeks of a launch need daily or near-daily visibility for the sales director, not the usual monthly review cadence. This is a use case where the discipline of tracking value delivered at each stage, similar to value-based selling frameworks in B2B pipelines (linked under Learn More), applies directly: a launch that isn't showing distribution value week over week needs an intervention before the funding window closes, not after.
Customer success handoff for key accounts. For modern-trade and key accounts, someone needs to own the account relationship after the initial listing win, checking in on sell-through, replenishment, and promotional support. The retention discipline used in B2B account retention work (linked under Learn More), where the real work starts after the deal closes, applies just as much to a newly listed key account as it does to a signed contract.
What Should You Do When a Launch Is Underperforming?
Not every launch that misses week 4 targets is failing. Some are just slow. Use a diagnostic sequence before declaring a launch a failure.
- Check the reason-code log first. If declines cluster around a single objection (price, shelf space, distributor stock), that's a fixable operational issue, not a demand problem.
- Compare weighted distribution to numeric distribution. A large gap means the product is landing in low-volume outlets while missing the high-volume ones that actually move the needle.
- Check repeat order rate before assuming demand is weak. Low repeat orders combined with high initial listing usually means the product isn't moving at shelf, which could be a merchandising, pricing, or genuine demand problem, each requiring a different fix.
- Talk to reps directly, not just the dashboard. Field feedback on the pitch, the trade terms, and outlet owner reactions surfaces problems that aggregate metrics don't show clearly.
- Revisit the negotiation position with distributors before extending timelines. If distributor stock allocation is the constraint, that's a conversation about terms and commitment, following the same discipline used in structured negotiation approaches where you diagnose the actual blocker before making a concession.
Conclusion
A new product launch is won or lost in the field, not in the lab or the boardroom. The companies that consistently succeed with new SKUs treat distribution build as a disciplined workstream: a listing sequence that builds momentum instead of spreading thin, a launch-week checklist that removes ambiguity from the rep's job, and a 90-day scorecard that tracks real demand signals instead of vanity distribution counts.
Marketing creates the reason for a shopper to want the product. Field execution creates the moment where that shopper can actually buy it. Both have to work, but only one of them is usually missing.
Frequently Asked Questions about New Product Launch and Distribution Build
How long should a new FMCG product launch take to reach full distribution?
Most well-executed launches reach 60-70% numeric distribution in target outlets within 8-12 weeks. Products that take longer than 12 weeks to reach meaningful distribution typically lose the marketing support window and enter a slow decline before achieving real market presence. Speed in the first 3-4 weeks matters more than eventual coverage, because early velocity data is what sustains ongoing trade and marketing investment.
What's the difference between numeric distribution and real distribution success?
Numeric distribution counts how many outlets have the product listed at least once. Real distribution success requires repeat orders, meaning the product is actually selling through to shoppers and outlets are reordering. A product with 70% numeric distribution but a 30% repeat order rate has a phantom distribution problem: it's technically everywhere but functionally unavailable because outlets aren't restocking it.
Should reps get a special incentive for new product listings?
Yes, in most cases. New product listings require extra selling effort during an already-full call, and a dedicated incentive (per-listing bonus, contest, or leaderboard) keeps the launch prioritized against existing SKU targets. Structure the incentive to reward listings that convert to repeat orders, not just first-time sell-in, to avoid rewarding phantom distribution.
How do you handle distributors who under-order a new launch SKU?
Set a minimum stock allocation tied to the territory's listing target rather than leaving order quantity to distributor discretion, and consider a limited-window return policy to offset the inventory risk they're taking on an unproven product. Track their sell-in versus sell-out weekly during the launch window and address any distributor who is buying the allocation but not moving it to outlets before the gap becomes a stockout risk.
What should happen if a launch misses its distribution targets at week 8?
Run the diagnostic sequence before assuming failure: check the reason-code log for declines, compare weighted to numeric distribution, check repeat order rates, and talk to reps directly about pitch and trade term friction. Most underperforming launches have a specific, fixable operational cause rather than a fundamental demand problem, but that cause needs to be identified within the first 8-10 weeks while there's still time to act on it.
What is the Proof-Point Cascade in a product launch sequence?
The Proof-Point Cascade is a listing sequence that starts with high-velocity outlets, then moves to relationship outlets, then uses the early sales data from both as evidence to convert the broader route. Rather than pitching every outlet cold with the same unproven story, each tier's results become the sales argument for the next, which produces a stronger initial listing rate than a flat "sell everywhere at once" approach.
Learn More

Senior Implementation Consultant
On this page
- Why Most New FMCG Products Fail at the Shelf, Not in the Market
- Pre-Launch Readiness: What the Field Team Needs Before Day One
- The Listing Sequence: Which Outlets First
- Launch Week Execution: The Checklist
- Distribution Velocity Tracking: The 90-Day Window
- How Do You Manage the Distributor Side of a Launch?
- Cross-Functional Coordination: Where Launches Break Down
- What Should You Do When a Launch Is Underperforming?
- Conclusion
- Learn More