AI Productivity ROI Metrics: Measuring the Business Impact of AI Tools
Turn this article into takeaways for your work.
Each assistant summarizes the article only for you and suggests best practices for your work.
Seventy-three percent of companies can't quantify their AI tool ROI. They know people are using the tools. They sense that work is getting done faster. But when the CFO asks "What's this investment actually returning?" they don't have convincing answers.
This measurement gap is dangerous. Without clear ROI data, AI tool investments get cut during budget reviews. Renewals get questioned. Expansion stalls. The tools might be delivering massive value, but if you can't prove it, the value doesn't matter. Before implementing measurement, ensure you've used a sound AI tool selection framework to choose tools worth measuring.
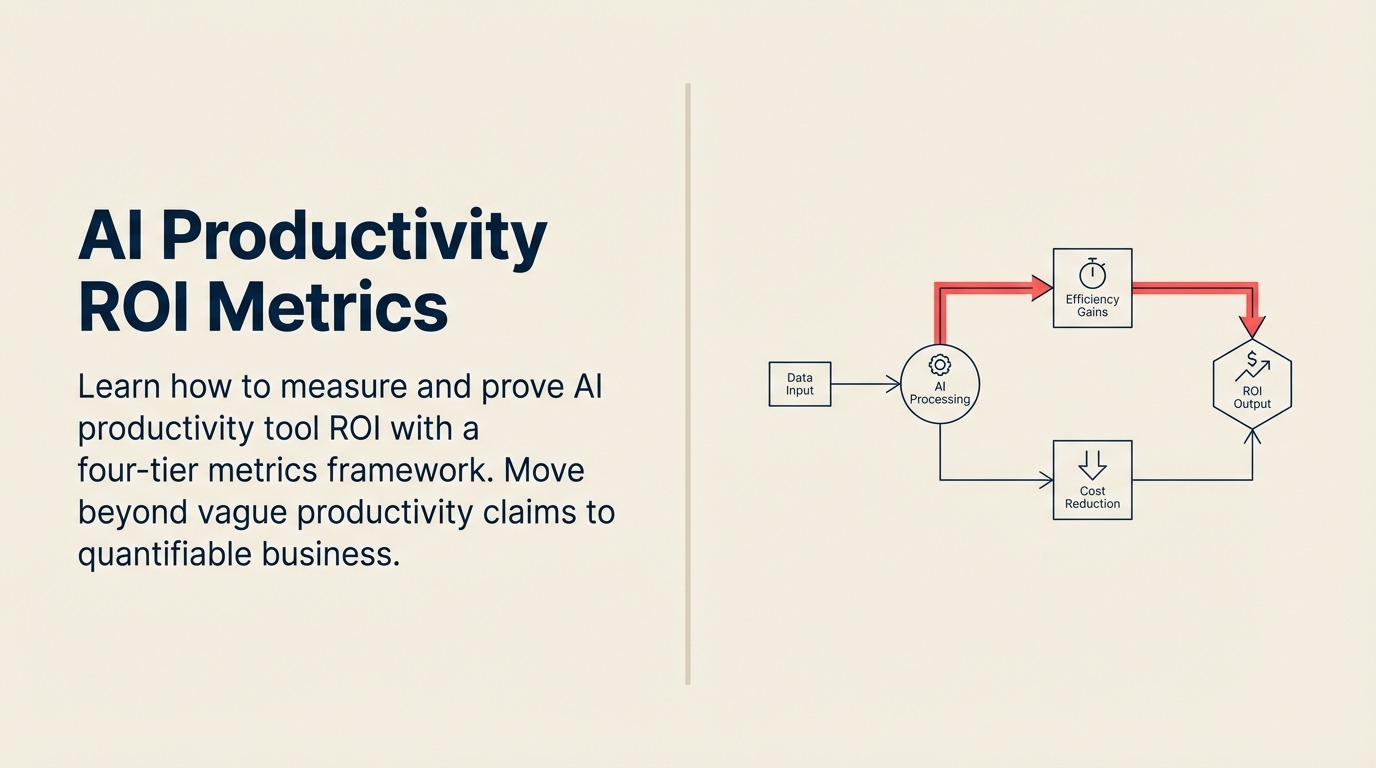
The problem isn't that AI tools don't deliver ROI. It's that traditional productivity measurement approaches don't work for AI. You can't just count hours saved or tasks completed - AI tools change how work happens in ways that simple metrics miss.
You need a different measurement framework. One that captures both direct efficiency gains and harder-to-measure improvements in quality, speed, and capability.
Why Traditional ROI Calculations Fail for AI
Traditional productivity tools are straightforward to measure. Implementation of a new CRM reduces time to generate reports from 2 hours to 30 minutes. That's 1.5 hours saved per report, multiply by report frequency, done.
AI tools don't work that way.
An AI writing assistant doesn't just reduce writing time - it changes what people write, how they approach content creation, and what quality standards are achievable. Measuring just time saved misses most of the value. To understand the full impact, explore how AI content generation tools transform content operations beyond simple efficiency gains.
Similarly, an AI analytics tool doesn't just speed up report creation. It enables questions that were previously too time-consuming to answer. It democratizes analysis to people who couldn't generate insights before. Traditional time-saving metrics can't capture that expanded capability.
The Three Measurement Challenges:
1. Value Distribution is Non-Uniform Ten percent of users might capture 60% of the value. Power users find creative applications that deliver outsized returns. Average users see modest improvements. Traditional per-user ROI calculations mask this distribution and undervalue the tool.
2. Benefits Appear Over Time Initial productivity might actually drop as users learn new workflows. Real value emerges after 60-90 days when AI tools become integrated into daily habits. Measuring too early shows failure; measuring too late misses the learning curve cost.
3. Indirect Benefits Matter Most The biggest value often isn't in time saved but in quality improved, opportunities captured, or risks avoided. These indirect benefits are real but harder to quantify than direct time savings.
The Four-Tier Metrics Framework
Instead of searching for a single ROI number, measure AI tool impact across four tiers. Each tier captures different types of value, and together they provide a complete picture of business impact.
Tier 1: Efficiency Metrics (Direct Time and Error Reduction)
These are the easiest metrics to measure and the foundation of any ROI calculation. They answer the question: "How much faster or more accurate did work become?"
Time Savings Metrics:
- Task completion time (before vs after)
- Hours saved per user per week
- Cycle time reduction for multi-step processes
- Administrative time as percentage of total work time
Accuracy Metrics:
- Error rates in outputs
- Rework frequency
- Correction time required
- Quality assurance pass rates
How to Measure: Establish baseline metrics before implementation. Measure the same activities 30, 60, and 90 days after deployment. Be specific - don't measure "productivity" generally, measure particular tasks or processes.
Example - AI Writing Tool:
- Baseline: 3.5 hours average to create a 2,000-word article
- Post-implementation: 1.8 hours average for equivalent article
- Time saved: 1.7 hours (49% reduction)
- Annual value for 20 content creators: 1,700 hours = $102K (at $60/hour)
This tier provides the clearest ROI but typically underestimates total value by focusing only on direct efficiency.
Tier 2: Effectiveness Metrics (Quality and Decision Improvement)
Efficiency measures how fast work happens. Effectiveness measures how good the work is. For knowledge work, effectiveness improvements often matter more than efficiency gains.
Quality Metrics:
- Customer satisfaction with outputs
- Manager approval rates for deliverables
- Peer review scores
- Customer complaints or corrections requested
Decision Speed and Quality:
- Time from question to decision
- Percentage of decisions made with data vs intuition
- Accuracy of predictions or forecasts
- Confidence levels in recommendations
Output Sophistication:
- Complexity of analysis performed
- Depth of insights generated
- Number of alternatives evaluated
- Comprehensiveness of recommendations
How to Measure: Use qualitative assessment rubrics alongside quantitative metrics. Have managers rate work quality on consistent scales. Track decision outcomes over time to measure prediction accuracy.
Example - AI Analytics Tool:
- Baseline: 12% of operational decisions supported by data analysis
- Post-implementation: 47% of decisions data-supported
- Decision quality: Error rate decreased from 18% to 11%
- Value: Cost of bad decisions decreased by ~$430K annually based on error rate improvement
Tier 3: Business Impact Metrics (Revenue, Cost, and Capacity)
These metrics connect tool usage to business outcomes. They're harder to isolate (AI tools are rarely the only factor) but provide the most compelling ROI story.
Revenue Metrics:
- Sales increase in users with AI tools vs without
- Deal size changes
- Win rate improvements
- Time to close reductions
Cost Metrics:
- Process costs before vs after
- Support ticket volume changes
- Outsourcing or contractor expense changes
- Overtime reduction
Capacity Metrics:
- Work volume handled per person
- Project throughput improvements
- Response time to customers
- Ability to take on new initiatives without headcount
How to Measure: Use control groups when possible. Compare teams using AI tools to similar teams not using them. Track business metrics continuously and look for changes that correlate with AI tool adoption timing.
Example - AI Customer Service Tool:
- Baseline capacity: 28 tickets per agent per day
- Post-implementation: 41 tickets per agent per day
- Capacity increase: 46%
- Business impact: Eliminated need for 6 planned hires = $480K annual savings
- Quality improvement: CSAT score increased from 78% to 84%
Tier 4: Strategic Metrics (Competitive Advantage and Capability Building)
These metrics capture long-term value that doesn't show up in quarterly returns but matters for sustainable competitive advantage.
Competitive Position:
- Time to market vs competitors
- Service response time vs industry standard
- Cost structure vs market average
- Innovation rate (new products/features launched)
Organizational Capability:
- Employee skills developed
- Process maturity improvements
- Data literacy across organization
- Technology adoption capability
Talent Impact:
- Employee retention in roles using AI tools
- Recruitment success (AI capability as differentiator)
- Employee satisfaction and engagement
- Career development and promotion rates
How to Measure: Track these annually or bi-annually. Use competitive benchmarking studies. Survey employees regularly. Monitor talent metrics by team or role to correlate with AI tool access.
Example - Company-Wide AI Implementation:
- Employee retention: 8 percentage points higher in roles with AI tool access
- Recruitment: Time to fill positions decreased 23% when AI tools mentioned in job postings
- Innovation: New product features launched increased 34% year-over-year
- Strategic value: Estimated $2-3M in reduced turnover costs plus faster time-to-market advantage
Metric Examples by Tool Category
Different AI tool categories require different measurement approaches. Here's how to apply the four-tier framework to common tool types.
AI Writing Tools
For comprehensive context on these tools, see AI writing assistants overview.
Tier 1 - Efficiency:
- Content creation time reduction
- Editing cycles required
- Grammar and style error rates
Tier 2 - Effectiveness:
- Content engagement metrics (readability, SEO scores)
- Approval rates from stakeholders
- Brand voice consistency scores
Tier 3 - Business Impact:
- Content output volume increase without headcount
- Marketing qualified leads per piece of content
- Customer engagement with content
Tier 4 - Strategic:
- Content marketing cost per acquisition vs competitors
- Speed of content response to market events
- Content team retention and satisfaction
AI Automation Tools
Tier 1 - Efficiency:
- Process completion time
- Manual intervention frequency
- Error rates in automated processes
Tier 2 - Effectiveness:
- Exception handling accuracy
- Process reliability (uptime/success rate)
- Downstream impact on dependent processes
Tier 3 - Business Impact:
- Cost per transaction processed
- Capacity increase in automated processes
- Redeployment of staff to higher-value work
Tier 4 - Strategic:
- Process scalability without linear cost increase
- Ability to offer new services enabled by automation
- Competitive cost structure advantage
AI Analytics Tools
Tier 1 - Efficiency:
- Time to generate standard reports
- Queries answered per analyst per day
- Data access democratization (% of employees who can query data)
Tier 2 - Effectiveness:
- Decision-making speed
- Accuracy of forecasts and predictions
- Breadth of analysis (questions asked that wouldn't have been previously)
Tier 3 - Business Impact:
- Revenue from data-driven initiatives
- Cost avoidance from early problem detection
- Customer retention improvement from predictive models
Tier 4 - Strategic:
- Data-driven culture adoption
- Competitive differentiation through analytics
- Speed of strategic planning cycles
AI Communication Tools
Tier 1 - Efficiency:
- Meeting time saved through better prep and follow-up
- Email processing time reduction
- Scheduling coordination time eliminated
Tier 2 - Effectiveness:
- Meeting productivity scores
- Email response quality
- Follow-through rates on action items
Tier 3 - Business Impact:
- Meeting hours reclaimed as productive time
- Communication overhead as % of work time
- Project velocity improvement
Tier 4 - Strategic:
- Organizational communication effectiveness
- Remote/hybrid work enablement
- Cross-functional collaboration quality
Baseline Establishment: Measuring Before AI Implementation
You can't measure improvement without knowing where you started. Baseline establishment is the most commonly skipped step - and the most critical for proving ROI.
What to Measure: Identify 5-10 key metrics across multiple tiers before implementation begins. Choose metrics you can consistently track and that reflect the problem you're trying to solve.
How Long to Baseline: Measure for at least 4 weeks before implementation. Longer is better to account for natural variation. Weekly metrics are ideal; daily metrics might show too much noise.
Who to Baseline: Measure both the group that will use AI tools and a control group that won't (if possible). This lets you separate AI tool impact from general improvements or market trends.
What It Looks Like: Create a simple tracking spreadsheet or dashboard. Log the metrics weekly. Calculate averages and ranges. This becomes your comparison point for post-implementation measurement.
ROI Calculation Models
Once you have metrics across tiers, you need to translate them into financial ROI that executives and finance teams understand.
Model 1: Time Value of Employee Method
This is the simplest and most conservative approach.
Formula:
Annual ROI = (Hours Saved per User × Number of Users × Hourly Rate) - Total Cost of Ownership
ROI % = (Annual ROI / Total Cost of Ownership) × 100
Example:
- AI writing tool saves 8 hours per user per week
- 50 users at $60/hour fully loaded cost
- Annual time value: 8 hrs × 50 users × 48 weeks × $60 = $1,152,000
- Tool cost: $100K licensing + $50K implementation = $150K
- Annual ROI: $1,152,000 - $150,000 = $1,002,000 (668% ROI)
This model understates value by ignoring quality improvements and strategic benefits, but it's easy to defend and understand.
Model 2: Cost Avoidance Method
This model values the costs you didn't incur because of the AI tool.
Formula:
Annual ROI = (Costs Avoided) - Total Cost of Ownership
Costs Avoided = Headcount not hired + Outsourcing not needed + Errors not made
Example:
- AI customer service tool handles increased volume without hiring
- Avoided hiring: 4 agents × $80K fully loaded = $320K
- Reduced outsourcing: $120K annually
- Error cost reduction: $45K annually
- Total avoided costs: $485K
- Tool cost: $90K annually
- Annual ROI: $395K (439% ROI)
Model 3: Revenue Impact Method
This model connects AI tool usage to revenue outcomes.
Formula:
Annual ROI = (Revenue Increase Attributable to Tool) - Total Cost of Ownership
Attribution = (Revenue Change × Confidence Factor)
Example:
- AI sales tool implemented in Q2
- Sales team with tool: 15% higher win rate than baseline
- Average deal size: $85K
- Additional deals: 12 per quarter × 4 quarters = 48 deals
- Revenue impact: 48 × $85K × 15% attribution = $612K
- Tool cost: $120K annually
- Annual ROI: $492K (410% ROI)
Be conservative with attribution. AI tools are rarely the sole cause of revenue improvement.
Common Measurement Pitfalls to Avoid
Even with a good framework, measurement can go wrong. Watch for these common mistakes:
Measuring Too Early: Users need time to adapt. Measuring in the first 30 days typically shows poor ROI because learning curve costs outweigh early benefits.
Ignoring Variation: Average metrics hide the reality that some users get massive value while others get little. Report distributions, not just averages.
Confusing Activity with Outcomes: Measuring how often people use an AI tool isn't the same as measuring what they accomplish with it. Focus on outcomes, not usage stats.
Failing to Account for Total Cost: Don't just measure against license costs. Include implementation, training, integration maintenance, and ongoing support in total cost calculations.
Claiming Causation Without Evidence: Business metrics improve for many reasons. Be honest about what you can attribute to AI tools vs other factors.
Optimizing for Easy Metrics: The easiest metric to measure isn't always the most important. Don't skip Tier 2-4 metrics just because they're harder to quantify.
Building Your ROI Dashboard
Executives don't want to dig through spreadsheets. They want a simple dashboard that shows whether the investment is working.
What to Include:
Monthly View:
- Tier 1 metrics: Time saved, errors reduced
- Usage statistics: Active users, frequency
- Support metrics: Tickets, issues, resolution time
Quarterly View:
- Tier 2 metrics: Quality improvements, decision speed
- Tier 3 metrics: Business impact (cost, revenue, capacity)
- ROI calculation: Year-to-date return
Annual View:
- Tier 4 metrics: Strategic impact, capability building
- Trend analysis: How metrics changed over the year
- Competitive benchmarking: How we compare to market
What It Looks Like: Use simple visualizations - line charts for trends, bar charts for comparisons, gauges for targets. Include brief narrative text explaining significant changes. Keep the entire dashboard to 1-2 pages.
Proving Value and Justifying Expansion
Once you've established measurement and shown initial ROI, use the data strategically:
For Renewal Decisions: Show trends over time. Demonstrate that ROI improved as adoption matured. Connect usage patterns to business outcomes.
For Expansion Decisions: Use data from pilot groups to project ROI at scale. Show variation by user type to identify highest-value expansion targets.
For Budget Discussions: Frame AI tool investments as capacity increases, not discretionary spending. Show cost-per-outcome improvements that make the business case clear.
For Stakeholder Communication: Translate metrics into business language. Instead of "reduced email processing time by 3 hours per week," say "reclaimed 156 hours per year per person for strategic work - equivalent to hiring 0.08 FTE per user."
Related Resources
Continue developing your AI measurement capability:
- What are AI Productivity Tools - Core concepts
- AI Tool Selection Framework - How to choose measurable tools
- AI Performance Measurement - Advanced measurement techniques
- AI Tool Cost Management - Complete cost modeling
The companies that win with AI tools aren't the ones that adopt most aggressively. They're the ones that measure most rigorously and use data to optimize their approach over time. Complement your measurement approach with proper AI tool cost management to ensure sustainable ROI as you scale.

Senior Operations & Growth Strategist
On this page
- Why Traditional ROI Calculations Fail for AI
- The Four-Tier Metrics Framework
- Tier 1: Efficiency Metrics (Direct Time and Error Reduction)
- Tier 2: Effectiveness Metrics (Quality and Decision Improvement)
- Tier 3: Business Impact Metrics (Revenue, Cost, and Capacity)
- Tier 4: Strategic Metrics (Competitive Advantage and Capability Building)
- Metric Examples by Tool Category
- AI Writing Tools
- AI Automation Tools
- AI Analytics Tools
- AI Communication Tools
- Baseline Establishment: Measuring Before AI Implementation
- ROI Calculation Models
- Model 1: Time Value of Employee Method
- Model 2: Cost Avoidance Method
- Model 3: Revenue Impact Method
- Common Measurement Pitfalls to Avoid
- Building Your ROI Dashboard
- Proving Value and Justifying Expansion
- Related Resources