Three-Point Estimation (PERT): Formula and Examples
Turn this article into takeaways for your work.
Each assistant summarizes the article only for you and suggests best practices for your work.
Three-point estimation is one of the most practical techniques in a project manager's toolkit. Instead of committing to a single "gut feel" number, it accounts for uncertainty by combining three scenarios -- optimistic, most likely, and pessimistic -- into a single weighted expected duration.
What Is Three-Point Estimation?
Three-point estimation is a scheduling technique that produces a statistically grounded time or cost estimate by averaging three scenario values: the best-case outcome (optimistic), the most probable outcome (most likely), and the worst-case outcome (pessimistic). The result is a single expected value that reflects real-world variability rather than wishful thinking.
The method comes from the program evaluation and review technique (PERT), developed by the U.S. Navy in 1958 to manage the Polaris missile program. PERT's weighted formula was designed for projects with genuine uncertainty -- where past data is scarce and the range of possible outcomes is wide.
Quotable framing: A single-point estimate is a promise dressed up as math. Three-point estimation is math dressed up as a promise -- and it's honest about the difference.
Key Facts
The original PERT network helped the U.S. Navy Polaris missile program complete two years ahead of schedule, cutting its estimated completion time from 1963 to 1961 (Special Projects Office, U.S. Navy, 1958).
A PMI study found that organizations with mature estimation practices (including range-based methods) are 2.5x more likely to complete projects on time and on budget (PMI Pulse of the Profession, 2021).
According to the Standish Group CHAOS Report, poor estimation is a top-three factor in project overruns, cited in over 40% of troubled projects across more than 50,000 project data points.
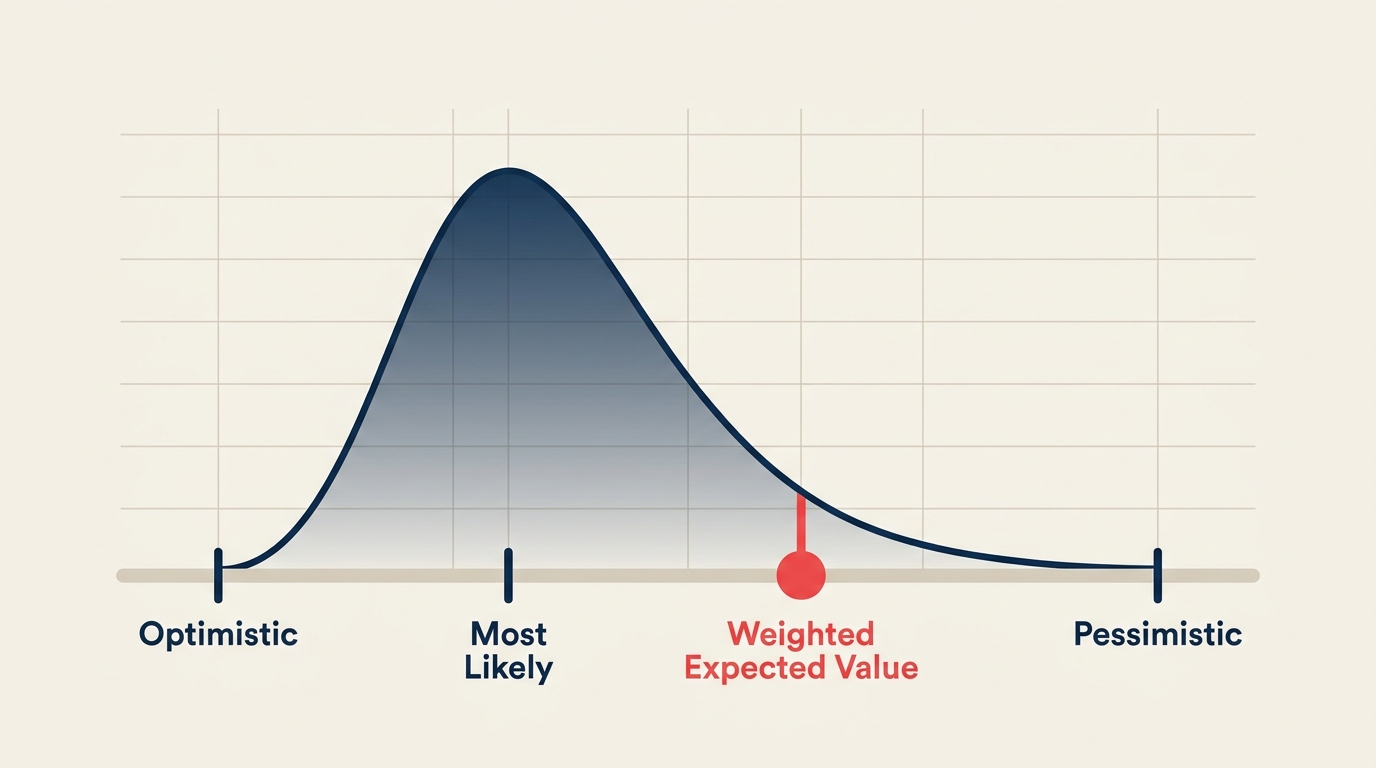
The Three Estimates: Optimistic, Most Likely, Pessimistic
Every three-point estimate starts by defining three duration scenarios for a single task.
| Estimate | Symbol | What it represents |
|---|---|---|
| Optimistic | O | Best-case duration -- everything goes right, no blockers, full resources available |
| Most Likely | M | The realistic duration under normal conditions -- the estimate you'd give if asked once |
| Pessimistic | P | Worst-case duration -- key risks materialize, rework is needed, interruptions occur |
The spread between O and P captures uncertainty. A narrow spread (e.g., O=4, M=5, P=6) signals a well-understood task. A wide spread (e.g., O=3, M=8, P=20) signals high uncertainty and should prompt deeper investigation before the task begins.
When gathering estimates, ask your subject-matter experts for all three values separately. If you ask for O and P first, anchoring bias will distort M. Start with M, then expand outward.
Three-Point Estimation Formulas
There are two standard formulas. Both use the same inputs; they differ in how much weight they give to the most likely estimate.
| Formula | Expression | Gives most weight to |
|---|---|---|
| Triangular (Simple Average) | E = (O + M + P) / 3 | All three equally |
| PERT Beta (Weighted) | E = (O + 4M + P) / 6 | Most likely (4x weight) |
| Standard Deviation (PERT) | SD = (P - O) / 6 | -- (measures spread, not central value) |
When to use triangular: Use the simple average when you have limited historical data, when the three estimates feel equally plausible, or when you want a quick sanity check alongside your PERT value.
When to use PERT beta: Use the weighted formula when the most likely estimate is well-supported by past data or expert consensus. The 4x weighting reflects the assumption (from statistics) that the beta distribution best models task durations -- the most likely outcome dominates, but the tails matter.
Standard deviation tells you how confident you can be in the expected value. A task with SD = 0.5 days is far more predictable than one with SD = 3 days. Once you have SD, you can build confidence intervals:
- 68% confidence: E plus or minus 1 SD
- 95% confidence: E plus or minus 2 SD
- 99.7% confidence: E plus or minus 3 SD
Triangular vs PERT (Beta) Distribution
Both formulas produce similar results when the distribution is symmetric (M sits exactly between O and P). They diverge when M skews toward one end.
| Factor | Triangular | PERT Beta |
|---|---|---|
| Formula | (O + M + P) / 3 | (O + 4M + P) / 6 |
| Weight on M | Equal to O and P | Four times O and P |
| Best for | Low-data environments, quick checks | Expert-supported M, formal scheduling |
| Skew handling | Reflects raw skew directly | Dampens extreme values |
| Used in | Informal estimation, cost modeling | PERT networks, CPM scheduling |
| Standard deviation | Not directly defined | (P - O) / 6 |
In practice, PERT beta is the default choice for project scheduling because it rewards good estimation of the most likely case and dampens the influence of extreme outliers that estimators often add defensively.
How to Do Three-Point Estimation
Step 1: Break the work into tasks
Start with a work breakdown structure (WBS) that divides the project into work packages small enough to estimate reliably. Three-point estimation works at the task level -- not the project level. Estimating a vague "design phase" as a single unit produces unreliable results.
Aim for tasks that take between half a day and two weeks. Anything larger should be decomposed further.
Step 2: Gather O, M, and P for each task
Bring in the people who will actually do the work. Use structured interviews or planning poker to collect estimates independently before discussion. Ask each estimator:
- "If everything went perfectly, how long would this take?" (O)
- "What's your realistic estimate under normal conditions?" (M)
- "If the most likely risks hit at once, how long could this take?" (P)
For tasks with no historical analog, widen the pessimistic value deliberately. Underestimating P is the most common mistake in three-point estimation.
Step 3: Apply the formula
Choose your formula (triangular or PERT beta) and compute E for each task. Keep a record of which formula you used so estimates stay comparable across the project.
For most project scheduling contexts, especially when integrating with a critical path method analysis or a PERT chart, use the PERT beta formula.
Step 4: Compute standard deviation and confidence range
For each task, compute SD = (P - O) / 6. Then set a confidence range:
- Low confidence needed (rough planning): E plus or minus 1 SD
- Medium confidence (committed schedule): E plus or minus 2 SD
- High confidence (contractual or regulatory deadline): E plus or minus 3 SD
For a task with O=3, M=7, P=15: E = (3 + 28 + 15) / 6 = 7.67 days; SD = (15 - 3) / 6 = 2 days. Your 95% range is 3.67 to 11.67 days -- which is honest communication with stakeholders.
Step 5: Roll up to project level
To compute a project-level expected duration, sum the expected values of tasks on the critical path. To compute the project-level standard deviation, use the root sum of squares: SD_project = sqrt(SD12 + SD22 + ... + SDn^2).
This rollup is how PERT connects to network diagram analysis and float and slack calculations.
Worked Example
A software team is estimating three tasks for a feature release. They use the PERT beta formula.
| Task | O (days) | M (days) | P (days) | E = (O+4M+P)/6 | SD = (P-O)/6 | 95% Range |
|---|---|---|---|---|---|---|
| Requirements review | 1 | 2 | 5 | 2.3 | 0.67 | 1.0 to 3.7 |
| Backend development | 3 | 6 | 15 | 7.0 | 2.0 | 3.0 to 11.0 |
| QA and bug fixes | 2 | 4 | 10 | 4.7 | 1.33 | 2.0 to 7.3 |
| Total | 14.0 | 2.42 | 9.1 to 18.9 |
The project-level SD is sqrt(0.672 + 2.02 + 1.33^2) = sqrt(0.45 + 4.0 + 1.77) = sqrt(6.22) = 2.49 days.
This team should communicate a 14-day expected duration with a 95% confidence range of roughly 9 to 19 days -- not "two weeks, definitely."
Benefits and Limitations
| Aspect | Benefits | Limitations |
|---|---|---|
| Accuracy | Reduces optimism bias by forcing a worst-case view | Only as good as the quality of O, M, and P inputs |
| Communication | Gives stakeholders a range, not a false-precision single number | Ranges can make stakeholders uncomfortable -- may require coaching |
| Risk visibility | Wide P-O spread flags high-uncertainty tasks early | Does not tell you why a task is uncertain |
| Integration | Works directly with CPM, PERT charts, and WBS rollups | Adds estimation overhead per task |
| Data needs | Works without historical data -- expert judgment is sufficient | Expert anchoring bias can skew all three values |
| Simplicity | Two formulas, straightforward math | Teams may default to always using PERT and forget to validate M |
Frequently Asked Questions
What is the PERT formula for three-point estimation? The PERT beta formula is E = (O + 4M + P) / 6, where O is the optimistic estimate, M is the most likely estimate, and P is the pessimistic estimate. The factor of 4 gives four times more weight to the most likely value, reflecting the statistical assumption that task durations follow a beta distribution.
What is the difference between PERT and triangular estimation? Both use the same three inputs (O, M, P). Triangular estimation averages them equally: E = (O + M + P) / 3. PERT beta weights the most likely estimate four times more heavily: E = (O + 4M + P) / 6. PERT beta is preferred for formal project scheduling; triangular is faster and better suited to early-stage rough estimates.
Can you use three-point estimation for cost as well as time? Yes. The same formulas apply to cost estimates: replace O, M, and P with best-case, most likely, and worst-case cost figures. The expected cost and standard deviation work identically. Many project managers run parallel time and cost three-point estimates for each work package.
How many tasks should I apply three-point estimation to? Apply it to tasks where uncertainty is meaningful -- typically tasks with durations over a day, tasks on the critical path, or tasks with dependencies that could cascade delays. For very short, well-understood tasks, a single-point estimate is usually sufficient.
What do I do if my subject-matter experts refuse to give pessimistic estimates? This is common. Estimators fear that a high P value becomes a target. Reframe the question: ask "What duration would you put a 10% probability on exceeding?" rather than "What's the worst case?" You can also use historical actuals from similar completed tasks to anchor the P value independently.
For scheduling these estimates across a project network, see PERT chart basics and critical path method. For understanding how float affects task scheduling after you have durations, see float and slack. For building the task hierarchy that feeds three-point estimation, see work breakdown structure and network diagram.

Senior Operations & Growth Strategist
On this page
- What Is Three-Point Estimation?
- Key Facts
- The Three Estimates: Optimistic, Most Likely, Pessimistic
- Three-Point Estimation Formulas
- Triangular vs PERT (Beta) Distribution
- How to Do Three-Point Estimation
- Step 1: Break the work into tasks
- Step 2: Gather O, M, and P for each task
- Step 3: Apply the formula
- Step 4: Compute standard deviation and confidence range
- Step 5: Roll up to project level
- Worked Example
- Benefits and Limitations
- Frequently Asked Questions