Estimativa de Três Pontos (PERT): Fórmula e Exemplos
Turn this article into takeaways for your work.
Each assistant summarizes the article only for you and suggests best practices for your work.
A estimativa de três pontos é uma das técnicas mais práticas no arsenal de um gerente de projetos. Em vez de se comprometer com um único número de "achismo", ela contabiliza a incerteza combinando três cenários (otimista, mais provável e pessimista) em uma única duração esperada ponderada.
O que é estimativa de três pontos?
A estimativa de três pontos é uma técnica de cronograma que produz uma estimativa de tempo ou custo estatisticamente fundamentada, calculando a média de três valores de cenário: o resultado do melhor caso (otimista), o resultado mais provável (mais provável) e o resultado do pior caso (pessimista). O resultado é um único valor esperado que reflete a variabilidade do mundo real em vez de otimismo ingênuo.
O método vem da técnica de avaliação e revisão de programas (PERT), desenvolvida pela Marinha dos EUA em 1958 para gerenciar o programa de mísseis Polaris. A fórmula ponderada do PERT foi projetada para projetos com incerteza genuína, onde dados históricos são escassos e a faixa de resultados possíveis é ampla.
Ideia citável: Uma estimativa de ponto único é uma promessa disfarçada de matemática. A estimativa de três pontos é matemática disfarçada de promessa, e é honesta sobre essa diferença.
Principais Fatos
A rede PERT original ajudou o programa de mísseis Polaris da Marinha dos EUA a concluir dois anos antes do prazo, reduzindo o tempo estimado de conclusão de 1963 para 1961 (Special Projects Office, Marinha dos EUA, 1958).
Um estudo do PMI constatou que organizações com práticas de estimativa maduras (incluindo métodos baseados em faixas) têm 2,5 vezes mais probabilidade de concluir projetos no prazo e dentro do orçamento (PMI Pulse of the Profession, 2021).
Segundo o CHAOS Report do Standish Group, a estimativa ruim é um dos três principais fatores em estouros de prazo de projetos, citada em mais de 40% dos projetos problemáticos entre mais de 50.000 pontos de dados de projetos.
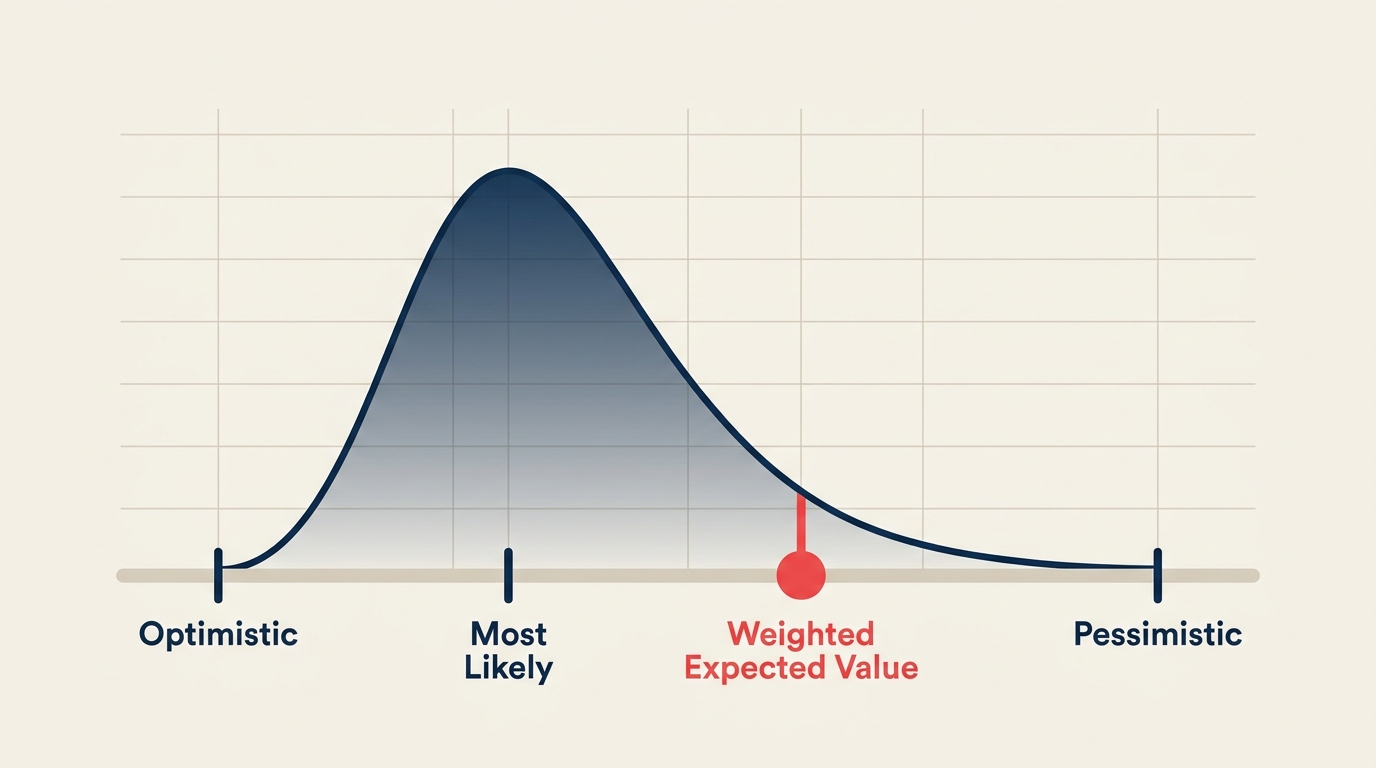
As Três Estimativas: Otimista, Mais Provável, Pessimista
Toda estimativa de três pontos começa definindo três cenários de duração para uma única tarefa.
| Estimativa | Símbolo | O que representa |
|---|---|---|
| Otimista | O | Duração do melhor caso: tudo dá certo, sem bloqueios, recursos totais disponíveis |
| Mais Provável | M | A duração realista em condições normais: a estimativa que você daria se perguntado uma vez |
| Pessimista | P | Duração do pior caso: os principais riscos se materializam, retrabalho é necessário, ocorrem interrupções |
A diferença entre O e P captura a incerteza. Uma diferença estreita (por exemplo, O=4, M=5, P=6) sinaliza uma tarefa bem compreendida. Uma diferença ampla (por exemplo, O=3, M=8, P=20) sinaliza alta incerteza e deve motivar uma investigação mais profunda antes que a tarefa comece.
Ao coletar estimativas, peça aos seus especialistas no assunto os três valores separadamente. Se você pedir O e P primeiro, o viés de ancoragem distorcerá M. Comece com M e depois expanda para os extremos.
Fórmulas de Estimativa de Três Pontos
Existem duas fórmulas padrão. Ambas usam os mesmos insumos; elas diferem em quanto peso dão à estimativa mais provável.
| Fórmula | Expressão | Dá mais peso a |
|---|---|---|
| Triangular (Média Simples) | E = (O + M + P) / 3 | Todas as três igualmente |
| PERT Beta (Ponderada) | E = (O + 4M + P) / 6 | Mais provável (peso 4x) |
| Desvio Padrão (PERT) | DP = (P - O) / 6 | (mede a dispersão, não o valor central) |
Quando usar a triangular: Use a média simples quando você tem dados históricos limitados, quando as três estimativas parecem igualmente plausíveis, ou quando quer uma verificação rápida de sanidade ao lado do seu valor PERT.
Quando usar a PERT beta: Use a fórmula ponderada quando a estimativa mais provável é bem sustentada por dados históricos ou consenso de especialistas. A ponderação 4x reflete a suposição (da estatística) de que a distribuição beta modela melhor as durações de tarefas: o resultado mais provável domina, mas as caudas importam.
O desvio padrão indica o quanto você pode confiar no valor esperado. Uma tarefa com DP = 0,5 dias é muito mais previsível do que uma com DP = 3 dias. Uma vez que você tem o DP, pode construir intervalos de confiança:
- 68% de confiança: E mais ou menos 1 DP
- 95% de confiança: E mais ou menos 2 DP
- 99,7% de confiança: E mais ou menos 3 DP
Distribuição Triangular vs PERT (Beta)
Ambas as fórmulas produzem resultados similares quando a distribuição é simétrica (M fica exatamente entre O e P). Elas divergem quando M se inclina para um dos extremos.
| Fator | Triangular | PERT Beta |
|---|---|---|
| Fórmula | (O + M + P) / 3 | (O + 4M + P) / 6 |
| Peso em M | Igual a O e P | Quatro vezes O e P |
| Melhor para | Ambientes com poucos dados, verificações rápidas | M sustentado por especialistas, cronogramas formais |
| Tratamento de inclinação | Reflete a inclinação bruta diretamente | Amortece valores extremos |
| Usado em | Estimativa informal, modelagem de custos | Redes PERT, cronogramas CPM |
| Desvio padrão | Não definido diretamente | (P - O) / 6 |
Na prática, a PERT beta é a escolha padrão para cronogramas de projeto porque recompensa uma boa estimativa do caso mais provável e amortece a influência de valores extremos que os estimadores costumam adicionar defensivamente.
Como Fazer a Estimativa de Três Pontos
Passo 1: Divida o trabalho em tarefas
Comece com uma estrutura analítica do projeto (EAP) que divide o projeto em pacotes de trabalho pequenos o suficiente para estimar de forma confiável. A estimativa de três pontos funciona no nível da tarefa, não no nível do projeto. Estimar uma vaga "fase de design" como uma única unidade produz resultados pouco confiáveis.
Busque tarefas que levem entre meio dia e duas semanas. Qualquer coisa maior deve ser decomposta ainda mais.
Passo 2: Colete O, M e P para cada tarefa
Envolva as pessoas que realmente farão o trabalho. Use entrevistas estruturadas ou planning poker para coletar estimativas de forma independente antes da discussão. Pergunte a cada estimador:
- "Se tudo desse certo, quanto tempo isso levaria?" (O)
- "Qual é sua estimativa realista em condições normais?" (M)
- "Se os riscos mais prováveis se materializassem todos de uma vez, quanto tempo isso poderia levar?" (P)
Para tarefas sem análogo histórico, amplie deliberadamente o valor pessimista. Subestimar P é o erro mais comum na estimativa de três pontos.
Passo 3: Aplique a fórmula
Escolha sua fórmula (triangular ou PERT beta) e calcule E para cada tarefa. Mantenha um registro de qual fórmula você usou para que as estimativas permaneçam comparáveis ao longo do projeto.
Para a maioria dos contextos de cronograma de projeto, especialmente ao integrar com uma análise de método do caminho crítico ou um gráfico PERT, use a fórmula PERT beta.
Passo 4: Calcule o desvio padrão e a faixa de confiança
Para cada tarefa, calcule DP = (P - O) / 6. Depois, defina uma faixa de confiança:
- Confiança baixa necessária (planejamento aproximado): E mais ou menos 1 DP
- Confiança média (cronograma comprometido): E mais ou menos 2 DP
- Confiança alta (prazo contratual ou regulatório): E mais ou menos 3 DP
Para uma tarefa com O=3, M=7, P=15: E = (3 + 28 + 15) / 6 = 7,67 dias; DP = (15 - 3) / 6 = 2 dias. Sua faixa de 95% é de 3,67 a 11,67 dias, o que representa uma comunicação honesta com os stakeholders.
Passo 5: Consolide no nível do projeto
Para calcular uma duração esperada no nível do projeto, some os valores esperados das tarefas no caminho crítico. Para calcular o desvio padrão no nível do projeto, use a raiz da soma dos quadrados: DP_projeto = raiz(DP1² + DP2² + ... + DPn²).
Essa consolidação é como o PERT se conecta à análise de diagrama de rede e aos cálculos de float e slack.
Exemplo Prático
Uma equipe de software está estimando três tarefas para o lançamento de uma funcionalidade. Eles usam a fórmula PERT beta.
| Tarefa | O (dias) | M (dias) | P (dias) | E = (O+4M+P)/6 | DP = (P-O)/6 | Faixa de 95% |
|---|---|---|---|---|---|---|
| Revisão de requisitos | 1 | 2 | 5 | 2,3 | 0,67 | 1,0 a 3,7 |
| Desenvolvimento back-end | 3 | 6 | 15 | 7,0 | 2,0 | 3,0 a 11,0 |
| QA e correção de bugs | 2 | 4 | 10 | 4,7 | 1,33 | 2,0 a 7,3 |
| Total | 14,0 | 2,42 | 9,1 a 18,9 |
O DP no nível do projeto é raiz(0,67² + 2,0² + 1,33²) = raiz(0,45 + 4,0 + 1,77) = raiz(6,22) = 2,49 dias.
Essa equipe deve comunicar uma duração esperada de 14 dias com uma faixa de confiança de 95% de aproximadamente 9 a 19 dias, não "duas semanas, com certeza".
Benefícios e Limitações
| Aspecto | Benefícios | Limitações |
|---|---|---|
| Precisão | Reduz o viés de otimismo forçando uma visão de pior caso | Só é tão boa quanto a qualidade dos insumos O, M e P |
| Comunicação | Oferece aos stakeholders uma faixa, não um número de falsa precisão | Faixas podem deixar os stakeholders desconfortáveis; pode exigir orientação |
| Visibilidade de risco | Uma diferença ampla entre P e O sinaliza tarefas de alta incerteza cedo | Não diz por que uma tarefa é incerta |
| Integração | Funciona diretamente com CPM, gráficos PERT e consolidações da EAP | Adiciona sobrecarga de estimativa por tarefa |
| Necessidade de dados | Funciona sem dados históricos; o julgamento de especialistas é suficiente | O viés de ancoragem de especialistas pode distorcer os três valores |
| Simplicidade | Duas fórmulas, matemática direta | Equipes podem passar a sempre usar PERT e esquecer de validar M |
Perguntas Frequentes
Qual é a fórmula PERT para estimativa de três pontos? A fórmula PERT beta é E = (O + 4M + P) / 6, onde O é a estimativa otimista, M é a estimativa mais provável e P é a estimativa pessimista. O fator 4 dá quatro vezes mais peso ao valor mais provável, refletindo a suposição estatística de que as durações de tarefas seguem uma distribuição beta.
Qual é a diferença entre a estimativa PERT e a triangular? Ambas usam os mesmos três insumos (O, M, P). A estimativa triangular faz a média deles igualmente: E = (O + M + P) / 3. A PERT beta pondera a estimativa mais provável quatro vezes mais: E = (O + 4M + P) / 6. A PERT beta é preferida para cronogramas de projeto formais; a triangular é mais rápida e mais adequada para estimativas aproximadas em fase inicial.
É possível usar a estimativa de três pontos para custo além de tempo? Sim. As mesmas fórmulas se aplicam a estimativas de custo: substitua O, M e P por valores de custo do melhor caso, mais provável e pior caso. O custo esperado e o desvio padrão funcionam de forma idêntica. Muitos gerentes de projeto rodam estimativas de três pontos paralelas de tempo e custo para cada pacote de trabalho.
Para quantas tarefas devo aplicar a estimativa de três pontos? Aplique-a a tarefas onde a incerteza é significativa, tipicamente tarefas com duração acima de um dia, tarefas no caminho crítico, ou tarefas com dependências que poderiam causar atrasos em cascata. Para tarefas muito curtas e bem compreendidas, uma estimativa de ponto único geralmente é suficiente.
O que fazer se meus especialistas no assunto se recusarem a dar estimativas pessimistas? Isso é comum. Os estimadores temem que um valor P alto se torne uma meta. Reformule a pergunta: pergunte "Em qual duração você colocaria 10% de probabilidade de ser excedida?" em vez de "Qual é o pior caso?" Você também pode usar dados reais históricos de tarefas concluídas semelhantes para ancorar o valor P de forma independente.
Para programar essas estimativas em uma rede de projeto, veja os fundamentos do gráfico PERT e o método do caminho crítico. Para entender como o float afeta o cronograma de tarefas depois que você tem as durações, veja float e slack. Para construir a hierarquia de tarefas que alimenta a estimativa de três pontos, veja estrutura analítica do projeto e diagrama de rede.

Senior Operations & Growth Strategist
On this page
- O que é estimativa de três pontos?
- Principais Fatos
- As Três Estimativas: Otimista, Mais Provável, Pessimista
- Fórmulas de Estimativa de Três Pontos
- Distribuição Triangular vs PERT (Beta)
- Como Fazer a Estimativa de Três Pontos
- Passo 1: Divida o trabalho em tarefas
- Passo 2: Colete O, M e P para cada tarefa
- Passo 3: Aplique a fórmula
- Passo 4: Calcule o desvio padrão e a faixa de confiança
- Passo 5: Consolide no nível do projeto
- Exemplo Prático
- Benefícios e Limitações
- Perguntas Frequentes