Milestone Chart: What It Is and How to Create One
Turn this article into takeaways for your work.
Each assistant summarizes the article only for you and suggests best practices for your work.
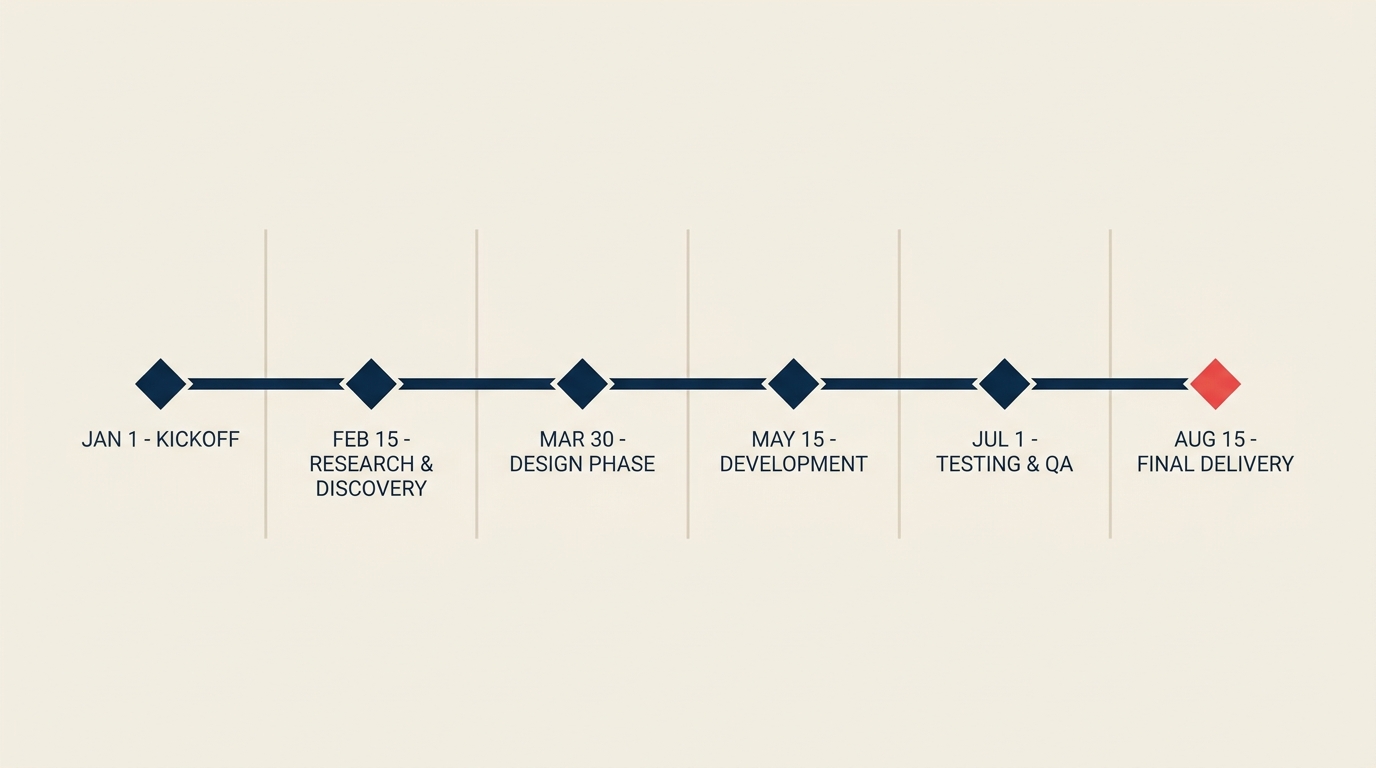
A milestone chart is a timeline that shows only the key checkpoints in a project, marked by diamond symbols, with no task bars or durations in between. It tells you what must be achieved and when, not how the day-to-day work gets done.
If you've ever sat through a stakeholder update where a full Gantt chart produced more confusion than clarity, a milestone chart is the answer. It cuts out the noise and puts decision points front and center.
What is a milestone chart?
A milestone chart (sometimes called a milestone timeline) is a single-axis visualization that plots a project's significant checkpoints against a calendar. Each checkpoint appears as a diamond marker at a specific date. The chart carries no horizontal task bars, no duration shading, and no dependency arrows. It is purely a schedule of events that must be completed.
The term "milestone" comes from the stone markers historically placed along Roman roads to mark distances. In project management, it carries the same idea: a milestone is a fixed point that signals meaningful progress, not a stretch of work in progress.
Common milestones include:
- Phase completions (discovery phase sign-off, design review)
- Regulatory or contractual deadlines (permit submission, contract execution)
- Stakeholder approvals (board sign-off, client acceptance)
- Deliverable hand-offs (completed prototype delivered to QA)
- Go/no-go decision gates before major spending
A milestone has zero duration. It marks the moment something is done, not the effort to get there. This is the clearest way to distinguish a milestone from a task.
Key Facts
Key Facts: Milestones and Project Tracking
- PMI's 2024 Pulse of the Profession reports that 47% of projects miss their original deadlines, with unclear progress checkpoints cited among the leading contributors to schedule slippage. (PMI, Pulse of the Profession 2024)
- A 2023 Wellingtone State of Project Management survey found that only 26% of organizations always or mostly complete projects on time, underscoring the need for explicit schedule anchors like milestones. (Wellingtone, 2023)
- According to PMI research, organizations that consistently use formal milestone reviews waste 28 times less money than those with poor project performance practices. (PMI, 2023)
Milestone chart vs Gantt chart
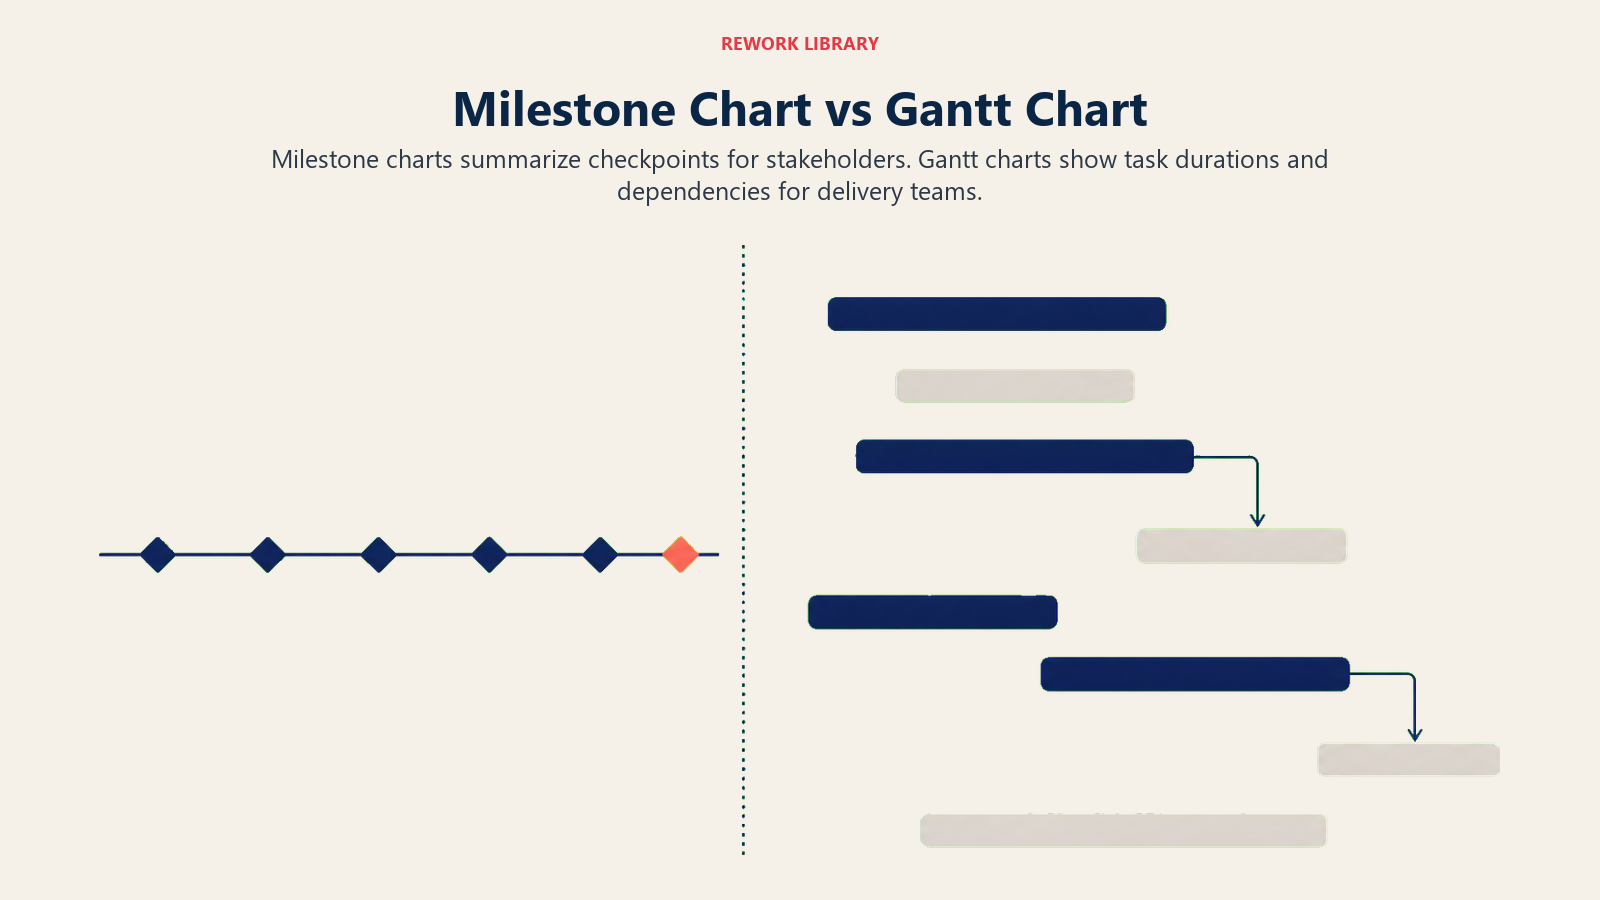
Both tools live on a timeline, and both can show milestones. But they serve different audiences at different levels of detail.
| Dimension | Milestone chart | Gantt chart |
|---|---|---|
| What it shows | Key checkpoints only (diamond markers) | Full task schedule with durations and task bars |
| Detail level | High-level, summary | Granular, operational |
| Dependency arrows | No | Optional (link lines between bars) |
| Duration visualization | None | Bar length represents task duration |
| Primary audience | Executives, sponsors, steering committees | Project team, coordinators, PMs |
| Best used when | Communicating progress at a glance | Planning, assigning, and tracking daily work |
| Cognitive load | Low | Medium to high |
| Time to build | Minutes | Hours to days |
The key insight: a milestone chart is a filtered view of a Gantt chart. It answers "are we on track?" without requiring the reader to scan 50 task bars. Most project managers maintain a full Gantt chart for internal execution and produce a milestone chart for stakeholder reports and steering committee decks.
What makes a good milestone
Not every task deserves to be a milestone. Treating too many items as milestones dilutes the signal. A strong milestone has these characteristics.
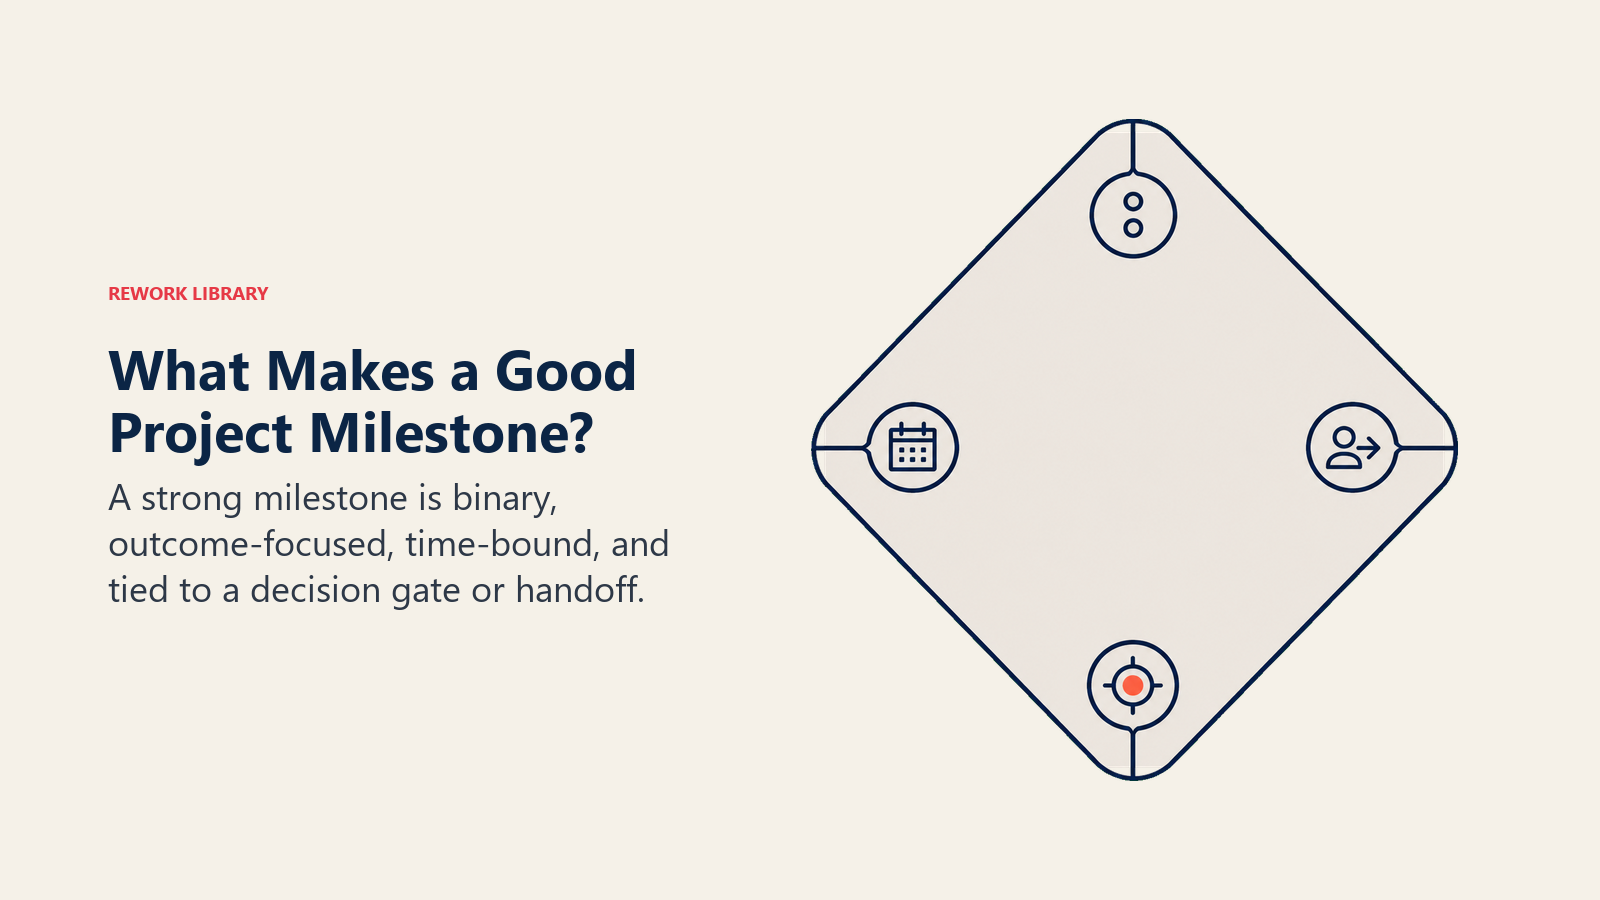
It is binary. Either the milestone is met or it is not. "Requirements document approved by the client" is binary. "Good progress on requirements" is not. If you can't answer yes or no at a point in time, it's not a milestone.
It is SMART. Milestones follow the same logic as SMART goals: Specific (exactly what is delivered), Measurable (clear pass/fail test), Achievable (realistic given scope and resources), Relevant (tied to a strategic outcome), and Time-bound (a single fixed date, not a range).
It is outcome-focused, not activity-focused. "Run three training sessions" is a task. "Training complete: all 24 staff members certified" is a milestone. The distinction matters because it ties the checkpoint to a deliverable outcome that stakeholders care about.
It represents a decision gate or hand-off. The strongest milestones are moments when the project either advances to the next phase or pauses for a formal decision. A go/no-go review, a client sign-off, and a regulatory approval all qualify. These gates also serve as natural risk checkpoints within your project life cycle.
It is tied to the project charter or contract. Milestones that appear in the charter or the client contract carry the most weight. They signal obligations, not just internal hopes.
Aim for 6 to 12 milestones on a typical project timeline. Fewer than 5 gives too little visibility. More than 15 starts to look like a task list with diamonds on it.
Benefits of a milestone chart
Stakeholders actually read it. A one-page milestone chart fits on a slide. A 30-row Gantt chart rarely gets more than a glance from a board member or sponsor. When communication is the goal, simplicity wins.
It surfaces slippage early. Because each milestone is tied to a date, a missed or at-risk checkpoint is immediately visible. There's no place to hide behind "the team is making progress." You hit the milestone by the date or you don't.
It supports parallel workstreams. Large programs often have several teams running in parallel. A milestone chart can show milestones from five different workstreams on a single timeline, making dependencies and sequencing obvious without requiring the reader to cross-reference multiple Gantt charts.
It pairs naturally with a project status report. Status reports typically include a RAG (red, amber, green) summary. Pairing that summary with a milestone chart makes the status concrete. Instead of saying "the project is amber," you can point to exactly which milestone is at risk and by how many days.
It anchors the project baseline. Once approved, the milestone chart becomes part of the baseline. Any change to a milestone date triggers a formal change request, which protects the schedule from scope creep.
Common mistakes
Listing tasks as milestones. If the diamond marker has a duration ("user testing: 2 weeks"), it's a task, not a milestone. Remove the duration or break it into a task with a clear completion milestone at the end.
Including too many milestones. A chart with 30 diamonds is just a different kind of clutter. Filter ruthlessly. Keep only the points where a decision is made, a deliverable is handed over, or a phase formally closes.
Setting vague milestone names. "Phase 2" tells no one anything. "Phase 2 complete: prototype approved by client" is clear and actionable. Always write the milestone name as a completed outcome.
Skipping dependencies with the Gantt chart. A milestone chart doesn't show task dependencies, so teams that use only a milestone chart can miss critical sequencing problems. It's a communication tool, not a substitute for a full schedule.
Treating the chart as static. Projects change. A milestone chart that was accurate at kickoff but never updated creates false confidence. Review and update it at every status cycle.
Not linking milestones to the work breakdown structure. Milestones should correspond to the completion of specific WBS deliverables. If a milestone has no traceable WBS item behind it, it has no real accountability.
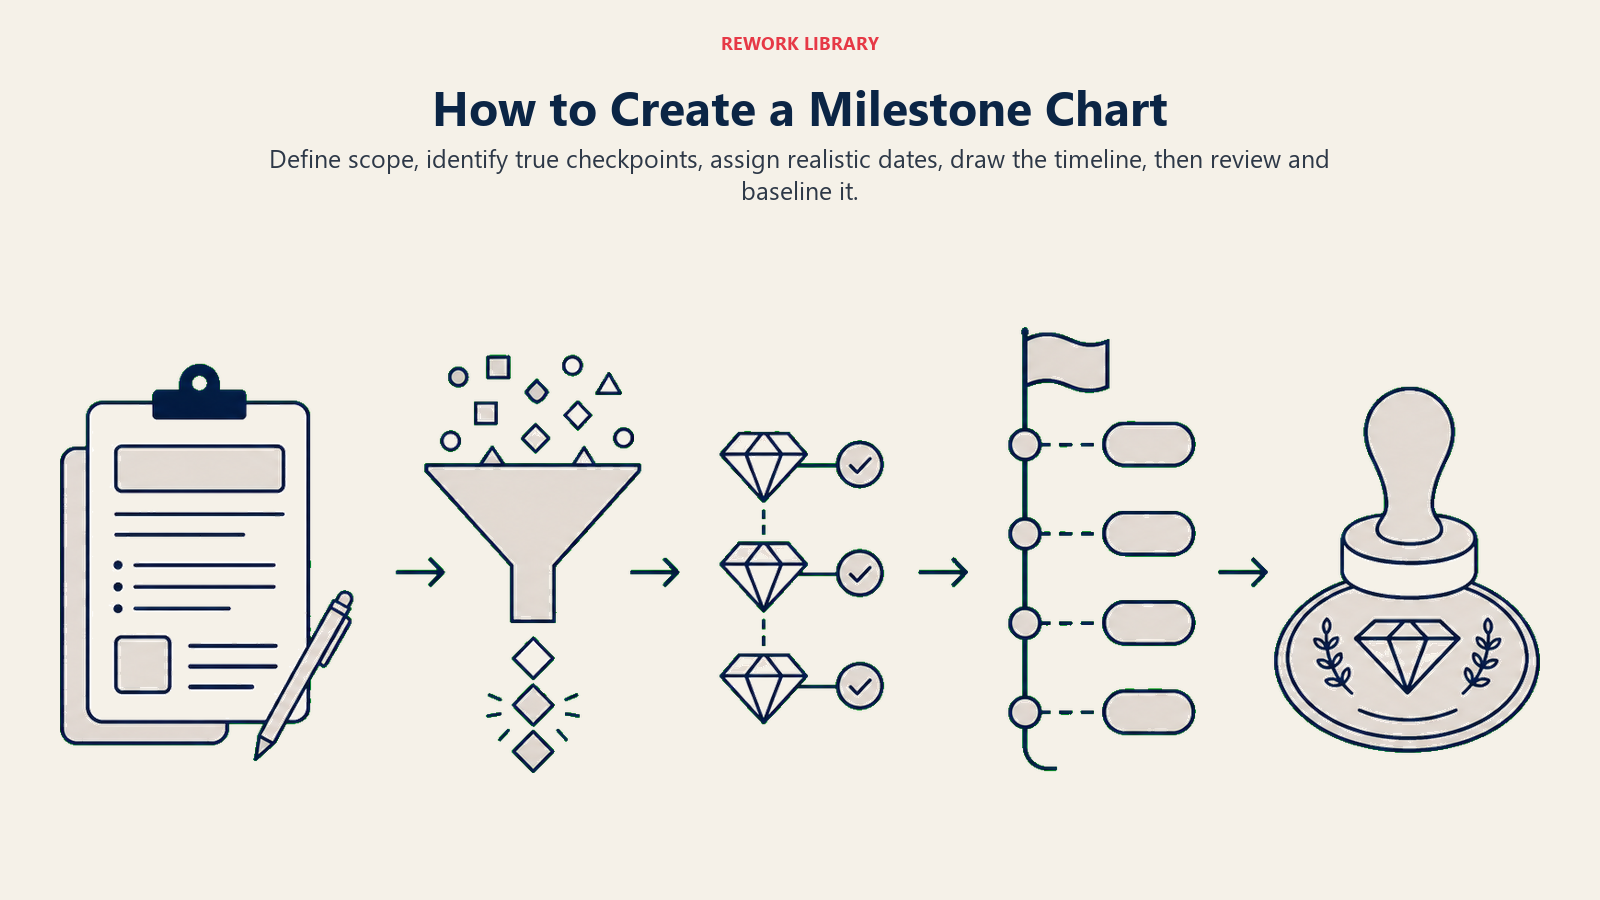
How to create a milestone chart
Step 1: Define the project scope and outcomes
Before drawing anything, confirm the project's scope, major deliverables, and end goal. Use your project charter or project planning documents as the source of truth. A milestone chart built on a fuzzy scope will mislead more than it helps.
Step 2: Identify candidate milestones
List every major deliverable, phase completion, decision gate, and external dependency. Don't filter yet. Common sources include:
- Phase gates in your project life cycle (initiation, planning, execution, closure)
- Client or contractual commitments
- Regulatory filing deadlines
- Approvals required before the next phase can begin
- Major hand-offs between teams or vendors
Cross-reference this list with your work breakdown structure (WBS) to make sure each milestone maps to a real deliverable.
Step 3: Filter to true milestones
Go through your candidate list and apply the binary test. If a milestone cannot be answered with "yes, done" or "no, not done" on a specific date, replace it with a clearer outcome statement or remove it. Aim for 6 to 12 milestones for a typical 3 to 12-month project.
Step 4: Assign realistic dates
Work backward from the final deadline if you have a fixed end date, or forward from the start date if you have more flexibility. For each milestone, estimate the time needed to complete the underlying work, cross-reference any task dependencies that could affect timing, and build in buffer before high-risk milestones.
Don't shortcut this step by copying dates from someone else's project. Dates need to reflect your team's capacity and the specific complexity of your deliverables.
Step 5: Draw the chart
Plot the milestones on a horizontal timeline. Convention:
- Horizontal axis: calendar dates (weeks, months, or quarters depending on project length)
- Diamond markers: one per milestone, positioned at the due date
- Labels: milestone name above or below the diamond, short and outcome-focused
- Color coding (optional): green for on track, amber for at risk, red for overdue, in status updates
- Baseline vs current (optional): show original planned date alongside revised date when the schedule has slipped
Most project management tools generate milestone charts automatically from a task list. In a spreadsheet, a scatter chart with diamond-shaped data points works well.
Step 6: Review and baseline
Share the draft with the project sponsor, key stakeholders, and the team. Confirm every milestone name is understood, every date is achievable, and no critical checkpoint has been missed. Once approved, baseline the chart. From this point, any change to a milestone date requires a documented change request, keeping the schedule accountable.
Milestone chart examples
Different project types produce different milestone patterns. Here are three common examples.
| Project type | Sample milestones |
|---|---|
| Software product launch | Requirements sign-off (Week 2) / Design prototype approved (Week 5) / Development complete (Week 10) / UAT sign-off (Week 13) / Go-live (Week 14) |
| Construction fit-out | Permits approved (Month 1) / Demolition complete (Month 2) / MEP rough-in done (Month 4) / Final inspection passed (Month 6) / Handover to client (Month 6.5) |
| Marketing campaign | Creative brief approved (Day 5) / Assets delivered from creative team (Day 20) / Media plan signed off (Day 25) / Campaign live (Day 30) / Post-campaign review complete (Day 60) |
Notice that each milestone is written as a completed outcome, tied to a specific point in time, and unambiguously pass/fail.
Best practices
Do:
- Write every milestone as a completed outcome ("X approved", "Y delivered")
- Keep the chart to one page so stakeholders read it
- Update dates in real time, not only at review meetings
- Link each milestone to a named owner who is accountable for it
- Show both baseline and current dates once the project is in flight
- Pair the milestone chart with your project status report at every stakeholder update
Don't:
- Add milestones mid-project without a formal change request
- Use vague names like "phase 2" or "testing done"
- Let the chart go stale between updates
- Treat a milestone chart as a replacement for a full Gantt schedule
- Assign the same milestone to multiple owners (accountability gets diffused)
Related reading

Senior Operations & Growth Strategist
On this page
- What is a milestone chart?
- Key Facts
- Milestone chart vs Gantt chart
- What makes a good milestone
- Benefits of a milestone chart
- Common mistakes
- How to create a milestone chart
- Step 1: Define the project scope and outcomes
- Step 2: Identify candidate milestones
- Step 3: Filter to true milestones
- Step 4: Assign realistic dates
- Step 5: Draw the chart
- Step 6: Review and baseline
- Milestone chart examples
- Best practices
- Related reading