Swimlane Diagram: How to Map Cross-Functional Processes
Turn this article into takeaways for your work.
Each assistant summarizes the article only for you and suggests best practices for your work.
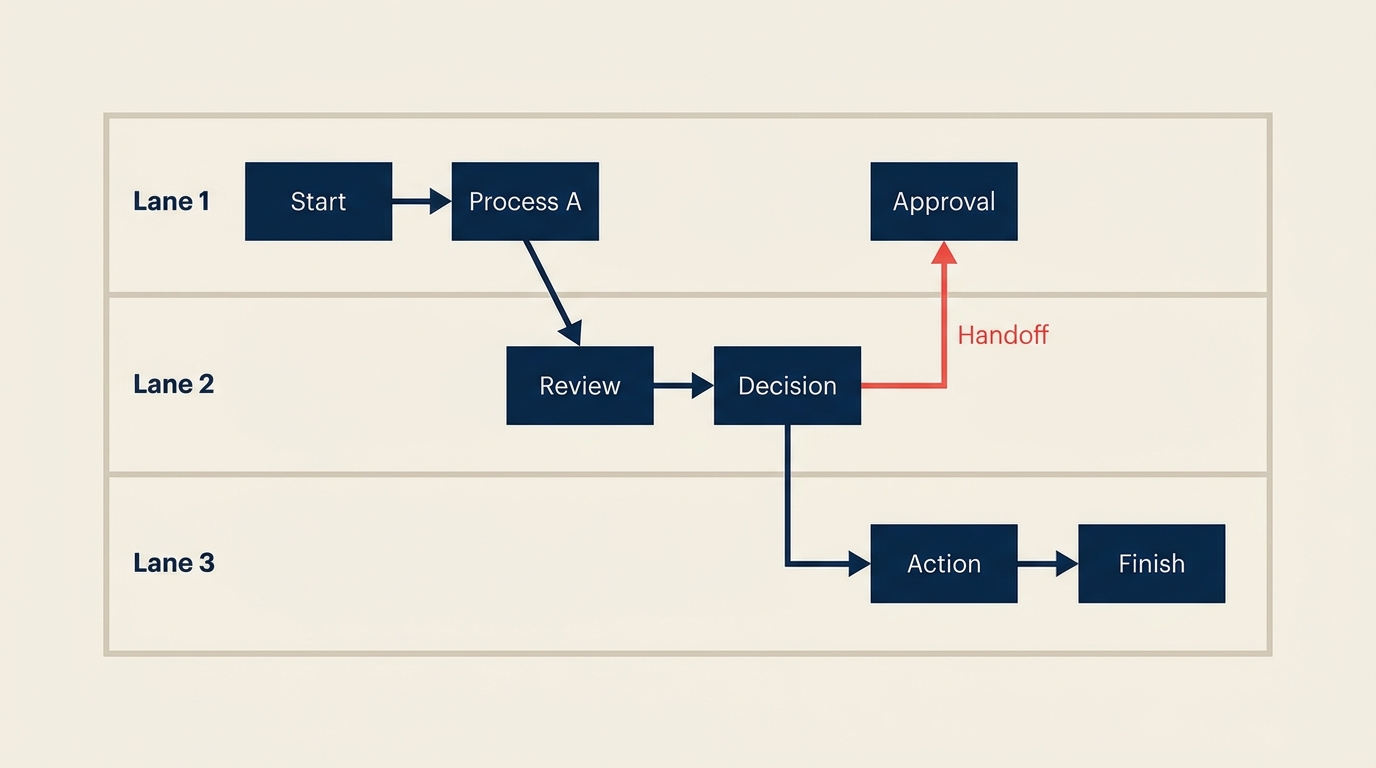
A swimlane diagram organizes a process flowchart into horizontal or vertical lanes, where each lane represents one role, team, or department. It shows not just what happens in a process but who does each step and where work crosses boundaries between functions.
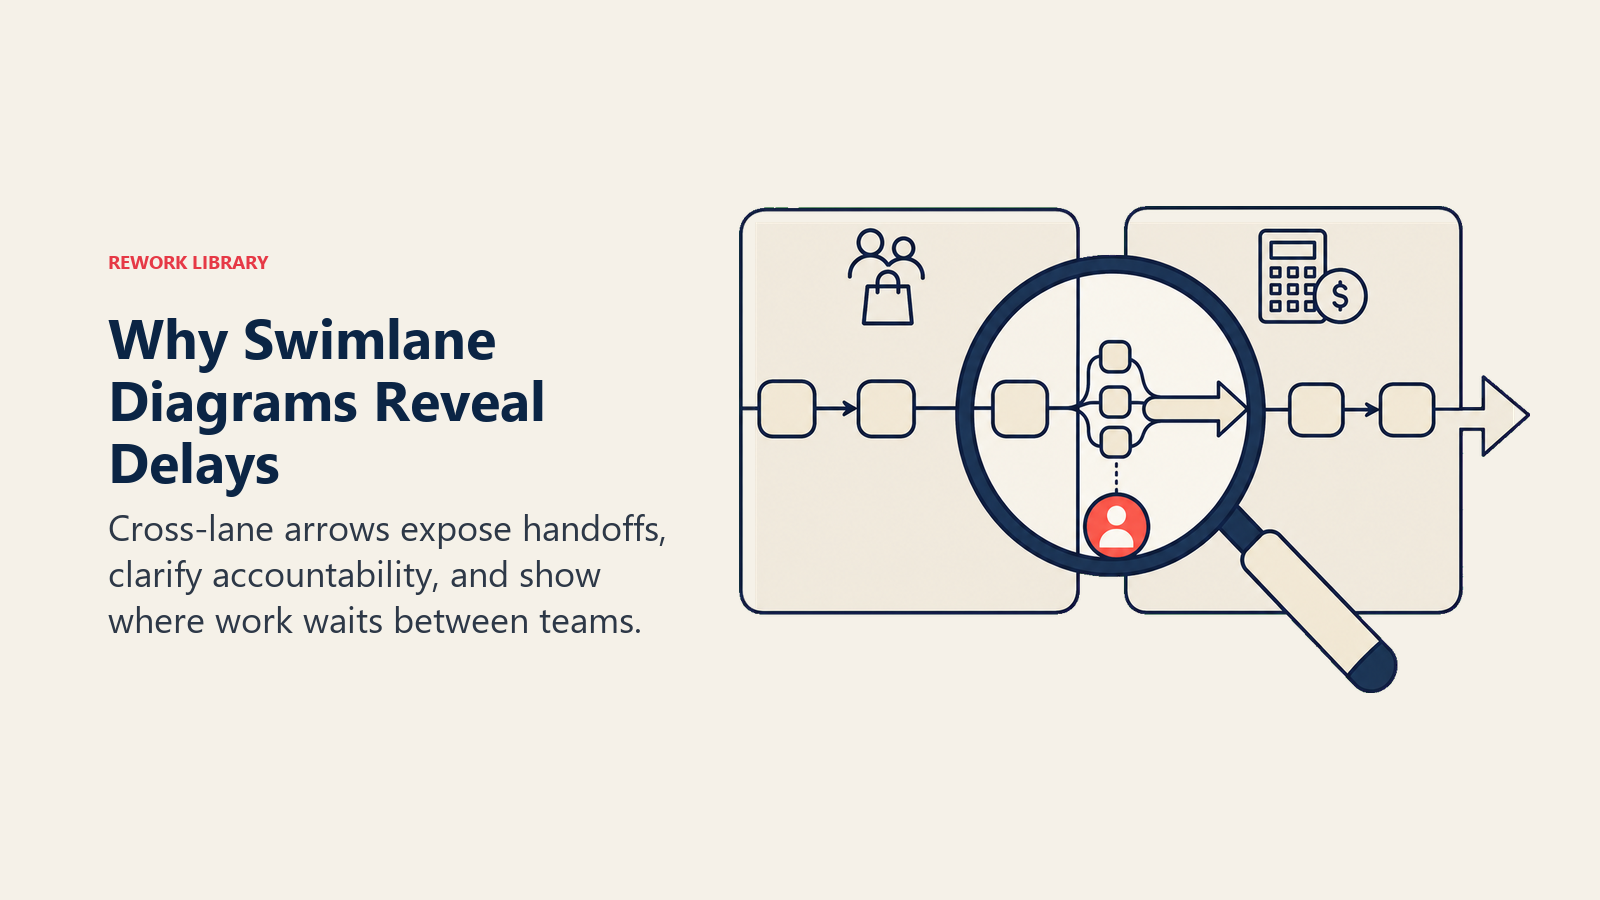
That last part is the whole point. Most process diagrams collapse every actor into a single linear sequence. A swimlane diagram keeps them separated, so the handoffs are literally drawn across the diagram. You see at a glance where a task leaves one team and lands with another, and that visibility is what makes it useful for spotting delays, missed responsibilities, and accountability gaps.
What is a swimlane diagram?
A swimlane diagram (sometimes called a cross-functional flowchart or pool-and-lane diagram) is a process map that divides the diagram space into parallel lanes, with each lane assigned to a single actor, whether that is a job role, a department, a system, or an external party. Steps are placed inside the lane that owns them. Arrows that cross from one lane to another represent handoffs, the moments when responsibility transfers from one party to the next.
The format was popularized by Geary Rummler and Alan Brache in their 1990 book Improving Performance, which introduced what they called "deployment flowcharts" or "cross-functional process maps." The swimlane label stuck because the lanes look like the lanes in a swimming pool.
Key Facts
- A McKinsey study found that cross-functional coordination failures are responsible for roughly 80% of the delays and defects in knowledge-work processes. Swimlane diagrams make those coordination points visible, which is why they are a standard first step in any cross-functional process improvement project (McKinsey Quarterly, 2020).
- Research published in the MIT Sloan Management Review found that process visibility alone, before any redesign work begins, can reduce cycle time by 15 to 25% because teams self-correct once they can see where work sits idle (MIT SMR, 2019).
- The Object Management Group (OMG), which governs the business process model and notation (BPMN) standard, estimates that over 70% of BPMN diagrams in production use swimlane pools as their primary organizing structure (OMG BPMN 2.0 Usage Survey, 2021). "Most process problems are not caused by people failing within their function. They are caused by nobody owning the space between functions." (Geary Rummler, Improving Performance, 1990.)
Swimlane diagram symbols and notation
Swimlane diagrams borrow their symbol set from standard flowcharting but add one structural element: the lane itself.
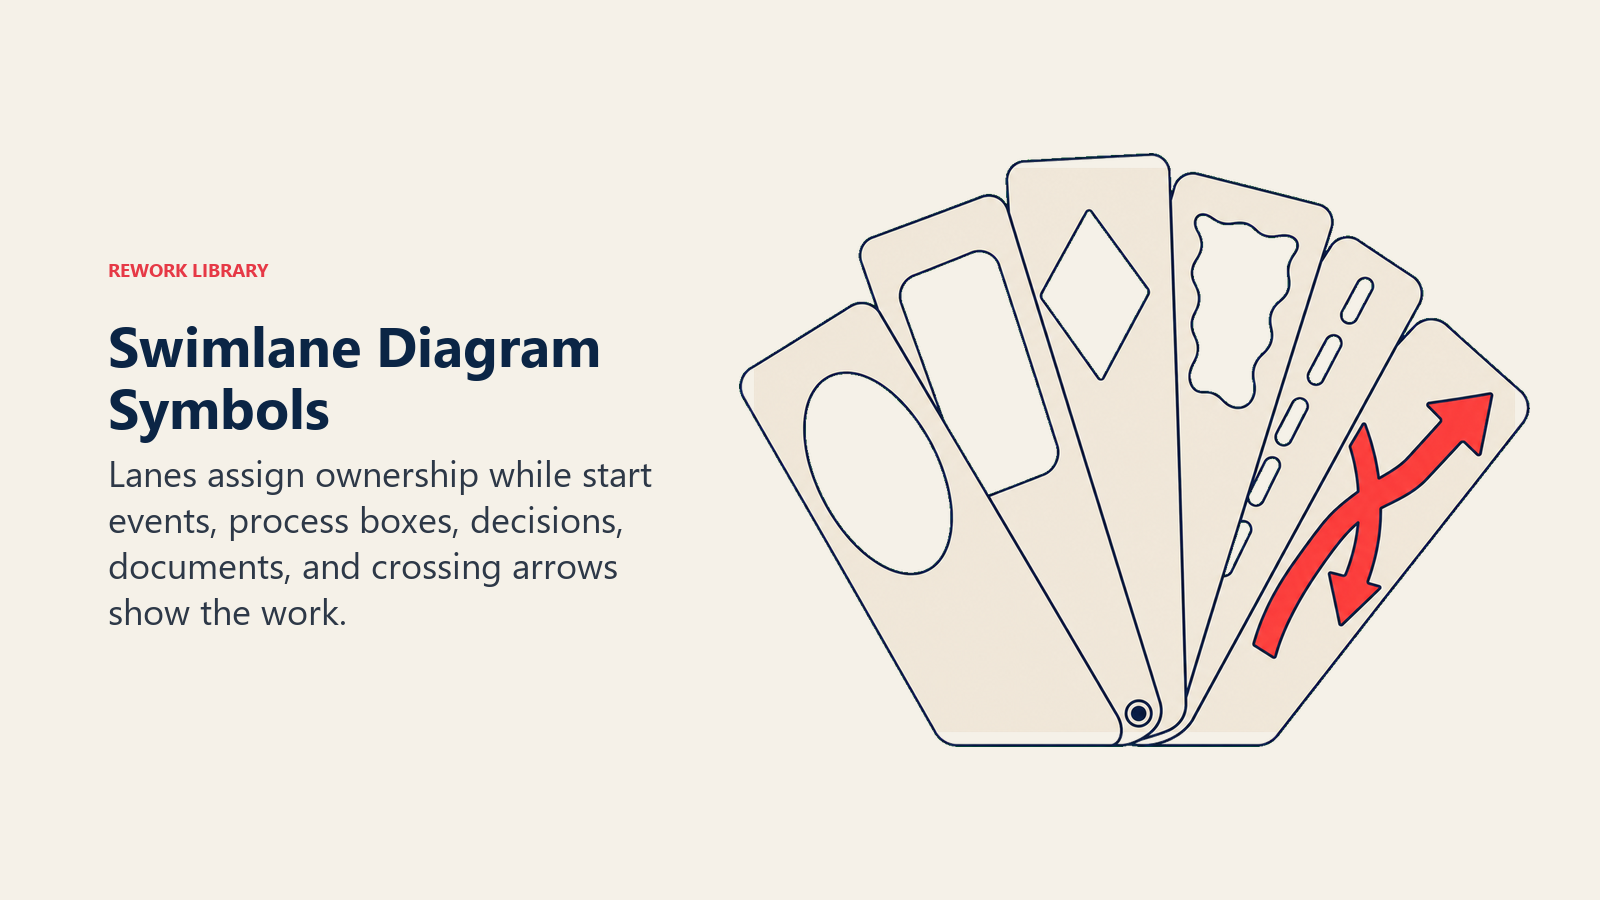
| Symbol | Shape | What it means |
|---|---|---|
| Start / End | Oval or circle | The event that triggers the process or signals its completion |
| Process step | Rectangle | A task or activity performed by the actor in that lane |
| Decision | Diamond | A yes/no branch point that directs flow to different next steps |
| Document | Rectangle with wavy bottom | A form, report, email, or other document produced or consumed |
| Handoff arrow | Arrow crossing a lane boundary | Responsibility transfers from one actor to another |
| Lane | Horizontal or vertical band | The actor (role, department, or system) that owns steps inside it |
| Pool | Outer border around all lanes | The overall process or the end-to-end workflow being mapped |
Horizontal vs. vertical lanes. Both orientations are valid. Horizontal lanes (where each row is an actor and flow runs left to right) are more common in business contexts because they read naturally for English-speaking teams. Vertical lanes (where each column is an actor and flow runs top to bottom) are common in software and technical documentation. The choice is purely practical. Pick whichever fits your page or screen without crowding.
Number of lanes. Most effective swimlane diagrams have between three and six lanes. Fewer than three and you probably do not need lanes at all, since a standard flowchart will do. More than six and the diagram becomes hard to read; consider splitting the process into two diagrams or consolidating lower-frequency actors into a shared lane.
Swimlane diagram vs. flowchart vs. BPMN
These three formats are related but serve different purposes.
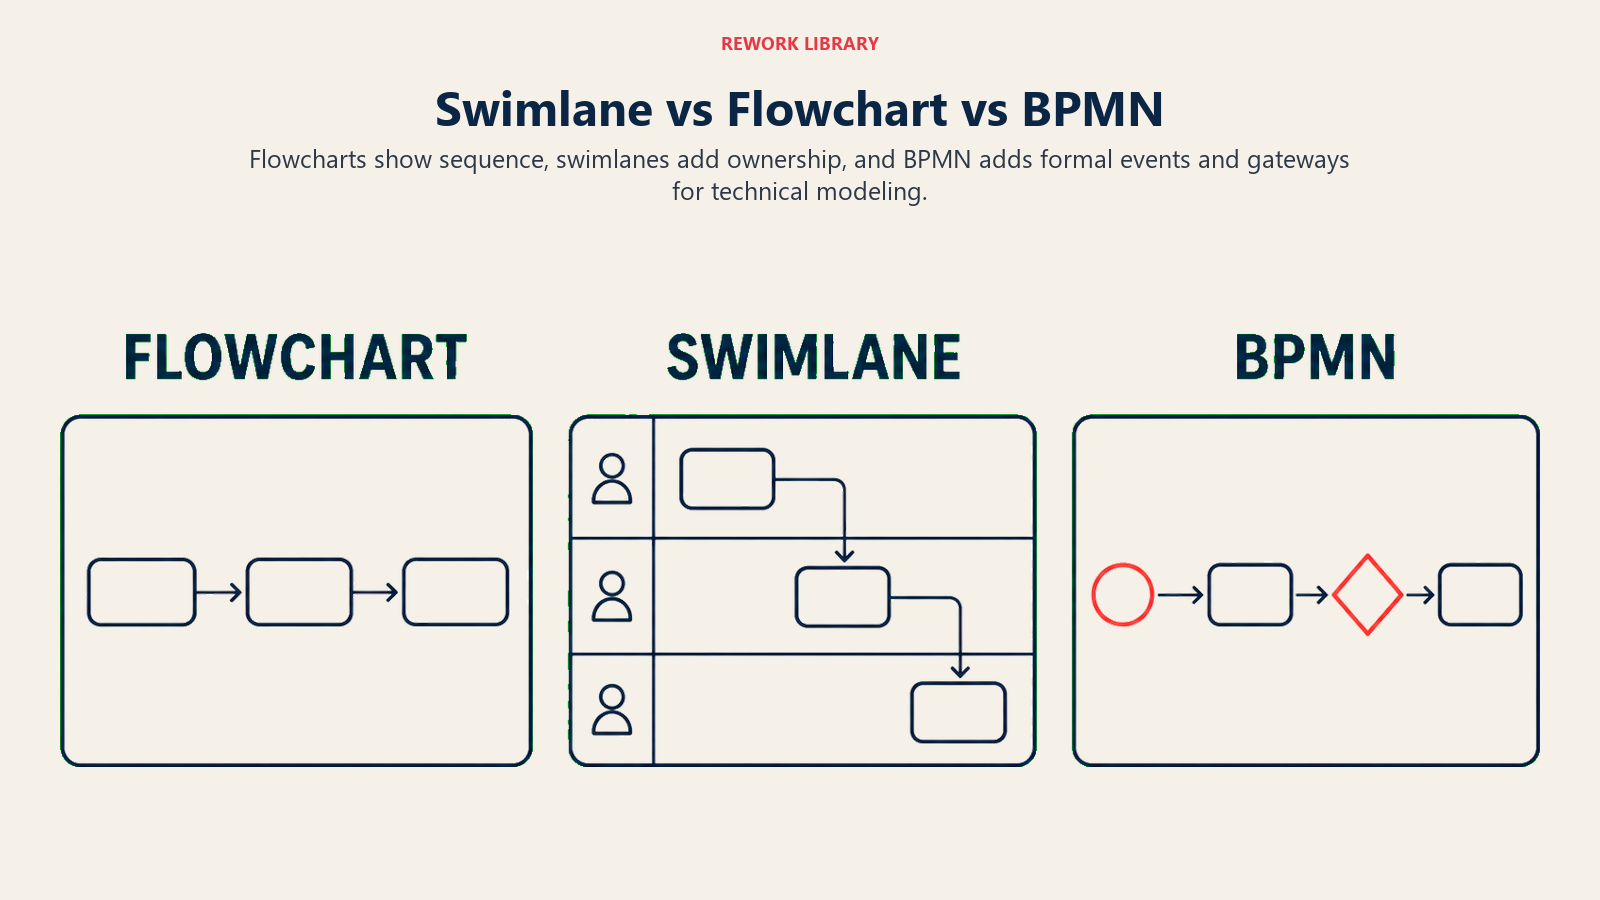
| Format | Organizes by | Shows handoffs? | Best for |
|---|---|---|---|
| Flowchart | Sequence of steps | Only if annotated manually | Documenting a single-actor or simple multi-step process |
| Swimlane diagram | Actor (role / department) | Yes, structurally | Cross-functional processes where ownership matters |
| BPMN | Pools and lanes with full event/gateway notation | Yes, with formal semantics | Technical process modeling, automation, or system integration specs |
A flowchart shows you what happens. A swimlane diagram shows you what happens and who owns each step. BPMN goes further and gives you a machine-readable, standardized notation with a richer symbol vocabulary for events, message flows, and subprocesses.
For most business teams working on process documentation or a first-pass business process mapping exercise, a swimlane diagram hits the right level of detail. It is visual enough for a workshop, precise enough to expose accountability gaps, and simple enough that stakeholders without process-modeling backgrounds can read it in seconds.
Benefits of swimlane diagrams
Handoffs become impossible to ignore. In a standard flowchart, the step where Sales hands a qualified lead to Finance is just another box in a sequence. In a swimlane diagram, it is an arrow that literally crosses a boundary. Every person in the room can see it. That visual makes it easy to count handoffs, question which ones are necessary, and identify where delays accumulate.
Accountability is built into the structure. Because each lane has a named owner, there is no ambiguity about who is responsible for a given step. This matters in process standardization work, where teams need to write standard operating procedures after they agree on the as-is flow.
Root cause analysis gets easier. When a process breaks, teams often spend hours debating whose fault it is. A swimlane diagram shifts that conversation from blame to structure. You look at the diagram and ask where the handoff broke, not who broke it. That makes business process management conversations productive rather than political.
It scales from workshops to documentation. You can sketch a swimlane diagram on a whiteboard in 30 minutes to run a discovery workshop. You can also produce a polished version for a process manual, a compliance audit, or a full business process reengineering effort.
It pairs naturally with other tools. Swimlane diagrams work well alongside a SIPOC diagram (which defines scope and stakeholders before you draw) and value stream mapping (which adds time and waste data on top of a flow view).
Common mistakes
Too many lanes. Adding a lane for every person involved turns the diagram into a grid that nobody can follow. Group individual contributors into role categories (e.g., "Account Manager" rather than each person's name) unless the distinction genuinely matters.
Mixing levels of detail. A swimlane diagram should represent steps at a consistent level of abstraction. If one lane shows "Review invoice" and another shows "Open email, check attachment, forward to controller, log in system, enter line items, click Save," those are not at the same level. Pick a grain size and apply it everywhere.
Drawing the ideal process instead of the actual one. This is the most common error in any current vs. future state mapping exercise. Teams naturally describe what should happen, not what does happen. Start with the as-is process. You cannot improve what you have not honestly mapped.
Leaving handoffs implicit. An arrow labeled "sends to" is not enough. Note what is actually transferred: a specific form, a system notification, a verbal approval. Vague handoffs create vague accountability.
No validation step. A diagram drawn by one person or one team almost always contains errors. Steps are missing. The sequence is wrong. A lane is missing. Always walk the diagram with people who actually do the work before you treat it as authoritative.
How to create a swimlane diagram
Define scope, identify three to six actors, place the real steps in their lanes, connect handoffs, then validate with the people doing the work.
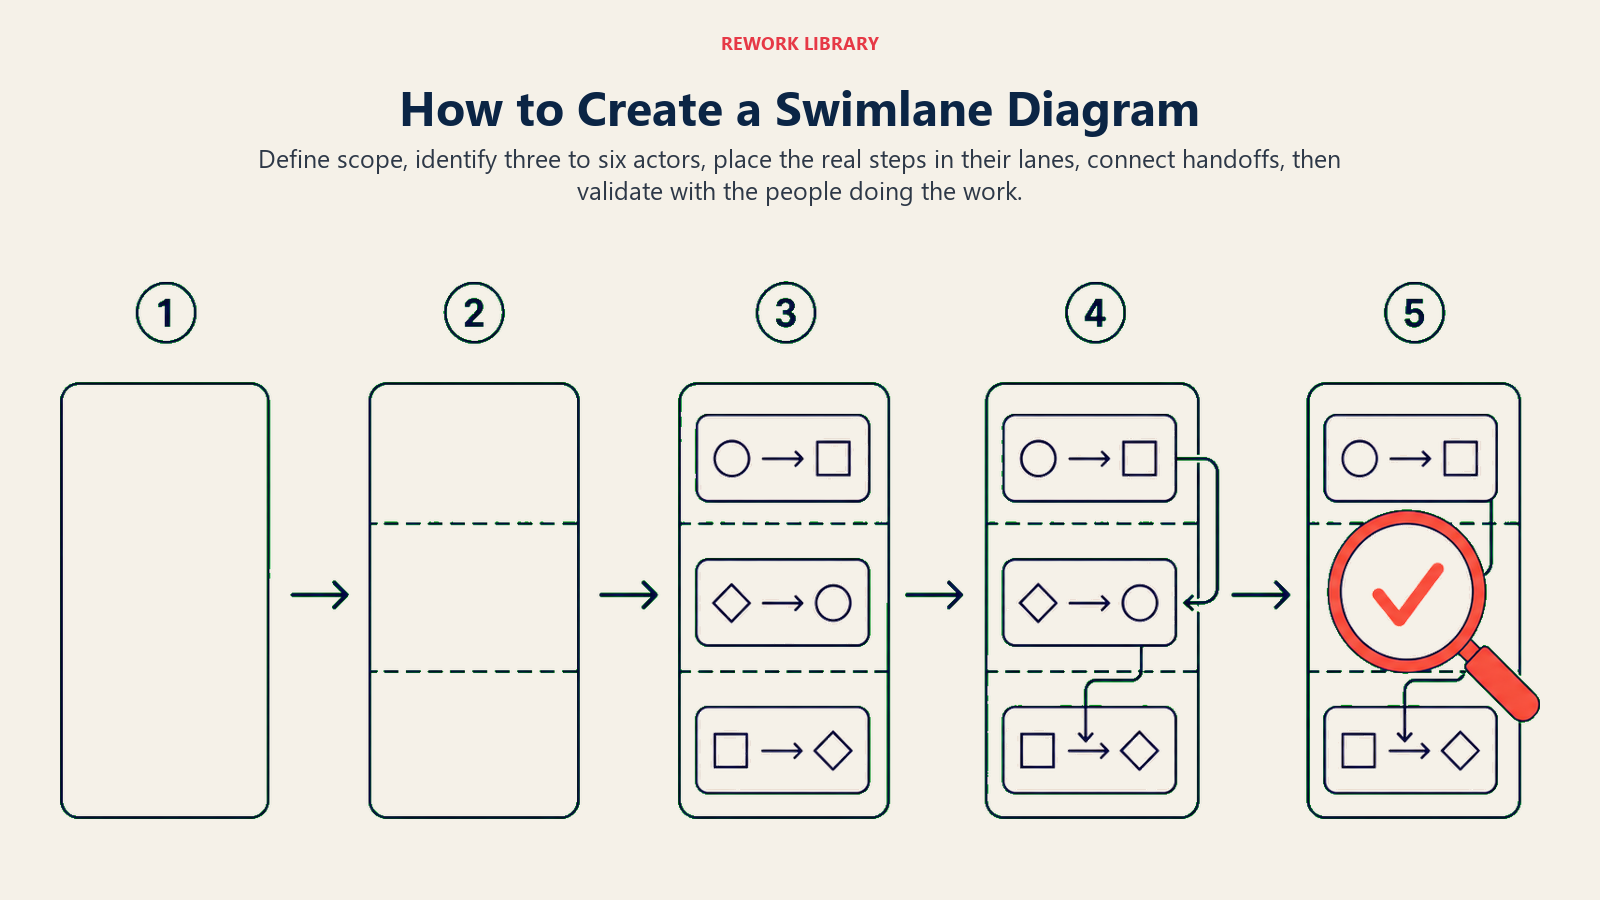
Step 1: Define the scope
Name the process and its start and end points. "Order fulfillment" is too broad. "Order fulfillment from customer purchase confirmation to shipment label printed" is a scope. Write it at the top of your diagram before you draw a single box. Without a clear scope, the diagram will sprawl.
Step 2: Identify the actors and create lanes
List every role, department, or system that participates in the process. Each one gets its own lane. If you have more than six, look for actors that can be grouped or roles that only appear once for a minor step (those can often be annotated rather than given a full lane).
Decide on orientation: horizontal lanes are usually easier for business process workshops; vertical lanes work better for technical diagrams where the flow naturally runs top to bottom.
Step 3: List all process steps
Before placing anything in the diagram, write out every step as a flat list. This prevents you from drawing yourself into a corner where the sequence makes no visual sense. For each step, note which actor owns it.
Step 4: Place steps in the correct lanes
Map each step into its lane in sequence. Use the standard symbols: rectangles for tasks, diamonds for decisions, ovals for start and end events. Keep labels short, two to five words per box. Long labels are a sign that a step needs to be broken down further or that you are mixing levels of detail.
Step 5: Draw the handoffs
Add arrows between steps. Arrows that stay within a lane show internal sequence. Arrows that cross a lane boundary show handoffs. Call attention to handoffs visually: some teams use a different color or a thicker line for cross-lane arrows to make them stand out.
At this stage you will often discover steps you missed, or realize that a handoff you thought was simple actually involves three back-and-forth exchanges. That is the diagram working as intended.
Step 6: Validate and refine
Walk through the completed diagram with at least one person who does the work day-to-day. Ask two questions: "Does this match what actually happens?" and "Is anything missing?" Expect to revise. It usually takes two or three iterations before a swimlane diagram reflects reality closely enough to be useful for improvement work.
After validation, layer in additional data if the process warrants it: average time per step, defect rates, backlog sizes. This is the bridge into value stream mapping or a kaizen event.
Swimlane diagram examples
These three examples cover common business processes where cross-functional handoffs cause the most friction.
| Process | Lanes (actors) | Key handoffs |
|---|---|---|
| Employee onboarding | HR, IT, Hiring Manager, Finance, New Employee | HR hands offer letter to candidate; IT receives equipment request from HR; Hiring Manager triggers system access with IT; Finance receives payroll setup from HR |
| Order fulfillment | Customer, Sales, Warehouse, Shipping, Finance | Customer submits order to Sales; Sales confirms and releases to Warehouse; Warehouse notifies Shipping when packed; Shipping triggers invoice in Finance |
| Invoice approval | Vendor, Accounts Payable, Department Manager, Finance Director, Accounting | Vendor submits invoice to AP; AP codes and routes to Department Manager; Manager approves and returns to AP; AP escalates over threshold to Finance Director; Director approves and AP releases to Accounting for payment |
The invoice approval example is particularly useful for revealing why a simple payment sometimes takes three weeks. When you draw the handoffs, you see that an invoice over a certain amount bounces through four different people before it gets paid, and that each bounce introduces an average wait time. Once teams see that, the improvement conversation becomes straightforward.
Best practices (Dos and Don'ts)
| Do | Don't |
|---|---|
| Keep labels to two to five words per step | Write full sentences inside diagram boxes |
| Use three to six lanes for readability | Create a lane for every individual person |
| Validate with people who do the work | Treat a first draft as final |
| Map the actual process first, then the ideal | Start with the future state before documenting the present |
| Use consistent symbol shapes throughout | Mix circle, oval, and rounded-rectangle for the same symbol type |
| Highlight cross-lane arrows visually | Leave all arrows looking identical |
| Note what is transferred at each handoff | Label handoffs with just "sends to" or "notifies" |
Frequently Asked Questions about Swimlane Diagram
What is the difference between a swimlane diagram and a cross-functional flowchart?
They are the same thing. "Cross-functional flowchart" is the more descriptive name for the format. "Swimlane diagram" is the colloquial term based on the visual appearance of the lanes. Both terms refer to a process map organized by actor, with handoffs shown as arrows crossing lane boundaries. Some tools use "pool and lane diagram" as yet another label for the same structure.
When should I use a swimlane diagram instead of a regular flowchart?
Use a swimlane diagram any time more than one role or department is involved in a process and ownership of steps matters. If a single person or team runs the entire process from start to finish, a standard flowchart is simpler and just as useful. The swimlane format adds value specifically when you need to show who does what and where work transfers between parties.
How many lanes is too many?
More than six lanes makes most diagrams difficult to read on a standard page or screen. If your process genuinely involves more than six distinct actors, consider whether some can be grouped or whether the process needs to be split into two separate diagrams covering sub-processes.
What tools are commonly used to draw swimlane diagrams?
Lucidchart, Miro, Microsoft Visio, and Draw.io (Diagrams.net) all support swimlane diagrams natively. For quick workshop sketches, a whiteboard with sticky notes works well: one color per actor, one note per step, tape the sticky notes inside their lanes.
How does a swimlane diagram relate to BPMN?
BPMN (business process model and notation) extends the swimlane format with a standardized, machine-readable symbol set. A swimlane diagram is informal and flexible. BPMN is a formal specification governed by the Object Management Group. Teams doing process documentation or designing processes for automation typically start with a swimlane diagram and formalize it into BPMN later.
Cross-functional work is where most process problems live. Drawing the handoffs explicitly, rather than assuming everyone shares the same mental model, is the first step toward fixing them. A swimlane diagram is rarely the last tool a team uses on a process improvement project, but it is often the one that makes the real problem visible for the first time.
Related reading
- Business Process Mapping: how to document a process end-to-end before diving into improvement
- BPMN: the formal notation standard for process models
- Value Stream Mapping: adds time and waste data on top of a cross-functional flow
- What is a RACI Matrix: the complementary tool for assigning responsibility to roles in any process

Senior Operations & Growth Strategist
On this page
- What is a swimlane diagram?
- Swimlane diagram symbols and notation
- Swimlane diagram vs. flowchart vs. BPMN
- Benefits of swimlane diagrams
- Common mistakes
- How to create a swimlane diagram
- Step 1: Define the scope
- Step 2: Identify the actors and create lanes
- Step 3: List all process steps
- Step 4: Place steps in the correct lanes
- Step 5: Draw the handoffs
- Step 6: Validate and refine
- Swimlane diagram examples
- Best practices (Dos and Don'ts)
- Related reading