Current State vs Future State Mapping Explained
Turn this article into takeaways for your work.
Each assistant summarizes the article only for you and suggests best practices for your work.
Most process improvement efforts stall not because the team lacks ideas, but because nobody has agreed on what the process actually looks like today. Current state and future state mapping fixes that. Together, the two maps give a team a shared picture of where they are, where they want to go, and exactly what stands in the way.
This approach shows up across lean manufacturing, business process reengineering (BPR), kaizen events, and organizational design work. Value stream mapping (VSM) is one well-known application, but the current state and future state concept is broader: it applies to any process you want to improve, from a sales handoff to a patient discharge workflow.
What is current state vs future state mapping?
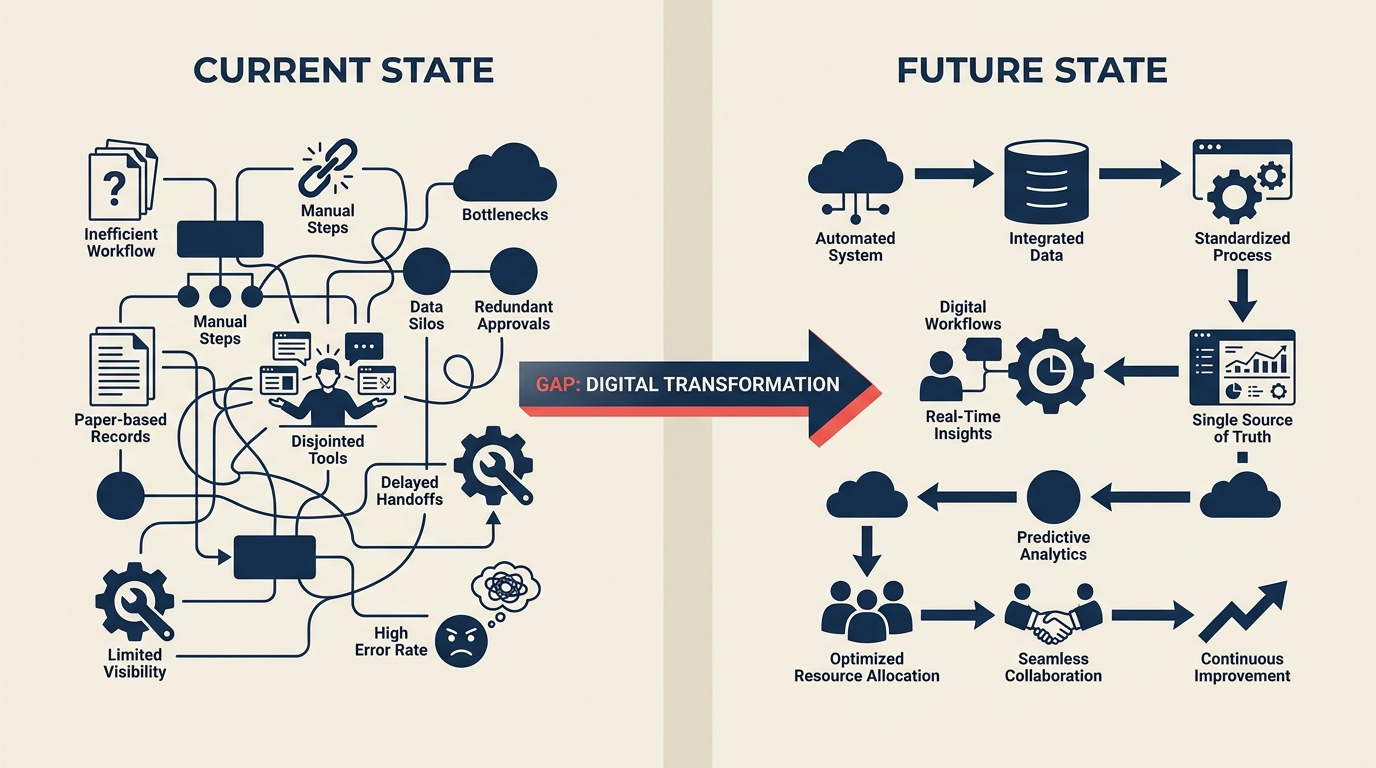
Current state mapping is the practice of documenting a process exactly as it works today: every step, every handoff, every delay, without adding judgment or idealization. Future state mapping is the practice of designing the same process as it should work after targeted improvements are made.
The two maps are always built as a pair. The current state provides the honest baseline. The future state provides the goal. The distance between them, the gap, is where improvement projects live.
This two-map discipline comes from the lean manufacturing tradition. Toyota's engineers drew material and information flow diagrams to show waste in production systems long before the method had a standardized name. When Mike Rother and John Shook published Learning to See (Lean Enterprise Institute, 1999), they formalized the current state and future state structure for VSM, and the approach spread into healthcare, software, finance, and service operations.
But current state and future state maps don't require VSM symbols. A hand-drawn swimlane, a simple flowchart, or even a structured list of process steps can serve the same purpose: capture reality now, design the better version, then close the gap deliberately.
Key Facts
- Studies on lean transformation projects consistently find that the majority of total lead time is waiting, not processing. A landmark finding from Womack and Jones' Lean Thinking (Free Press, 1996) estimated that value-adding activity accounts for around 5% of total elapsed time in most processes.
- A 2019 review in the Journal of Manufacturing Technology Management found that organizations using structured current-to-future state mapping reported waste reductions of 20 to 45% in targeted processes, compared to improvement efforts conducted without explicit state documentation.
- McKinsey research on operational transformations (2020) found that transformation programs with a documented baseline state were 1.5x more likely to sustain their gains at the 18-month mark than those that launched directly into solution design.
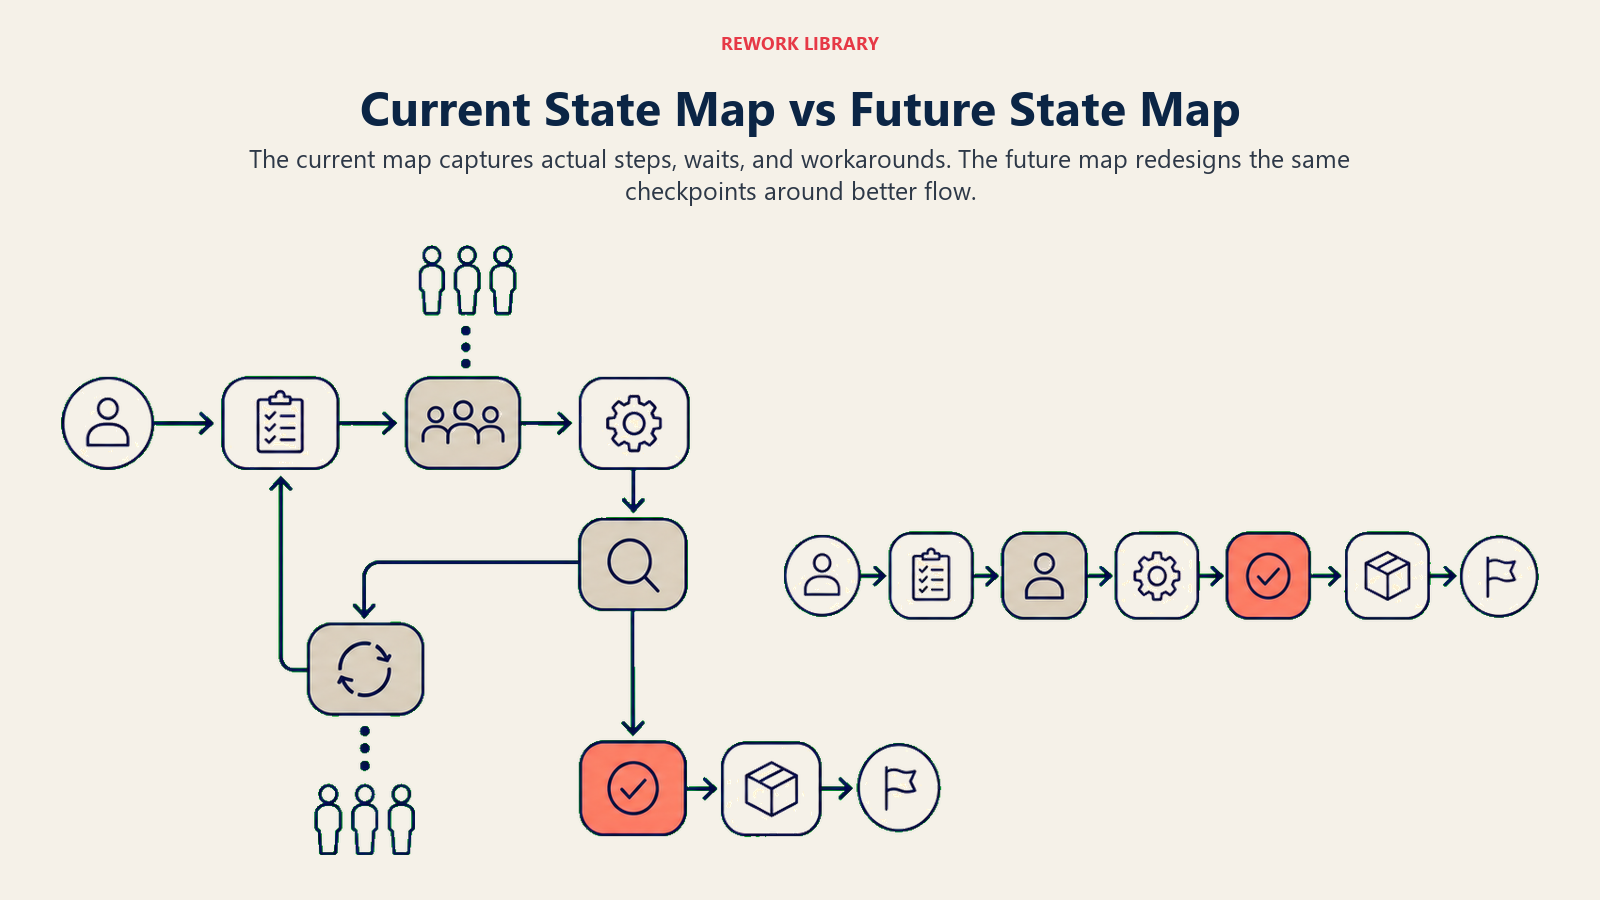
Current state map vs future state map
Both maps describe the same process. What differs is the time horizon and the purpose.
| Dimension | Current state map | Future state map |
|---|---|---|
| Purpose | Capture reality as-is, including waste and friction | Design the improved process after targeted changes land |
| What it shows | Actual steps, handoffs, delays, wait times, workarounds | Streamlined steps, reduced handoffs, flow improvements, new controls |
| When you draw it | At the start of any improvement initiative, before any changes | After analyzing the current state and identifying the gap |
| Who draws it | Cross-functional team who actually does the work | Same team, informed by gap analysis and constraint data |
| Primary output | Shared, agreed-on baseline that eliminates "as intended" assumptions | Target design that defines what success looks like |
| Tone | Descriptive, not evaluative | Aspirational, but constrained by what the process data supports |
One rule holds for both maps: draw what is true, not what should be true. The current state fails if it shows the documented procedure instead of the actual practice. The future state fails if it ignores the constraints the team is actually working within.
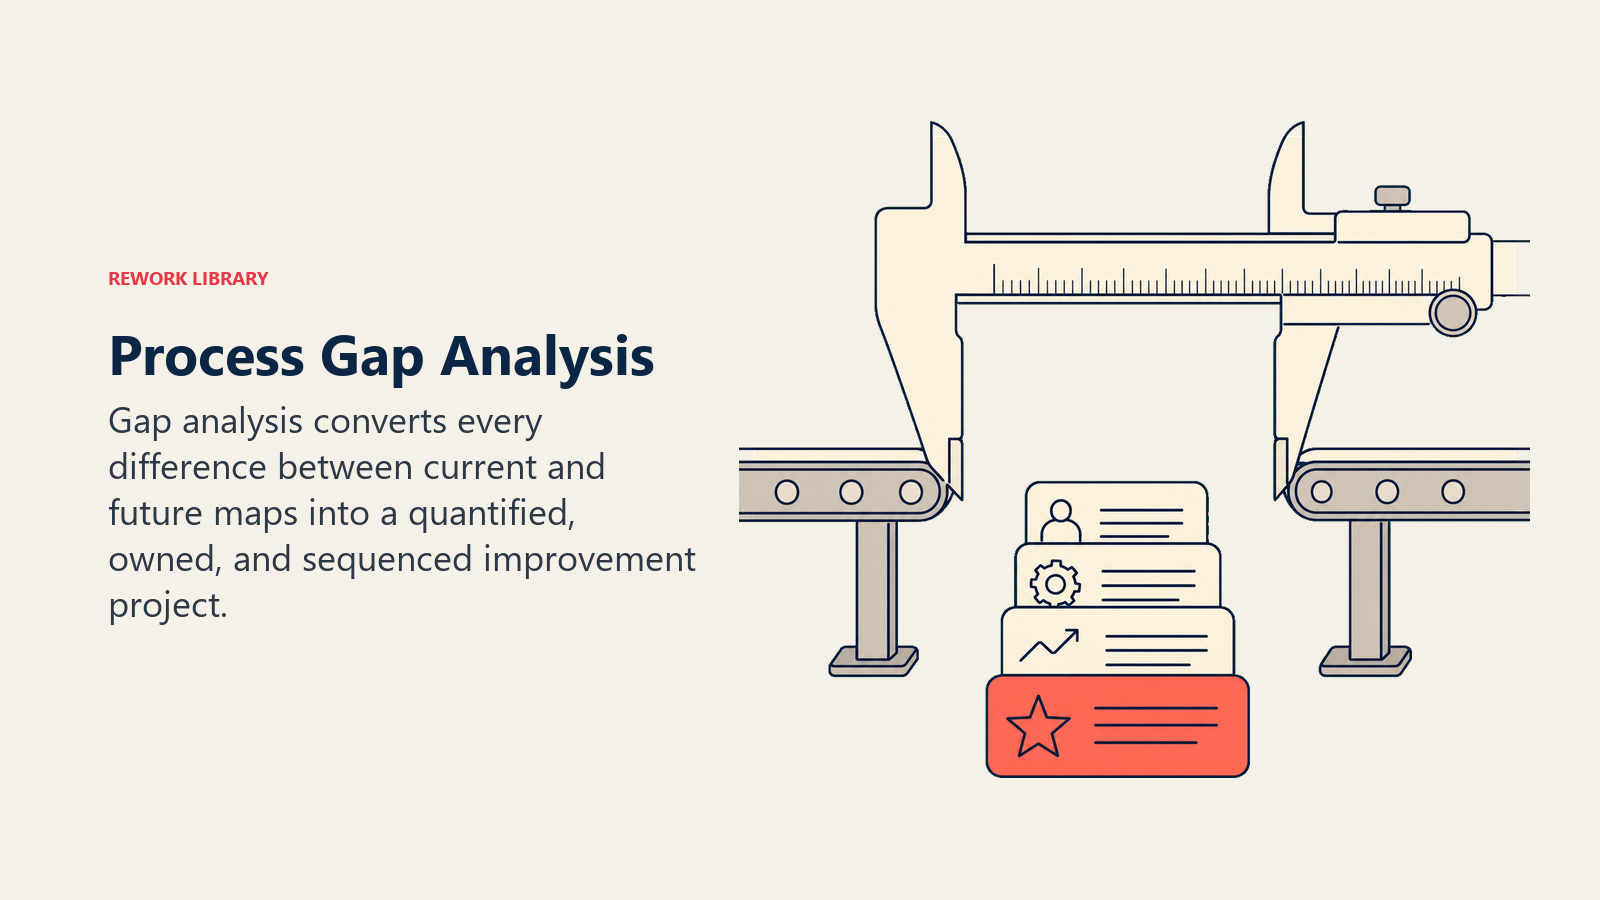
The gap analysis between them
The gap between the current state and the future state is not a failure. It's the work. A clear gap analysis turns two maps into an action plan.
Step 1: Overlay the two maps. Place the current state and future state side by side. Identify every point where they differ. Each difference is a potential improvement project.
Step 2: Categorize the gaps. Not all gaps are equal. Some are quick wins: a decision that adds three days but provides no value could be eliminated in a week. Others are structural: changing a batch-processing step to continuous flow may require new tooling or headcount decisions. Sort by effort and impact before committing to a sequence.
Step 3: Quantify the impact of each gap. Attach numbers where possible. If a queue between two steps currently averages four days and the future state eliminates it, that's four days of cycle time recovered per unit. Quantified gaps build the business case and prioritize the work.
Step 4: Assign ownership and deadlines. Each gap becomes a named improvement project with a responsible owner and a target date. A gap without an owner is a wish, not a plan. In kaizen events, the gap list becomes the agenda for the improvement week.
Step 5: Build the transition plan. Identify the sequence in which gaps should close. Some improvements depend on others landing first. For example, you can't reduce queue time in step three if the upstream step still batches work weekly. Map the dependencies before you start.
The output of a well-run gap analysis is a prioritized improvement roadmap: a list of specific changes, sequenced by dependency and impact, each with an owner and a due date. This is what separates state mapping from decoration. The maps are only useful if they produce this list.
For teams doing a standalone gap analysis outside of a mapping exercise, the gap analysis framework in strategic management covers the broader organizational application of the same concept.
Benefits of state mapping
Done well, current and future state mapping delivers four practical benefits.
Shared understanding. The most common failure mode in process improvement is that different people have different mental models of what the process does. The current state map forces alignment. Once a cross-functional team has walked the process together and agreed on a single diagram, the arguments about "how things work" stop. Decisions speed up.
Visible waste. The current state map shows wait time, rework loops, duplicate steps, and handoff failures that nobody could see when the process lived inside individual teams. Waste that is invisible is impossible to attack. Waste on a map is a target.
A credible improvement case. The future state map, built from real process data rather than aspiration, gives leadership a concrete picture of what the improved process looks like and what it will cost to get there. Improvement proposals built on state maps are harder to dismiss than vague proposals to "make things better."
A sustainability anchor. Once the future state is reached, the future state map becomes the new current state baseline. Teams that skip the mapping step often find that process improvements erode within six to twelve months because nobody documented what "good" looked like. The map locks in the standard.
Common mistakes
Drawing the intended process instead of the actual process. Documented procedures describe how work is supposed to flow. Actual processes have workarounds, informal queues, and undocumented decision points. A current state map built from documentation without going to the gemba to observe the real work will miss the highest-impact waste every time.
Designing the future state in isolation. Future state maps built by a small team in a conference room, without the people who do the work, tend to be technically correct and practically unworkable. The floor always knows constraints that management doesn't. Bring the right people into the room.
Skipping the numbers. A map with no data is an opinion. At minimum, capture the time each step takes and the time work waits between steps. Without these numbers, you can't quantify the gap or measure whether the future state delivered.
Treating "future state" as a permanent endpoint. A future state map is a target for this improvement cycle, not a permanent ceiling. Once implemented, it becomes the new current state, and the next improvement cycle begins. Teams that treat the future state as final stop iterating.
Building the map without cross-functional representation. A map drawn by one department will show one department's perspective. Most process waste lives in the handoffs between departments. You need representatives from every team that touches the process.
Jumping to solutions before agreeing on the current state. It's tempting to start designing the future state while still drawing the current state. But if the team hasn't agreed on what's true today, the future state design will be contested and the gap analysis will be imprecise. Finish the current state first.
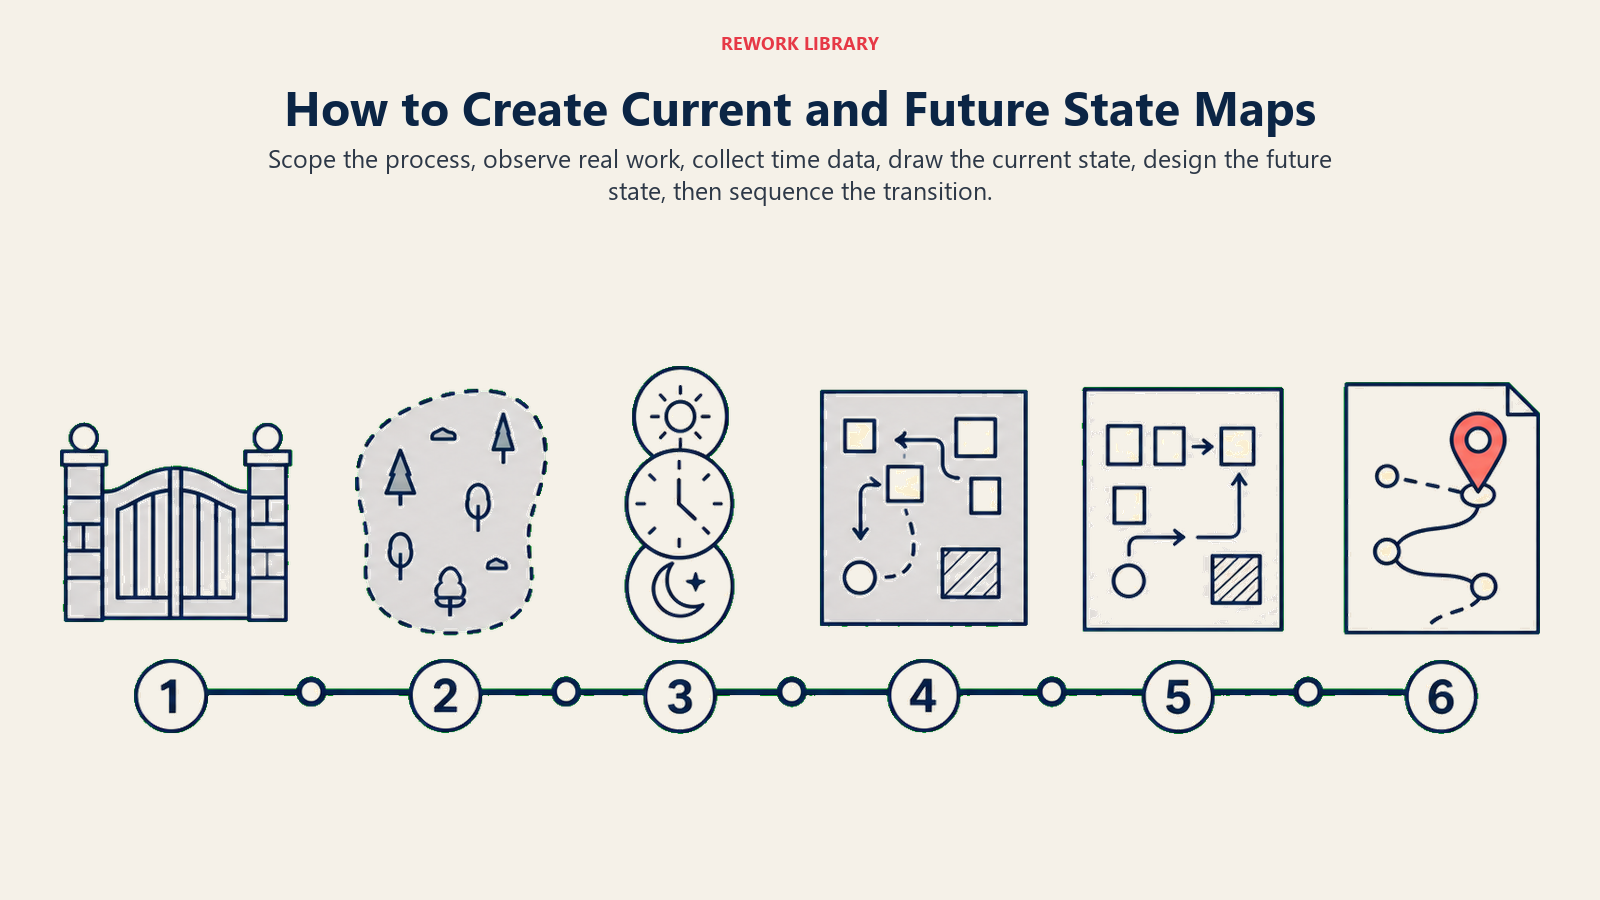
How to create current and future state maps
This six-step approach works for any process, whether you're using VSM symbols, swimlane diagrams, or plain flowcharts.
Step 1: Select the process and define the scope
Pick one process with a clear start point (a trigger: a customer order, a service request, a production release) and a clear end point (a defined output: a delivered order, a resolved ticket, a shipped product). Resist the urge to map everything. A focused map exposes real waste. An enterprise-wide map becomes wallpaper.
Define the scope explicitly: where does this process start, where does it end, and which teams or systems are inside the boundary? Write it down before you start drawing.
Step 2: Walk the process and observe the current state
Go where the work happens. Watch what actually occurs in the order it actually occurs, from trigger to output. Don't rely on procedure documents or manager descriptions. Talk to the people doing each step. Watch for informal queues, workarounds, and decisions that don't show up in any documentation.
This is the gemba walk principle applied to mapping: direct observation beats secondhand knowledge every time.
Step 3: Collect and record the data
For each step in the process, capture at minimum: how long the step takes (cycle time), how long work waits before the step begins (queue time), and who or what triggers the handoff to the next step. Note rework loops, decision points, and any steps where the answer varies by situation.
Record what you observe, not what you hope to find. If a step that should take two hours actually takes two days because of approval delays, write two days.
Step 4: Draw the current state map
Using your observations and data, draw the complete current state. Include every step, every handoff, every queue. Label each step with its cycle time and label each queue with its average wait time. Use whatever format your team can read: VSM symbols if you're doing a lean mapping session, a swimlane if the handoffs between teams are the main story, a simple flowchart if that's clearest.
Validate the map with the team. Walk through it together. Correct anything that doesn't reflect what was observed. The current state map is only useful if everyone who touches the process can look at it and say "yes, that's actually what happens."
Step 5: Design the future state map
Using the current state as your foundation, design the improved process. Ask: which steps add no customer value and can be eliminated? Where does work wait unnecessarily and why? Which handoffs create delays that a different trigger or a pull signal could eliminate? Where is rework happening that a process control could prevent?
The future state should be a realistic target achievable within the improvement timeline, not a fantasy. If your improvement cycle is a 90-day kaizen project, the future state should be achievable in 90 days. If it's a longer business process reengineering initiative, it can be more ambitious.
Step 6: Run the gap analysis and build the transition plan
Compare the current state and future state maps. List every point of difference. For each gap, estimate the effort to close it, the impact on cycle time or quality, and the dependencies between changes. Sequence the improvements by dependency and impact. Assign owners and deadlines. This transition plan is the direct output of the mapping work and the primary input to your improvement sprints or kaizen events.
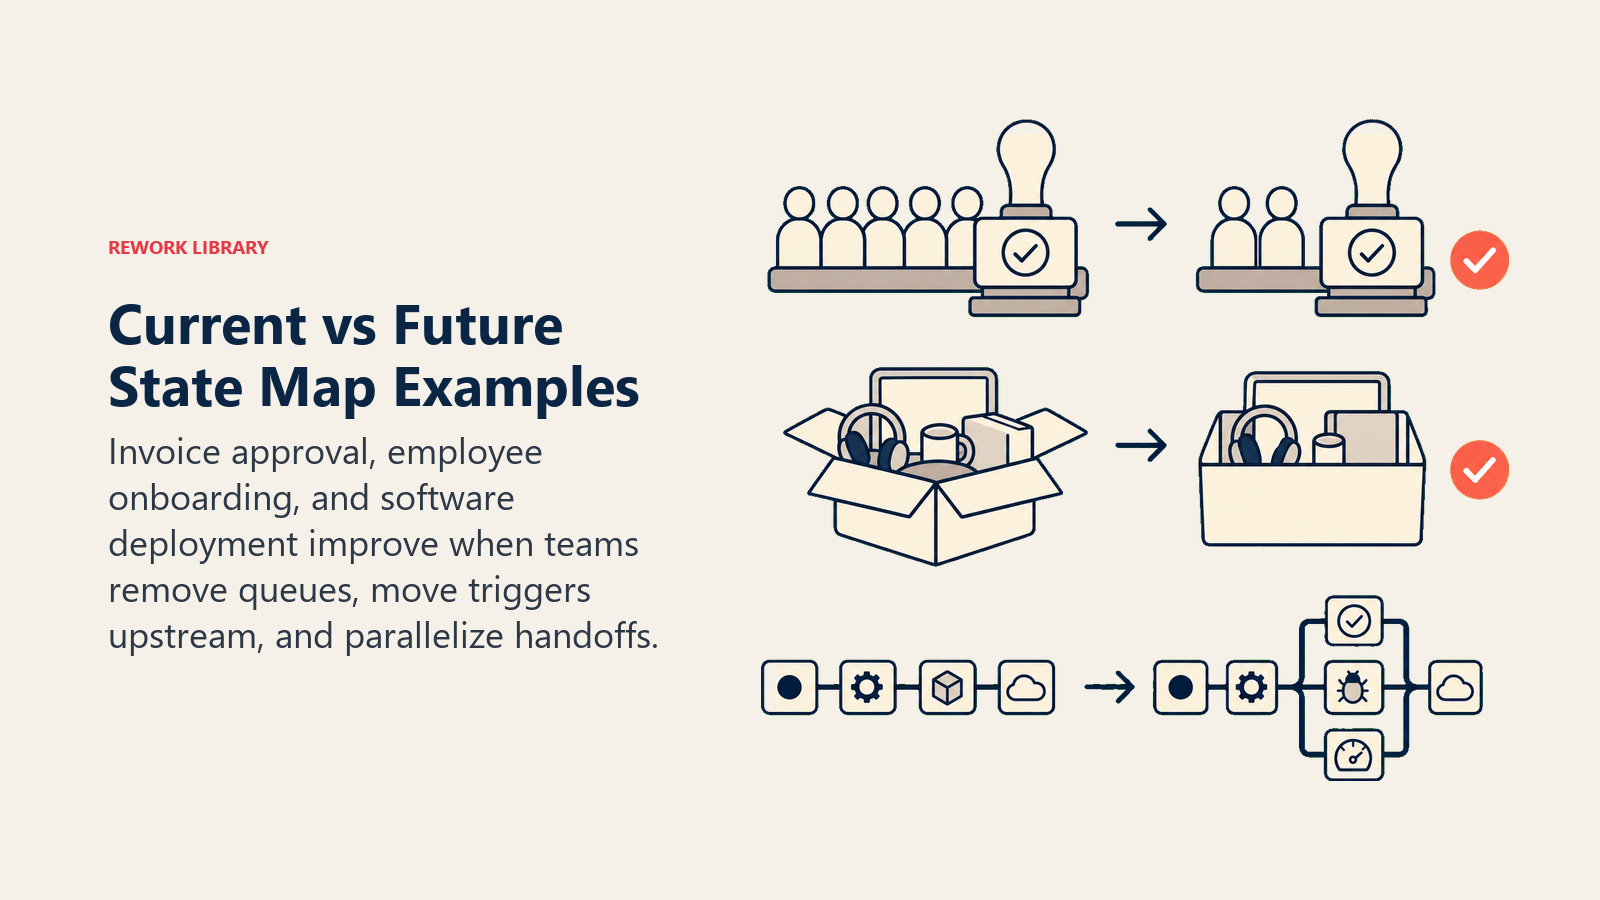
Current vs future state map examples
These examples show how teams turn observed delays and workarounds into a clearer target flow and a specific gap to close.
| Industry | Current state | Future state | Gap closed |
|---|---|---|---|
| Invoice processing (finance) | Invoices sit in a shared email inbox for 2 days before review. Manager reviews weekly in a batch. Approval chain requires 3 signatures for any amount. Total lead time: 5 days. | Invoices auto-routed by amount. Amounts under $10,000 require one approval. Manager reviews on receipt, not in batches. Total lead time: under 8 hours. | Batch processing eliminated. Approval policy redesigned. Queue time cut from 4 days to under 4 hours. |
| New employee onboarding (HR/IT) | IT provisioning starts on day one only after HR formally closes the offer. New hire waits 2 days for equipment and 3 days for system access. Parallel work orders not tracked. | IT provisioning triggered when offer is accepted (not on day one). Equipment ships before start date. System access ready by 9 AM on day one. | Lead time cut from 5 days post-start to zero. Trigger point moved upstream. |
| Software deployment (engineering) | Code review, QA, and staging are sequential. Each handoff requires a ticket in a separate queue. Deployment takes 4 to 6 days from merge request to production. | Code review and automated testing run in parallel. QA accesses staging directly from the CI pipeline without a manual ticket. Deployment: under 1 day. | Sequential handoffs replaced with parallel flows. Manual ticket handoffs automated. |
Best practices
| Do | Don't |
|---|---|
| Walk the process physically before drawing anything | Build the current state from documentation alone |
| Include the people who do the work in both mapping sessions | Design the future state with management only |
| Attach time data to every step and every queue | Leave the maps qualitative with no numbers |
| Validate the current state map before moving to future state | Start designing improvements before the baseline is agreed |
| Treat the future state as a time-bounded target, not a permanent goal | Declare victory once the future state is reached and stop iterating |
| Sequence improvement projects by dependency, not enthusiasm | Launch all gap-closing projects simultaneously without a transition plan |

Senior Operations & Growth Strategist
On this page
- What is current state vs future state mapping?
- Current state map vs future state map
- The gap analysis between them
- Benefits of state mapping
- Common mistakes
- How to create current and future state maps
- Step 1: Select the process and define the scope
- Step 2: Walk the process and observe the current state
- Step 3: Collect and record the data
- Step 4: Draw the current state map
- Step 5: Design the future state map
- Step 6: Run the gap analysis and build the transition plan
- Current vs future state map examples
- Best practices