Cost of Quality (COQ): The 4 Categories
Turn this article into takeaways for your work.
Each assistant summarizes the article only for you and suggests best practices for your work.
Cost of Quality (COQ) is the total price a business pays to deliver products or services that meet standards. It includes the money spent making sure things go right and the money lost when they don't. Once you see the full number, it rarely stays invisible in a budget meeting.
Most teams track only the obvious costs: returned goods, warranty claims, maybe some rework hours. But those are just the tip. COQ captures the full picture and, more importantly, shows you exactly where to act to shrink it.
What is cost of quality?
Key facts
- Quality costs typically run 5-25% of annual sales revenue, according to the American Society for Quality (ASQ, 2023).
- The cost of poor quality (CoPQ) alone averages 10-15% of revenue for manufacturers without a formal quality program (ASQ, 2022).
- Companies that invest heavily in prevention typically reduce total COQ by 20-40% within two years (Juran Institute benchmarks, referenced in ASQ literature).
Cost of Quality (COQ) is the sum of all costs that arise from ensuring products or services meet quality standards, plus all costs incurred when they fail to. It is not just a defect count or a warranty reserve. It is a financial model that maps quality spending to business outcomes.
The term was popularized by quality pioneer Philip Crosby in the 1970s and later formalized by Joseph Juran. The core idea: quality isn't free, but poor quality is far more expensive. COQ gives you the math to prove it.
COQ has two major branches:
- Cost of Good Quality (CoGQ): what you spend to prevent and detect defects before they reach customers.
- Cost of Poor Quality (CoPQ): what you lose when defects occur, either before or after delivery.
Measuring both gives operations and finance teams a shared language. Instead of arguing about whether a quality initiative is "worth it," you can show that spending $50,000 on prevention avoids $400,000 in failure costs. That's a conversation that gets budget approved.
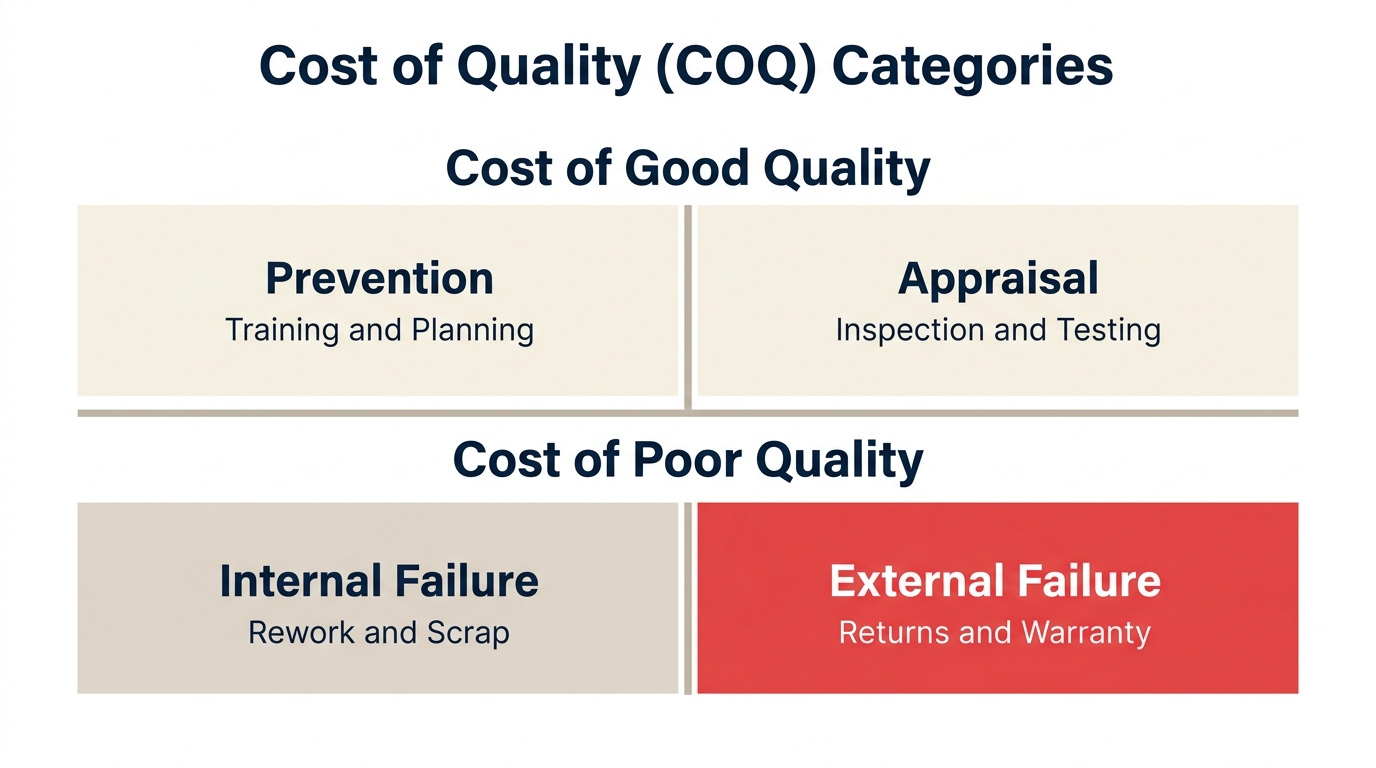
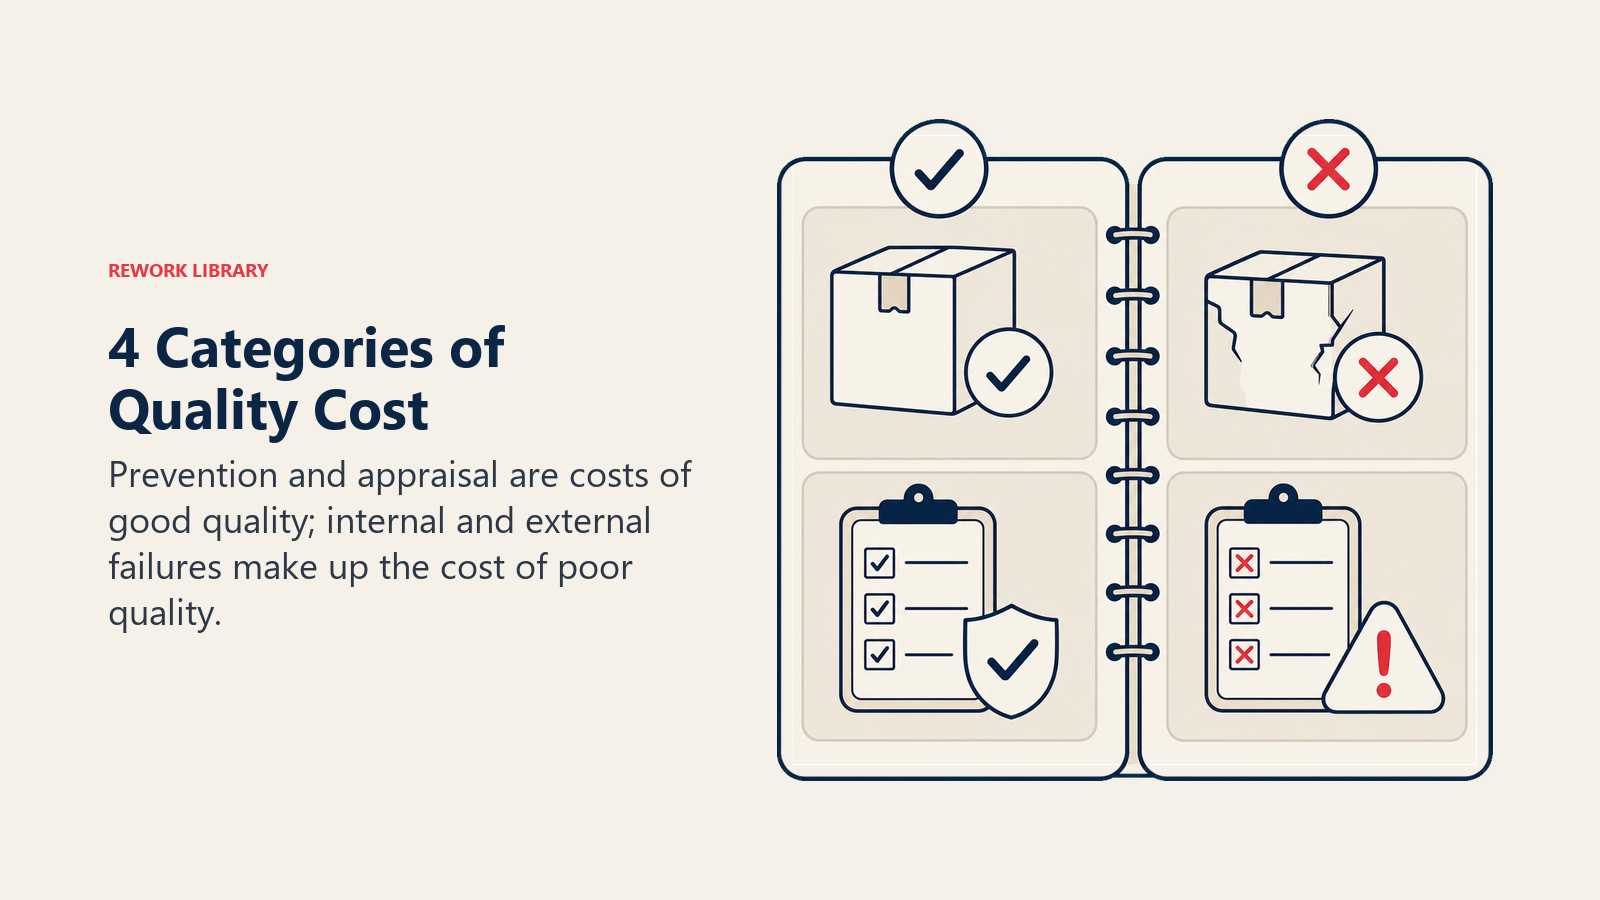
The 4 categories of quality cost
COQ breaks into four categories, grouped under the two branches above.
Cost of Good Quality (CoGQ)
| Category | Definition | Examples |
|---|---|---|
| Prevention | Costs of actions taken to stop defects from occurring in the first place | Employee training, supplier qualification, process design reviews, quality planning, mistake-proofing (poka-yoke), design of experiments |
| Appraisal | Costs of inspecting and testing to detect defects before delivery | Incoming material inspection, in-process testing, final product audits, lab fees, calibration of test equipment, software QA testing |
Prevention and appraisal are intentional investments. You choose to spend money here to protect the customer and the brand.
Cost of Poor Quality (CoPQ)
| Category | Definition | Examples |
|---|---|---|
| Internal Failure | Costs of defects found before the product or service reaches the customer | Scrap, rework, re-inspection, downtime caused by defects, yield losses, expediting to recover schedule |
| External Failure | Costs of defects discovered after delivery to the customer | Warranty claims, product returns, customer complaint handling, field service, recalls, lost future sales, regulatory fines, reputational damage |
External failure is the most expensive category by a wide margin. By the time a defect reaches a customer, you've already paid for all the production steps that created the defective unit, and now you're paying again to fix it, replace it, and repair the relationship.
A simple way to remember the grouping: if you're spending money to prevent or catch problems, it's CoGQ. If you're spending money because a problem already happened, it's CoPQ.
The cost of quality formula
The formula is straightforward:
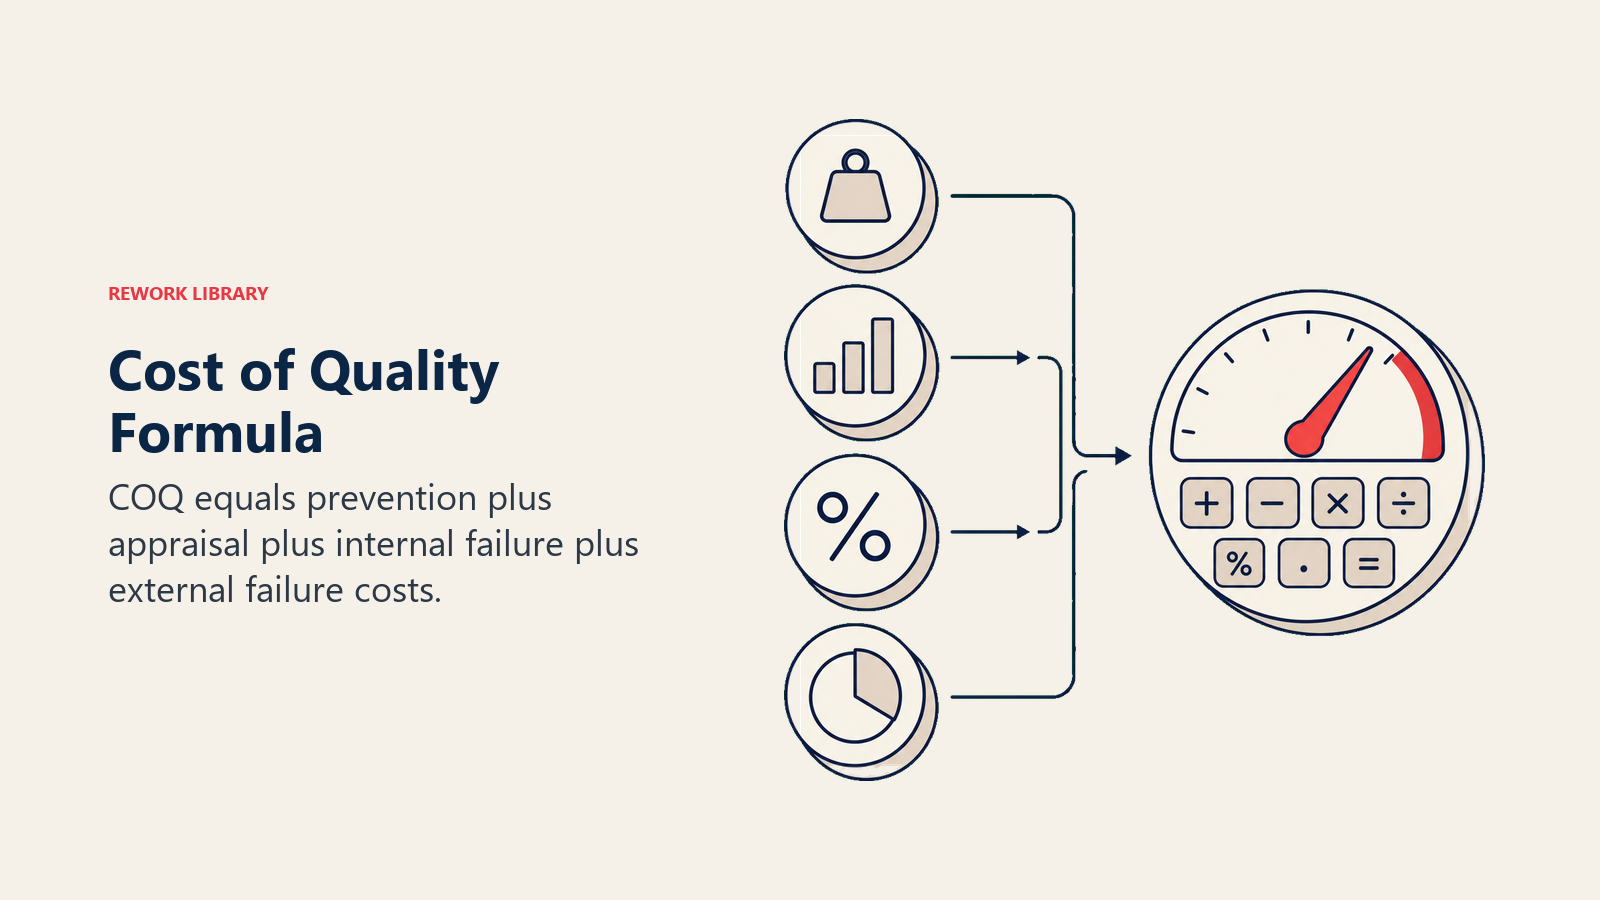
COQ = CoGQ + CoPQ
Where:
- CoGQ = Prevention Costs + Appraisal Costs
- CoPQ = Internal Failure Costs + External Failure Costs
So in full: COQ = Prevention + Appraisal + Internal Failure + External Failure
Worked example
Suppose a mid-sized electronics manufacturer tracks the following costs for one quarter:
| Category | Amount |
|---|---|
| Prevention (training, process design) | $120,000 |
| Appraisal (testing, inspection) | $80,000 |
| Internal Failure (scrap, rework) | $210,000 |
| External Failure (warranty, returns) | $340,000 |
| Total COQ | $750,000 |
CoGQ = $120,000 + $80,000 = $200,000 CoPQ = $210,000 + $340,000 = $550,000 Total COQ = $750,000
In this case, CoPQ is 73% of total quality costs. That ratio is common in companies without a mature quality program and it signals a clear opportunity: shift investment from fixing failures to preventing them.
Expressed as a percentage of quarterly revenue (say, $6M), this company spends 12.5% of revenue on quality costs. Reducing that to 6% would add $375,000 straight to the bottom line.
Why prevention beats inspection
There's a principle in quality management called the 1-10-100 rule. It states that:
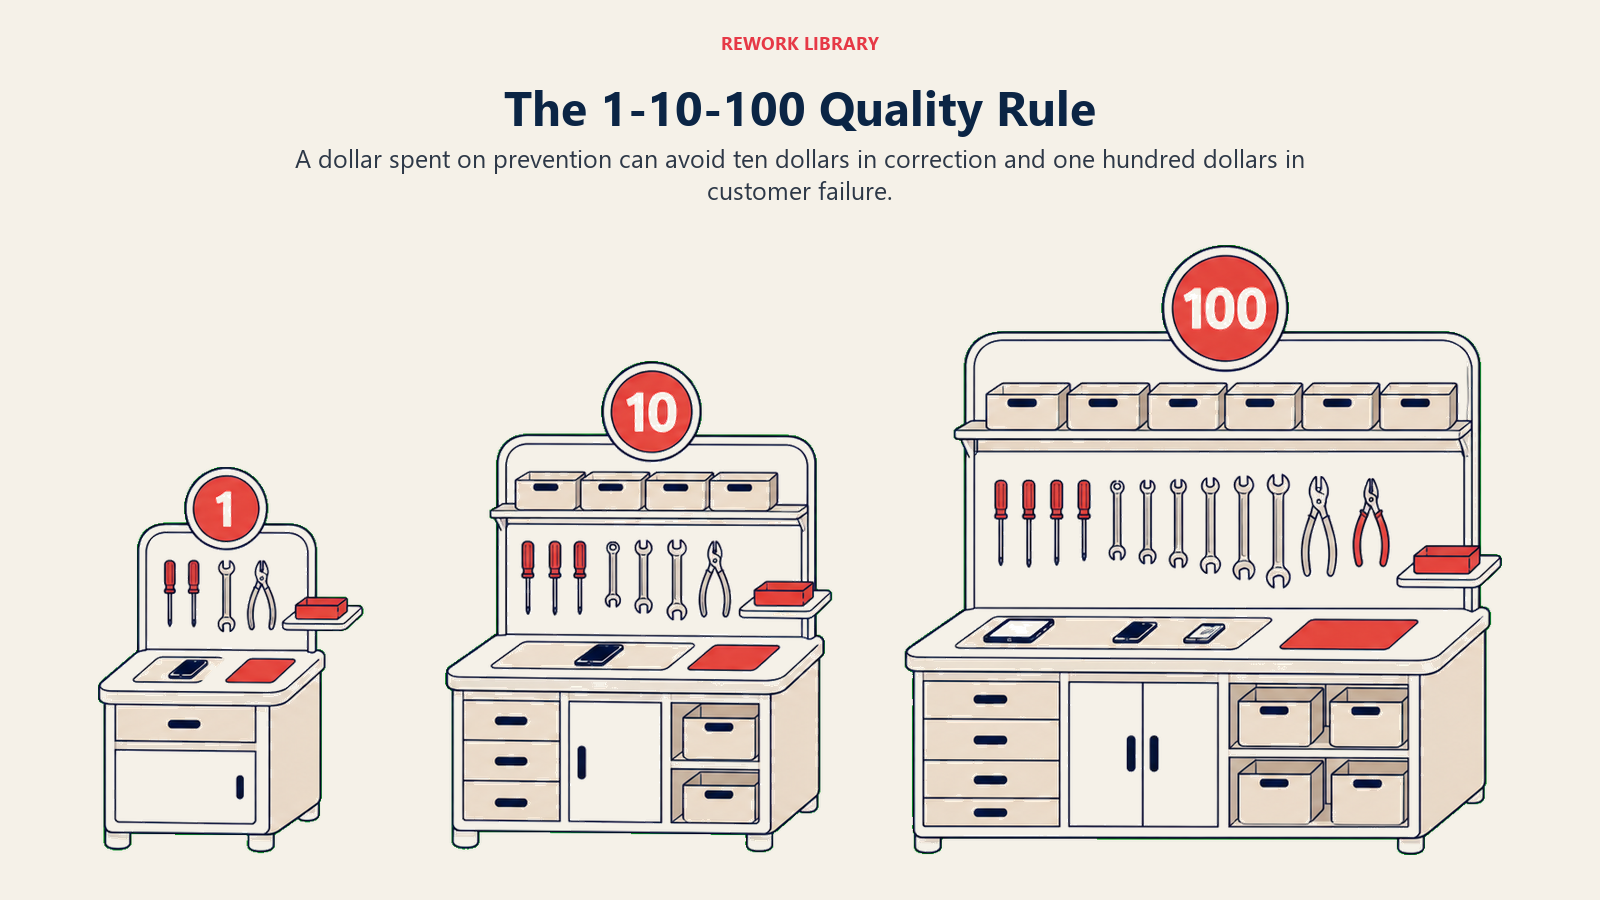
- It costs $1 to prevent a defect.
- It costs $10 to catch and fix it during inspection or testing.
- It costs $100 (or more) to fix it after it reaches the customer.
The ratio varies by industry. In automotive or aerospace, the external failure multiplier can reach 1,000x. But the directional message holds everywhere: the further a defect travels, the more it costs.
This is why mature quality programs deliberately shift spending toward prevention. Training engineers on design for manufacturability, conducting FMEA (Failure Mode and Effects Analysis) during product development, and implementing statistical process control on the production floor all cost money upfront. But each of these reduces the probability of a defect reaching inspection, let alone a customer.
Appraisal costs (inspection and testing) are a necessary part of any program, but they don't reduce the underlying defect rate. They only catch defects that already exist. Prevention reduces the defect rate at the source.
Benefits of measuring cost of quality
Tracking COQ consistently delivers several practical advantages.
It makes quality visible to finance. Quality managers often struggle to justify headcount or tooling investments because the returns are invisible until you measure them. A COQ model translates "fewer defects" into dollars saved.
It focuses improvement efforts. When you break down COQ by product line, process step, or supplier, you can see exactly where CoPQ is concentrated. That's where root cause analysis and Pareto analysis should start.
It tracks whether improvements are working. Run COQ monthly or quarterly and you get a leading indicator of process health. If internal failure costs are dropping after a training program, the data confirms the investment is working.
It supports Six Sigma and continuous improvement programs. COQ is one of the foundational metrics in Six Sigma DMAIC projects. Quantifying the current CoPQ at the define stage justifies the project scope. Reducing it at the control stage confirms success.
It helps prioritize capital. Two improvement projects can both look attractive in isolation. COQ data lets you rank them by their expected reduction in failure costs, so you fund the higher-return project first.
Common mistakes
Counting only visible failure costs. Most companies already capture warranty expense and product returns. But internal failures like scrap, rework, and yield losses are often buried in manufacturing overhead, making the true CoPQ look smaller than it is.
Ignoring hidden failure costs. External failure costs include lost future sales from dissatisfied customers, but these rarely show up in accounting. They're real and can dwarf the direct costs.
Treating prevention and appraisal as equally valuable. A high appraisal budget with a low prevention budget signals you're spending on catching defects rather than stopping them. Rebalancing toward prevention usually reduces total COQ faster.
Tracking COQ sporadically. A one-time COQ audit tells you where you are. Monthly tracking tells you whether you're improving. The trend line is what drives decisions.
Mixing up COQ and CoPQ. CoPQ is a subset of COQ, not a synonym. COQ includes spending on good quality (prevention and appraisal) as well. Confusing the two leads to incomplete analysis.
How to calculate and reduce cost of quality
Step 1: Set up your data categories
Map each quality-related expense to one of the four COQ categories. Work with finance to identify where prevention, appraisal, internal failure, and external failure costs currently appear in your chart of accounts. Some costs will need to be estimated or apportioned (e.g., a quality engineer's time split between training and inspection).
Step 2: Collect baseline data
Run a full quarter of data before drawing conclusions. One month has too much noise. You want to see seasonal patterns, batch effects, and whether a recent improvement initiative shows up in the numbers.
Use process KPIs to connect COQ to operational metrics like defect rate, first pass yield, and DPMO (Defects Per Million Opportunities).
Step 3: Calculate your COQ ratio
Divide total COQ by revenue (or total cost of goods sold) to get a percentage. This makes the number comparable across periods and across business units of different sizes. Use this ratio as your baseline.
Step 4: Identify the highest-impact failure categories
Break down CoPQ by product line, production line, or supplier. Use Pareto analysis to find the 20% of defect sources causing 80% of failure costs. Those are your targets.
Step 5: Shift investment toward prevention
For each major CoPQ source, design a prevention action: a training program, a design review, a statistical process control chart, a supplier qualification check. Track whether that prevention investment reduces the failure cost in subsequent quarters. Iterate.
Cost of quality examples by function
| Function / Industry | Prevention example | Appraisal example | Internal Failure example | External Failure example |
|---|---|---|---|---|
| Manufacturing | Design of experiments before launch | Final assembly inspection | Scrapped components from a tooling defect | Product recall for a field safety issue |
| Software | Code review standards and pair programming | Automated regression test suite | Bug triage and rework sprint | Emergency patch for a production outage |
| Healthcare | Staff training on hand hygiene protocols | Pre-surgery checklist audits | Medication dispensing error caught before administration | Patient harm from a missed diagnosis |
| Financial Services | Credit policy review and staff certification | Loan documentation audit | Internal error correction before client reporting | Regulatory fine for a compliance failure |
| Retail / E-commerce | Supplier packaging standards | Quality check on inbound shipments | Returns processing for mislabeled items | Negative reviews and refunds for defective products |
Across every industry, the pattern repeats: prevention costs a fraction of what failure costs. The industries with the lowest total COQ ratios are almost always the ones with the strongest prevention programs.
Frequently Asked Questions about Cost of Quality
What's the difference between COQ and CoPQ?
COQ is the total cost of all quality-related spending. It includes both the money spent achieving quality (prevention and appraisal) and the money lost when quality fails (internal and external failures). CoPQ, or Cost of Poor Quality, is only the failure portion. COQ = CoGQ + CoPQ.
What is a good COQ benchmark?
ASQ data suggests that companies with immature quality programs typically see COQ at 5-25% of sales. Companies with well-developed quality systems often get below 2-5%. The target isn't zero (prevention spending is valuable), but shifting the ratio strongly toward prevention is a clear sign of a healthy program.
How does COQ relate to [Total Quality Management](/libraries/process-management/total-quality-management)?
COQ is one of the core measurement tools inside a Total Quality Management (TQM) framework. TQM provides the culture and philosophy; COQ provides the financial scorecard that shows whether TQM initiatives are delivering results.
Can COQ be used in service industries?
Yes. The categories map directly: a customer service center spends on training (prevention), call monitoring (appraisal), re-processing errors before they escalate (internal failure), and customer churn from bad experiences (external failure). Service companies often find their external failure costs are even higher as a share of revenue than manufacturers, because service defects are more visible to the customer.
How often should we calculate COQ?
Monthly is the most useful frequency for operational decisions. Quarterly is acceptable for strategic reviews. Annual-only is not frequent enough to guide improvement projects. Measuring COQ won't fix quality problems on its own. But it does make them undeniable. When your CoPQ sits at 12% of revenue and your prevention budget is 2%, the next conversation with leadership writes itself. The companies that move fastest on quality are the ones that learned to speak in those numbers.
Related reading

Senior Operations & Growth Strategist
On this page
- What is cost of quality?
- The 4 categories of quality cost
- Cost of Good Quality (CoGQ)
- Cost of Poor Quality (CoPQ)
- The cost of quality formula
- Worked example
- Why prevention beats inspection
- Benefits of measuring cost of quality
- Common mistakes
- How to calculate and reduce cost of quality
- Step 1: Set up your data categories
- Step 2: Collect baseline data
- Step 3: Calculate your COQ ratio
- Step 4: Identify the highest-impact failure categories
- Step 5: Shift investment toward prevention
- Cost of quality examples by function
- Related reading