Process KPIs: Metrics That Track Performance
Turn this article into takeaways for your work.
Each assistant summarizes the article only for you and suggests best practices for your work.
Process key performance indicators (KPIs) are the numbers that tell you whether a process is working the way it should. Without them, "we're running well" is just a feeling. With the right process KPIs, it's a verifiable fact.
Key facts
- Companies that use data-driven performance metrics are 23 times more likely to acquire customers and 6 times more likely to retain them (McKinsey, 2023).
- Only 23% of organizations say they successfully translate strategy into measurable operational targets (Gartner, 2022).
- Teams with clearly defined KPIs are 2x more likely to hit their operational goals than teams that rely on ad-hoc reporting (Harvard Business Review, 2021).
What are process KPIs?
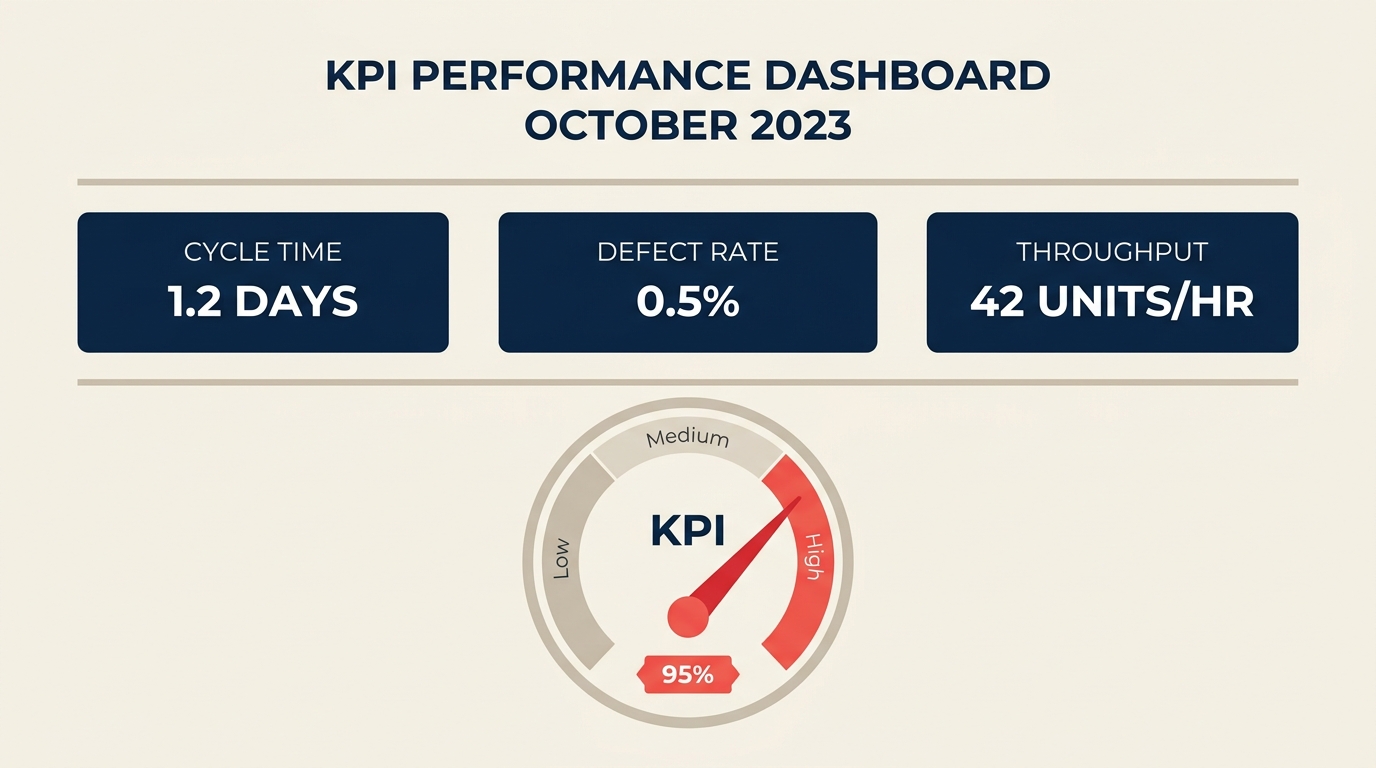
Process KPIs are metrics that measure how well a specific process performs against its intended goals. They track the behavior of the process itself: how fast, how accurate, how costly, how consistent.
That's different from outcome KPIs, which measure what happened as a result of running the process. Revenue, customer satisfaction scores, and market share are outcome KPIs. They tell you what you got. Process KPIs tell you how you got there, or why you didn't.
Think of it this way: "our win rate dropped 12%" is an outcome. "Our lead response time increased from 4 hours to 11 hours this quarter" is a process KPI. The second one points to where to fix things.
Process KPIs sit closer to the work. They're operational, repeatable, and tied to specific activities rather than final results.
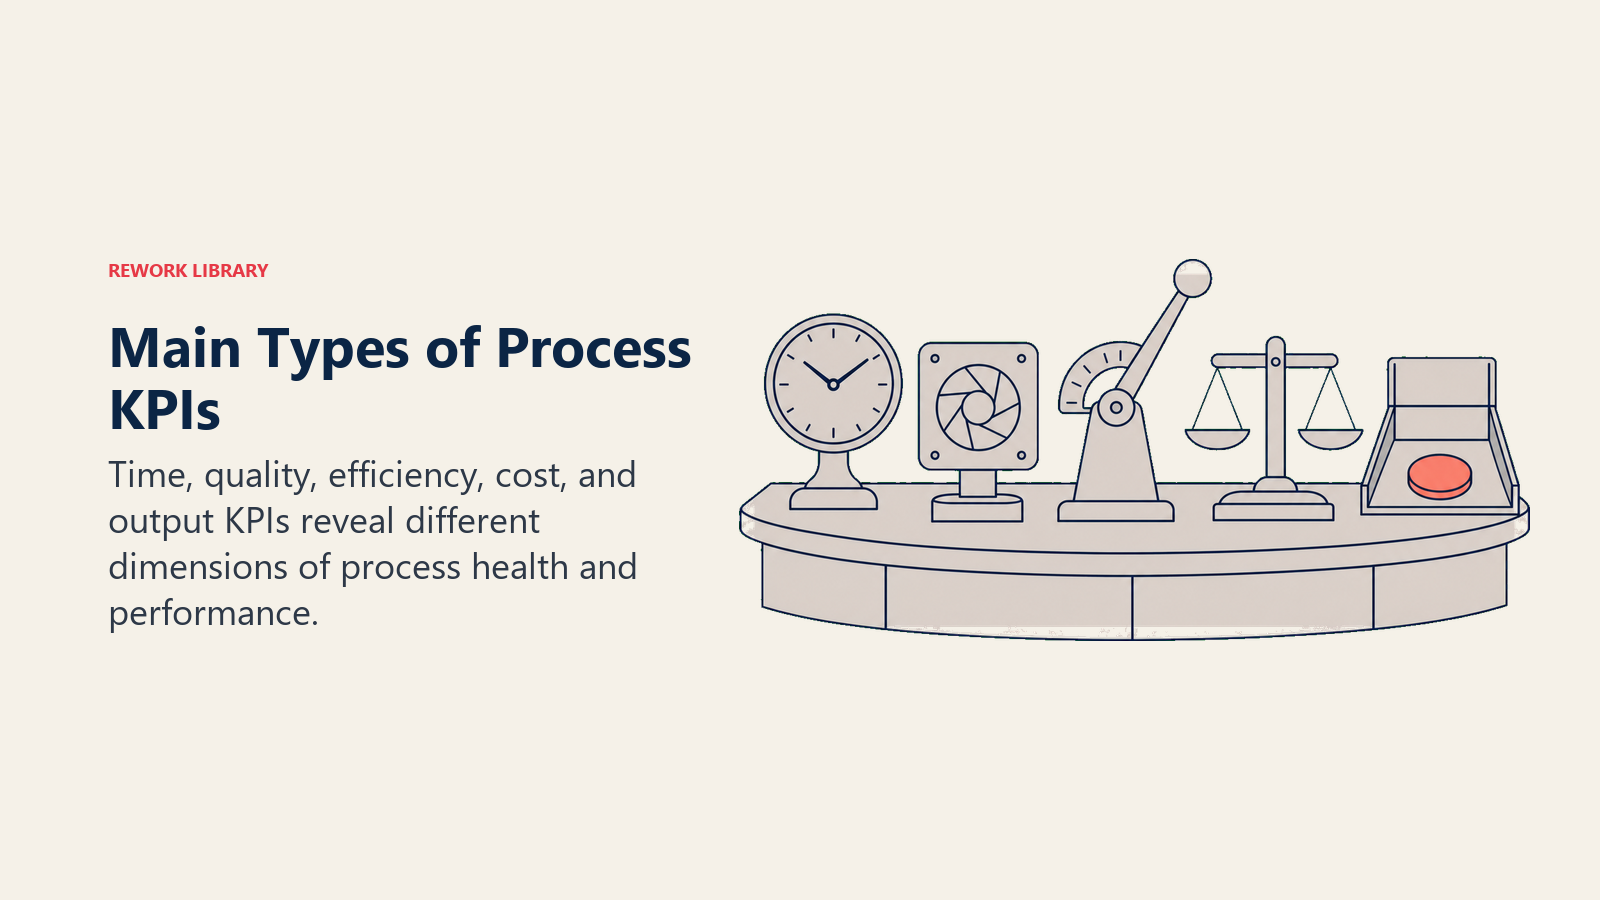
The main types of process KPIs
Most process KPIs fall into four core dimensions: efficiency, quality, cost, and time. Here's how they break down in practice.
| Dimension | KPI | Formula | What "good" looks like |
|---|---|---|---|
| Efficiency | Throughput | Units completed / time period | Increases over time without quality drop |
| Efficiency | Utilization rate | (Actual output / max capacity) x 100 | 75-85% (above 90% risks burnout/errors) |
| Quality | Defect rate | (Defective units / total units) x 100 | Below 1-3% depending on industry |
| Quality | First pass yield (FPY) | (Units passing first time / total units) x 100 | Above 95% in high-quality operations |
| Cost | Cost per transaction | Total process cost / number of transactions | Decreasing quarter-over-quarter |
| Cost | Cost of quality | (Prevention + appraisal + failure costs) / total output | Below 10% of revenue in mature operations |
| Time | Cycle time | End time minus start time per unit | Decreasing trend; benchmarked against industry |
| Time | On-time delivery rate | (On-time completions / total completions) x 100 | Above 95% for most service-level agreements |
Pick one or two per dimension to start. A dashboard with twelve metrics often performs worse than one with four sharp ones.
Leading vs lagging process indicators
Not every process KPI behaves the same way. Some predict performance before it happens. Others confirm what already occurred.
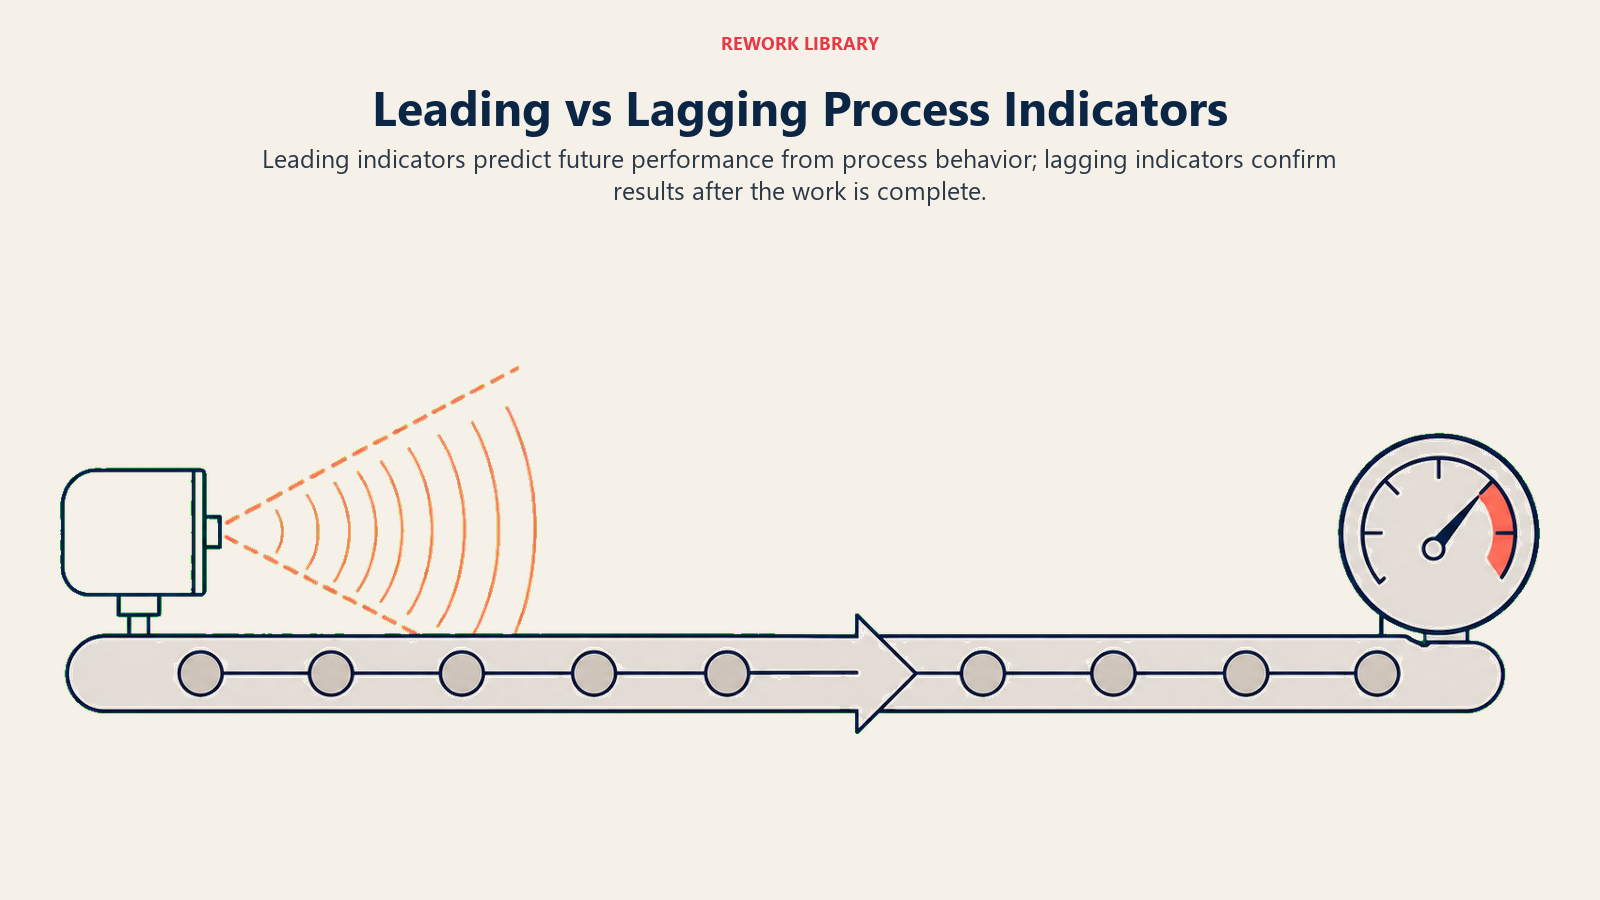
Lagging indicators measure past outcomes: defect rate last month, average cycle time this quarter, cost per transaction year-to-date. They're precise but backward-looking. By the time you see a problem, it may have compounded.
Leading indicators signal what's about to happen. Queue length, rework requests, and unplanned overtime are leading signals. A rising queue today usually means a spike in cycle time next week. Catching it early lets you act before the outcome KPI suffers.
Strong process monitoring blends both. Use leading indicators to trigger early action. Use lagging indicators to confirm whether the fix worked.
Statistical process control gives you tools to distinguish real signals from normal variation, so you don't overreact to noise in either type of indicator.
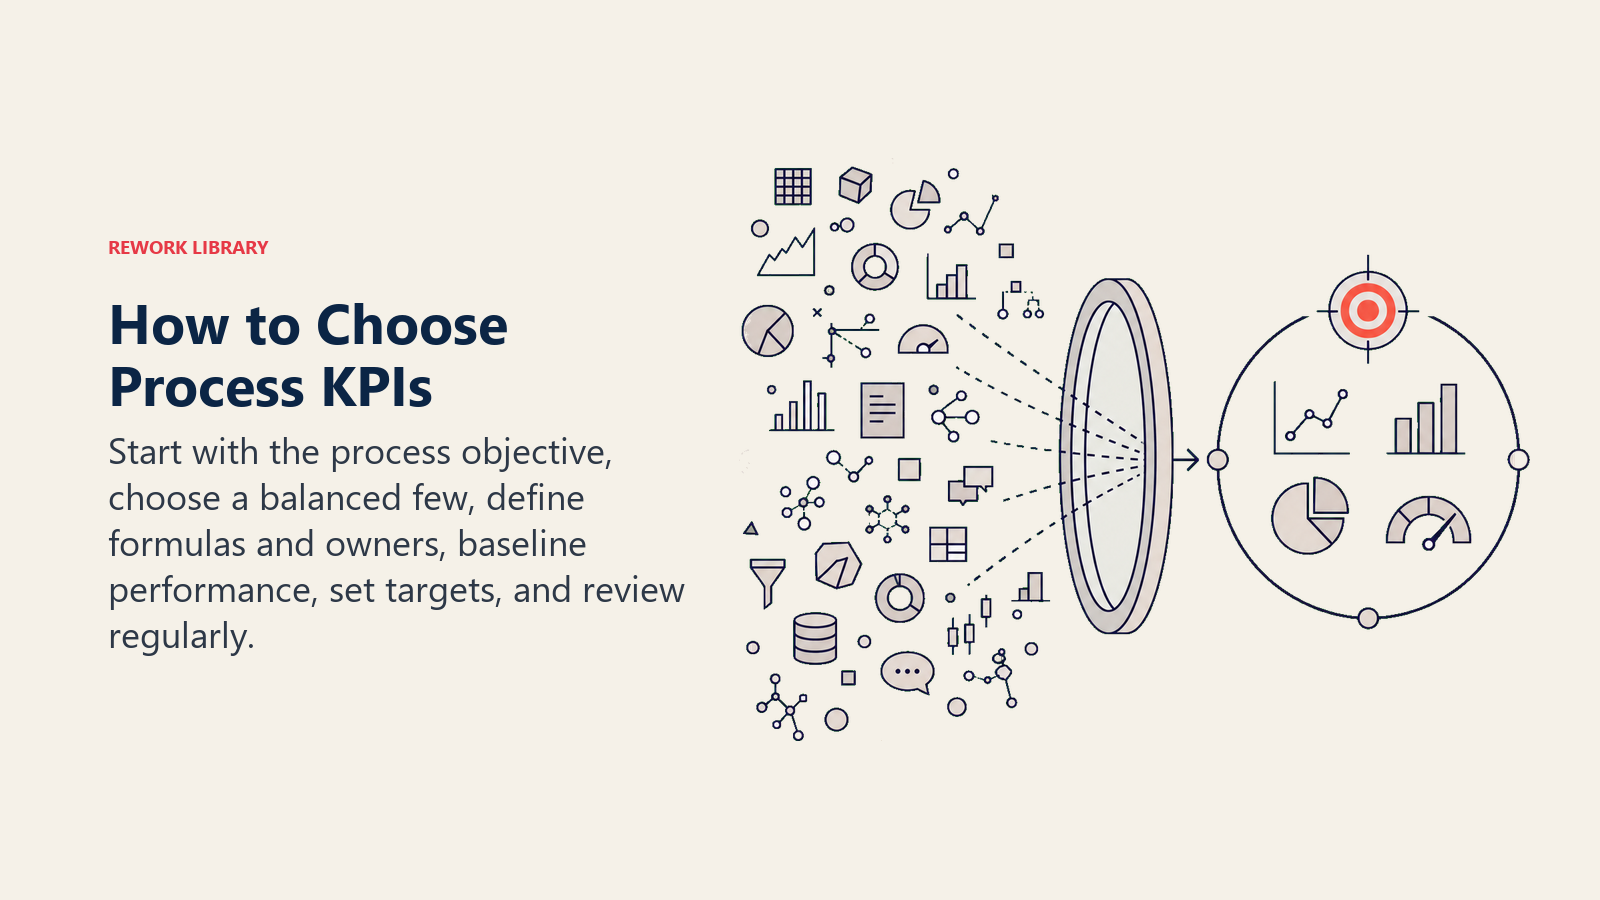
How to choose the right process KPIs
Step 1: Tie KPIs to a specific process goal
Start with what the process is supposed to achieve. A customer onboarding workflow has different goals than a manufacturing line. The KPI must connect to that purpose directly.
If the goal is to onboard customers faster, measure time-to-activation, not overall satisfaction. Satisfaction matters, but it's an outcome. Time-to-activation is what you can actually change at the process level.
Step 2: Pick three to five, not fifteen
Every KPI costs attention. Teams that track too many metrics end up optimizing none of them. Pick the fewest metrics that give you a clear picture of process health.
A good filter: "If this number moves significantly, would we change how we run the process?" If yes, it's worth tracking. If the answer is "maybe" or "not really," cut it.
Step 3: Define the formula precisely
Vague KPIs generate arguments, not improvements. "Cycle time" means nothing until you define exactly when the clock starts and stops. Does it begin when a request is submitted or when a team member picks it up? Does it stop at delivery or at sign-off?
Write the formula down. Share it with every person who contributes to the process. Inconsistent measurement produces inconsistent data.
Step 4: Set a realistic baseline and target
Before setting a target, know where you are. Run the metric for four to six weeks without intervening. That baseline tells you what "normal" actually looks like, accounting for variation.
Set targets that are achievable but not trivial. A 5% improvement in first pass yield over a quarter is meaningful. Demanding 50% improvement with no process changes is noise. Process capability (Cpk) gives you a quantitative way to set targets against specification limits.
Step 5: Build a review cadence
KPIs don't manage themselves. Schedule a recurring review, weekly for operational metrics and monthly for trend analysis. Assign ownership: someone specific is accountable for each metric.
Process optimization becomes systematic when there's a regular moment to ask "why did this move?" rather than reacting only when something breaks.
Process KPI examples by function
Different functions have different critical processes. Here's how common teams apply process KPIs.
| Function | Key Process | Relevant KPIs |
|---|---|---|
| Manufacturing | Production line | Throughput, first pass yield, defect rate, takt time adherence |
| Customer Support | Ticket resolution | First contact resolution rate, average handle time, reopen rate |
| Sales Operations | Pipeline management | Lead response time, quote turnaround time, proposal-to-close cycle |
| HR | Recruiting | Time-to-fill, offer acceptance rate, cost per hire |
| Finance | Invoice processing | Invoice cycle time, exception rate, cost per invoice |
Each function's KPIs should reflect how that process creates value, not just how busy people are. Busyness is not performance.
Common mistakes when tracking process KPIs
Tracking vanity metrics. Number of emails sent, meetings held, or reports generated feel measurable but don't tell you if the process is healthy. KPIs need to reflect the actual purpose of the process.
Setting too many KPIs. A dashboard with twenty metrics diffuses focus. When everything is a priority, nothing is. Start small and add only when a new KPI would change a decision.
No defined target. A KPI without a target is just a data point. "Cycle time is 14 days" means nothing without knowing whether 14 is good, acceptable, or alarming. Every KPI needs a target and, ideally, a threshold that triggers review.
Ignoring the formula. Two teams measuring "defect rate" differently will report different numbers even if the underlying process is identical. Standardize definitions across every person who touches the metric.
Measuring too infrequently. Monthly data on a weekly process hides problems. Match your measurement frequency to the pace at which the process actually runs.
Control charts help distinguish between random variation and real process signals, so you don't overreact to normal fluctuation or miss a genuine trend.
Best practices for process KPIs
Start with the process, not the tool. Understand the flow first. Map inputs, activities, and outputs before picking what to measure. Metrics chosen before the process is understood tend to measure the wrong things.
Connect KPIs to improvement projects. Each KPI should have a home in an active improvement effort or be stable enough to monitor without action. KPIs that just sit in a dashboard and generate no decisions are overhead.
Make KPIs visible to the people running the process. Operational teams who see their own metrics in real time outperform those who receive monthly reports. Visibility drives ownership.
Review DPMO and sigma level alongside standard KPIs when process quality is a strategic priority. These metrics give a standardized view of defect performance that scales across different process types.
Recalibrate annually. Business priorities shift. A KPI that was critical last year may be a maintenance metric today. Audit your KPI set once a year and retire anything that no longer drives decisions.
Frequently Asked Questions about Process KPIs
How many process KPIs should you track?
Three to five per process is the practical sweet spot. Fewer than three and you're likely missing important signals. More than seven and the signal gets lost in noise. If you find yourself with ten or more, look for overlap: some may be measuring the same thing in different ways.
What is the difference between a KPI and a metric?
A metric is any number you track. A KPI is a metric you've decided matters to a specific goal. All KPIs are metrics, but most metrics aren't KPIs. The distinction is intentional: a KPI is linked to a decision or a target. A metric is just data. When you promote a metric to a KPI, you're saying "this number will change how we act."
Can process KPIs apply to service businesses, not just manufacturing?
Yes. Every business runs processes: hiring, billing, sales, customer support, project delivery. The KPIs look different from a factory floor, but the structure is identical: pick a process, define what good looks like, measure it, and improve it. First contact resolution rate and time-to-hire are process KPIs, just like cycle time and defect rate.
How often should we review process KPIs?
It depends on the pace of the process. A call center should review handle time and resolution rates weekly. A quarterly forecasting process might be reviewed monthly. The rule: review at a frequency where the data can still inform action before the next cycle runs.
What's the right way to set a KPI target?
Use your baseline. Run the metric for four to six weeks without changing the process. Take the average, look at the range, and set a target that's directionally better than average but inside the range of what's already been achieved in good weeks. That tells you improvement is possible with the current system. Then push from there.
Process KPIs are how organizations stop guessing and start knowing. Pick the right ones, define them clearly, and review them regularly. That combination turns a set of numbers into a tool that actually improves how work gets done.
Related reading

Senior Operations & Growth Strategist
On this page
- What are process KPIs?
- The main types of process KPIs
- Leading vs lagging process indicators
- How to choose the right process KPIs
- Step 1: Tie KPIs to a specific process goal
- Step 2: Pick three to five, not fifteen
- Step 3: Define the formula precisely
- Step 4: Set a realistic baseline and target
- Step 5: Build a review cadence
- Process KPI examples by function
- Common mistakes when tracking process KPIs
- Best practices for process KPIs
- Related reading