Design of Experiments (DOE): A Practical Guide
Turn this article into takeaways for your work.
Each assistant summarizes the article only for you and suggests best practices for your work.
Most teams test process changes the same way: adjust one thing, watch what happens, then adjust something else. It's slow, it misses interactions between factors, and it often leads to conclusions that don't hold once you change anything else. Design of experiments offers a faster, more rigorous path.
Design of experiments (DOE) is a structured method for planning tests so you can understand which inputs drive your outputs and by how much. You change multiple factors simultaneously in a controlled way, then use statistical analysis to separate signal from noise. It's the difference between informed optimization and expensive trial and error.
What is design of experiments?
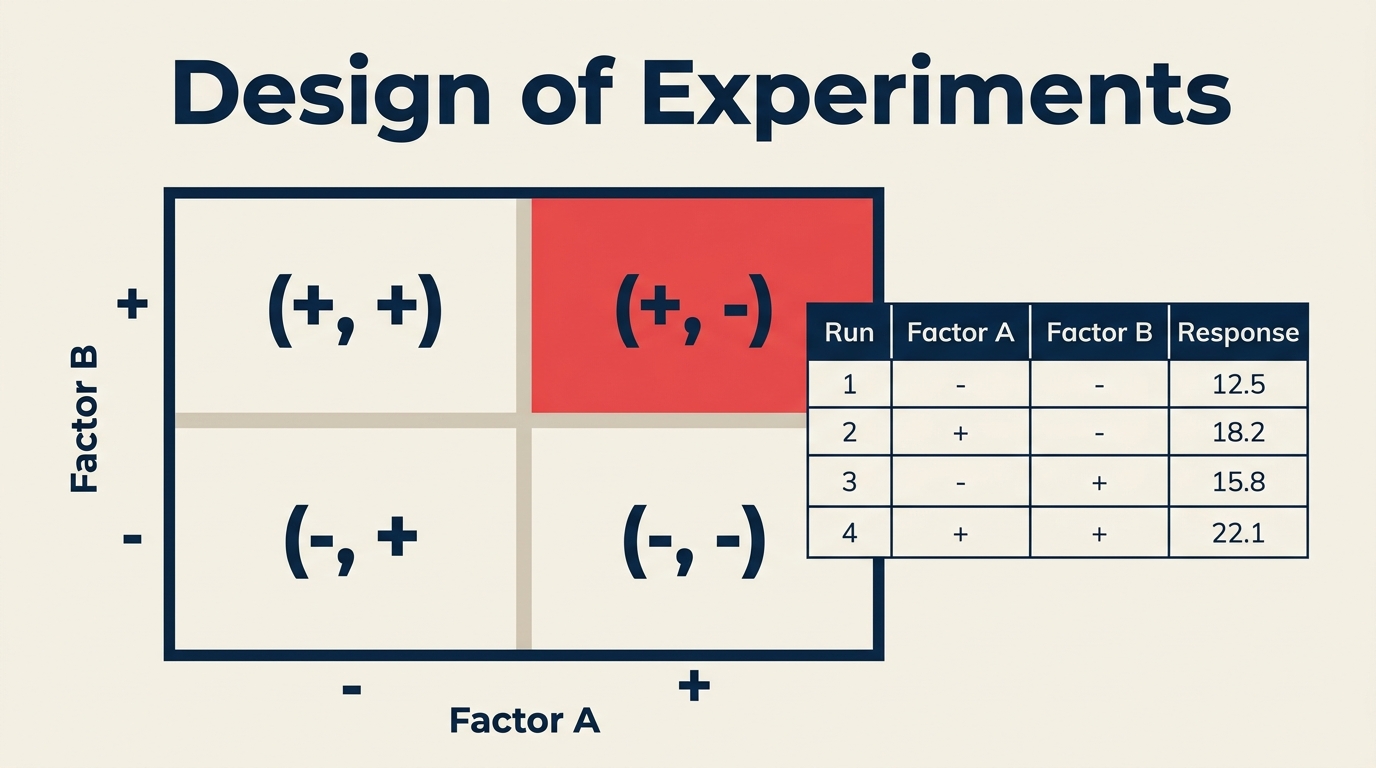
Design of experiments (DOE) is a branch of applied statistics that tells you exactly how to set up and run a series of tests to efficiently identify cause-and-effect relationships between process inputs (factors) and outputs (responses).
A factor is any variable you control during the experiment, such as temperature, batch size, or message copy. Each factor is tested at defined levels (for example, 180°C vs 200°C, or short vs long email subject). The response variable is what you measure: yield, defect rate, conversion rate. By varying multiple factors at once in a planned structure, DOE captures not just main effects but also interactions, where the effect of one factor depends on the level of another. That interaction information is exactly what one-at-a-time testing misses.
Key Facts
- Six Sigma practitioners using DOE report cycle-time reductions of 40 to 70 percent compared to unstructured experimentation, according to the American Society for Quality (ASQ, 2022).
- A study published in the Journal of Quality Technology found that designed experiments routinely identified critical process variables in 3 to 5 runs where one-factor-at-a-time testing required 15 or more (JQT, 2020).
- Minitab's 2023 customer survey found that 68 percent of manufacturing organizations using statistical DOE tools reached their improvement target faster than with informal testing approaches (Minitab, 2023).
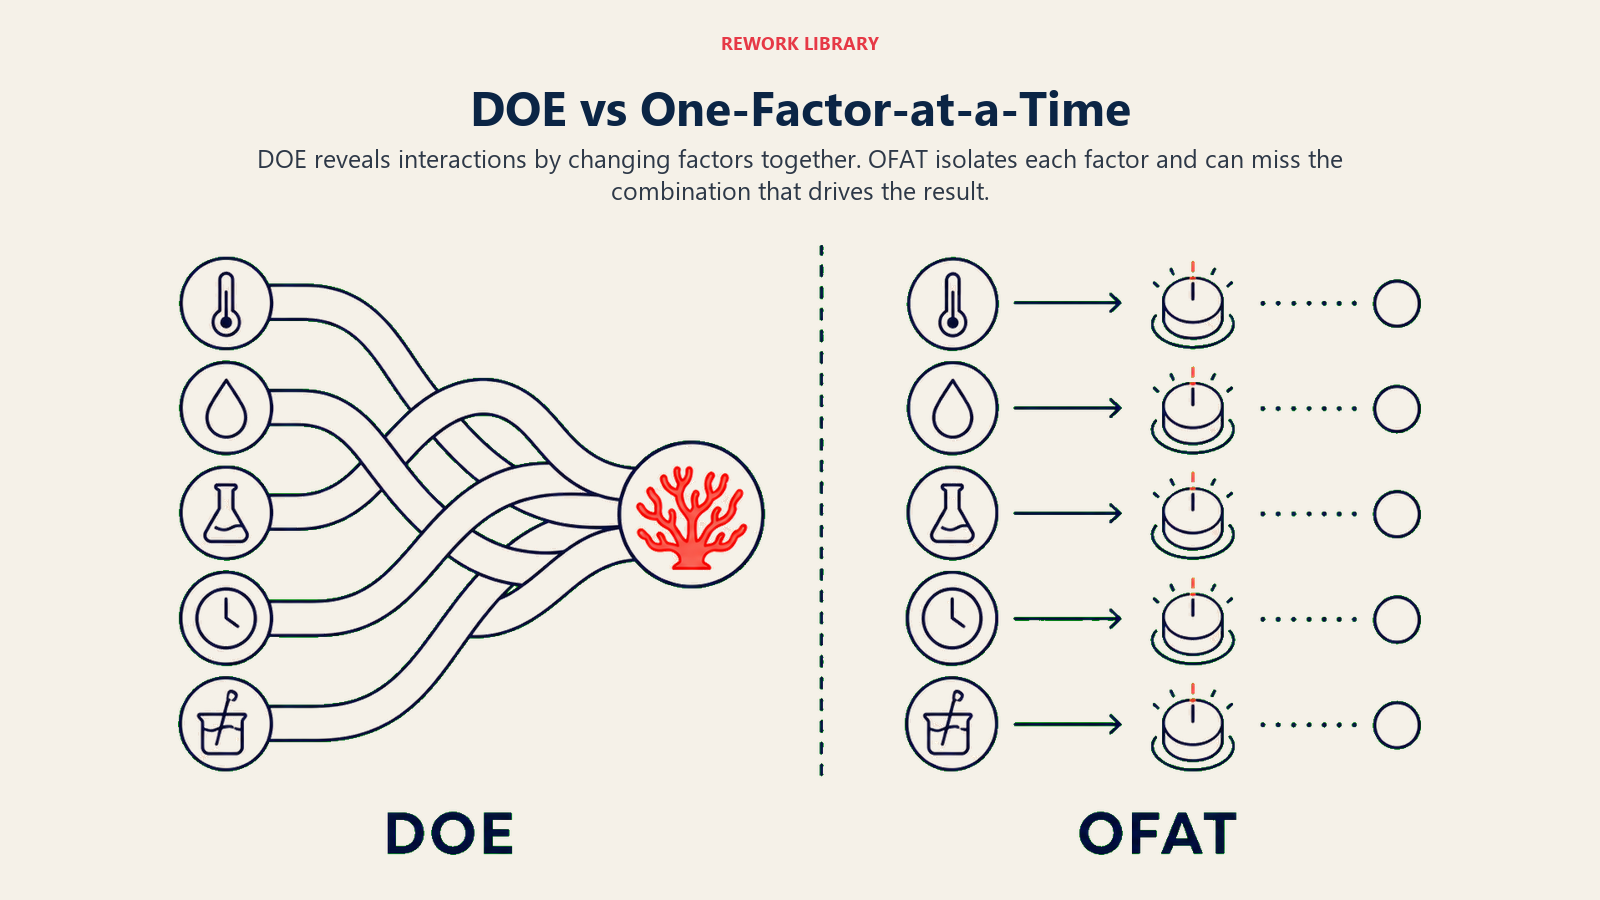
DOE vs one-factor-at-a-time (OFAT)
The traditional approach to testing is OFAT: hold everything constant, change one factor, observe the result, repeat. It's intuitive and it can work for very simple systems. But it breaks down quickly once interactions exist or when run count matters.
| Dimension | DOE | OFAT |
|---|---|---|
| Interaction detection | Yes: finds A x B effects by design | No: interactions remain hidden |
| Total runs needed | Fewer: fractional designs can cover many factors in 8 to 16 runs | More: each factor requires its own sequence of tests |
| Cost efficiency | High: information per run is maximized | Low: many runs yield redundant information |
| Confidence in results | Statistical: error quantified via ANOVA | Informal: no variance estimate |
| When to use | Multiple factors, suspected interactions, limited run budget | Single-factor, well-understood system, quick sanity check |
If you're optimizing a process with three or more factors and you care about whether temperature affects yield differently at different pressures, OFAT will mislead you. DOE won't.
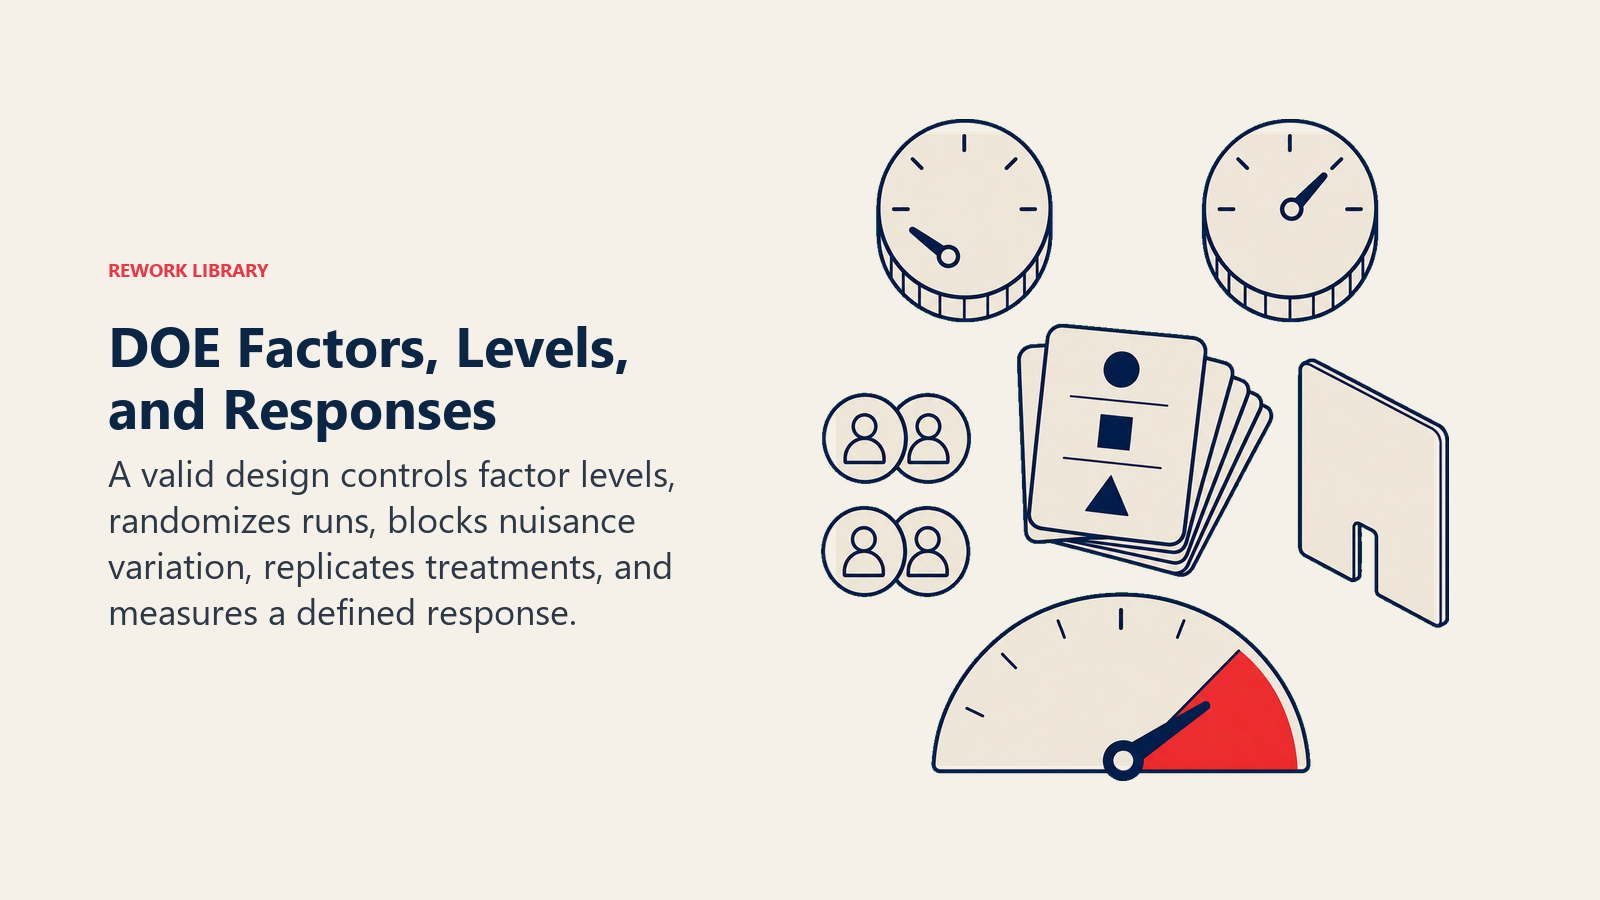
Key concepts in design of experiments
Understanding these terms prevents the most common setup mistakes.
| Term | What it means |
|---|---|
| Factor | A controlled input variable tested at two or more levels |
| Level | A specific setting of a factor (low/high, on/off, 50 mg/100 mg) |
| Response variable | The output you measure to judge whether the experiment worked |
| Interaction | When the effect of Factor A on the response depends on the level of Factor B |
| Blocking | Grouping runs by a nuisance variable (shift, operator, batch) to prevent it from inflating error |
| Randomization | Running experimental tests in random order to prevent systematic bias from unknown time-trends |
| Replication | Running the same treatment combination more than once to estimate pure experimental error |
| Confounding | When two effects are indistinguishable from each other, usually in fractional designs |
| Center point | A run at the midpoint of all factor ranges, used to detect curvature in the response |
Randomization and blocking are not optional niceties. Without randomization, a warming oven or a fatiguing operator can look like a real factor effect. Without blocking, you can't separate true improvement from shift-to-shift noise.
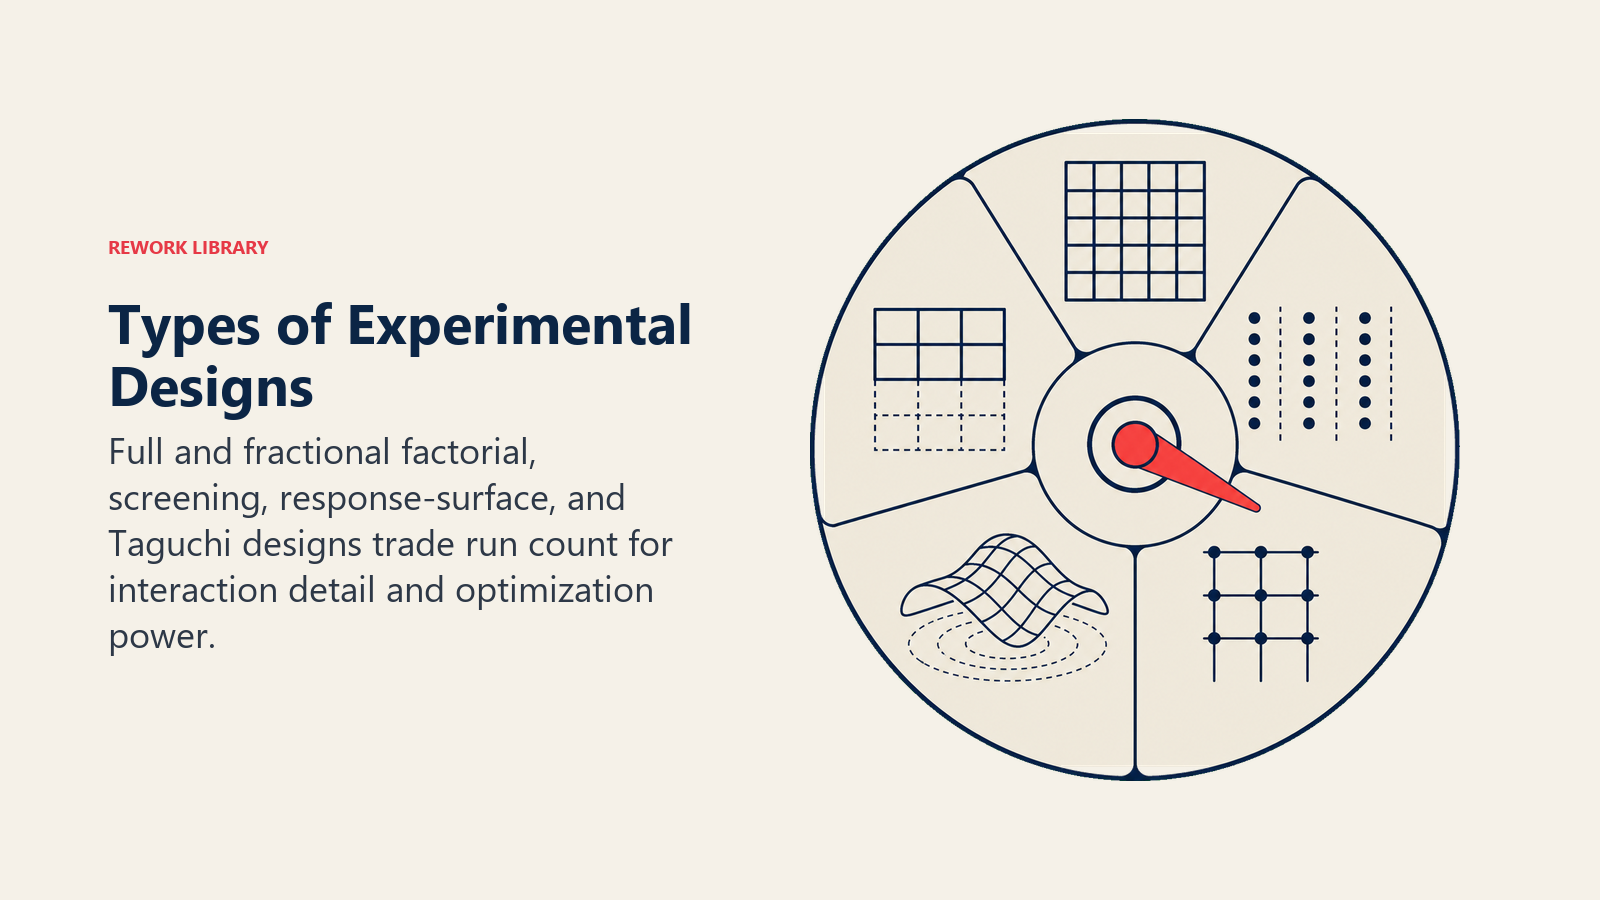
Common types of experimental designs
Full and fractional factorial, screening, response-surface, and Taguchi designs trade run count for interaction detail and optimization power.
| Design | Best for | Trade-off |
|---|---|---|
| Full factorial | 2 to 4 factors, need all interactions | Run count doubles with each added factor (2^k) |
| Fractional factorial | 4 to 8 factors, budget constrained | Some high-order interactions are confounded |
| Plackett-Burman | Screening 8 to 20 factors quickly | Only estimates main effects, no interaction info |
| Response surface (CCD/Box-Behnken) | Optimization after screening, curved response | Requires three levels per factor, more runs |
| Taguchi | Robustness to noise in manufacturing | Confounds some interactions by design, less flexible |
A typical project runs a Plackett-Burman first to screen out inactive factors, then a fractional factorial on the survivors, then a response surface design if an optimum needs to be pinpointed. Each step reduces uncertainty and focuses resources.
How to run a design of experiments study
Define the response, choose factors and levels, select and randomize the design, analyze effects, then confirm the predicted settings.
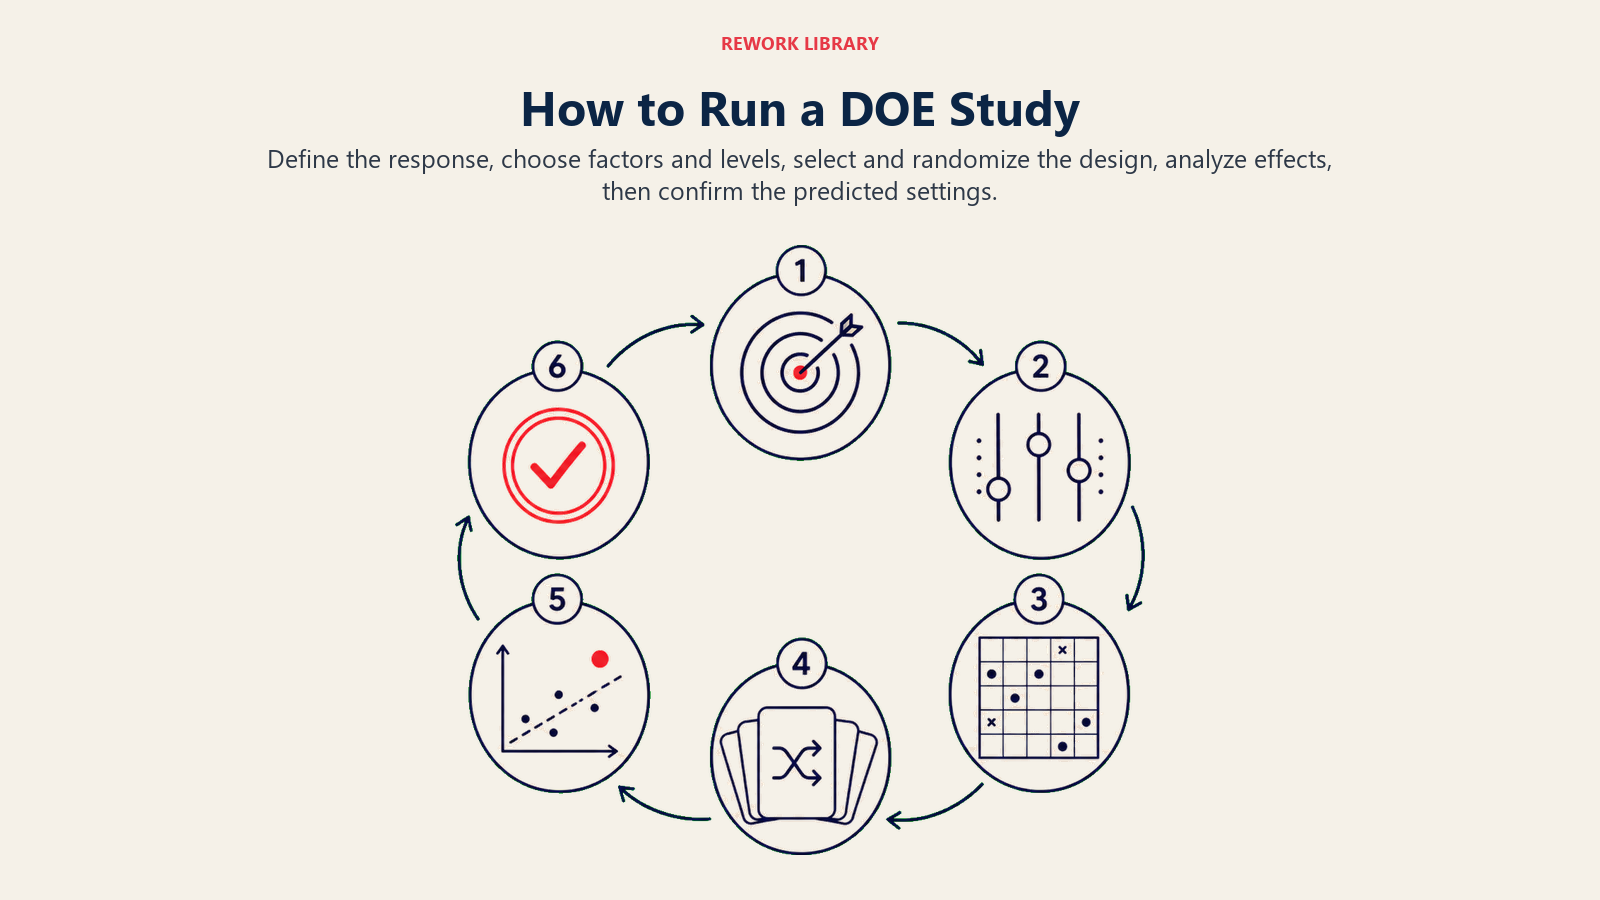
Step 1: Define the objective and the response variable
Start with a precise problem statement. "Improve yield" is too vague. "Increase first-pass yield on Line 3 from 87% to 93% without increasing cycle time" is testable. Identify the response variable you'll measure and confirm you can measure it repeatably. Poor measurement system agreement (see statistical process control and process capability) will corrupt any experiment.
Step 2: Choose factors and levels
List every variable that could plausibly affect the response. Screen the list with your team using prior data, a fishbone diagram, or an FMEA. Narrow to the most likely 4 to 8 candidates. For each, set a low and a high level wide enough to detect an effect but realistic enough to be safe and operable. If you're unsure of the range, run a range-finding experiment first.
Step 3: Select a design
Match the design to your situation.
- 2 to 3 factors with budget for all combinations: full factorial (4 to 8 runs minimum with replication).
- 4 to 7 factors, interaction info needed: Resolution IV or V fractional factorial.
- 8 or more factors for initial screening: Plackett-Burman.
- Optimizing a confirmed set of 2 to 3 factors: response surface design.
Use software (Minitab, JMP, or the free R FrF2 package) to generate the design matrix. Don't create run orders by hand.
Step 4: Run the experiment and randomize
Execute runs in the randomly generated order the software provides. Randomization is non-negotiable: it protects against time-trends, equipment drift, and operator learning effects that would otherwise masquerade as factor effects. Hold all non-study variables at their standard operating values. Log everything: ambient conditions, operator, equipment state, lot numbers.
Step 5: Analyze the results
Enter response data into your software and run an analysis of variance (ANOVA) or regression. Look at:
- Main effects plots: which factors shift the average response.
- Interaction plots: whether the effect of one factor reverses direction at different levels of another.
- Residual plots: whether model assumptions are met (normality, constant variance).
- Pareto of effects: which effects exceed the significance threshold.
A statistically significant effect has a p-value below your threshold (usually 0.05) and a practical size worth acting on. Both matter. A tiny effect can be statistically significant at high run counts but operationally irrelevant.
Step 6: Confirm and iterate
Run a confirmation experiment at the predicted optimal settings. The confirmation result should fall within the model's prediction interval. If it doesn't, something was missed: an unmeasured factor, a range that was too narrow, or a noise variable that crept in. This step is where most teams skip out early and regret it later. Once confirmed, codify the new settings in your standard operating procedures and update the control chart baseline.
Design of experiments examples
| Industry/Function | What was studied | Factors tested | Result |
|---|---|---|---|
| Pharmaceutical manufacturing | Tablet dissolution rate | Compression force, binder concentration, granulation time | Identified 2 factors responsible for 91% of variation, reduced out-of-spec batches by 60% |
| Email marketing | Click-through rate | Subject line length, send time, personalization, CTA copy | 2^4 fractional factorial isolated subject line + CTA interaction as dominant driver |
| Agriculture | Crop yield | Fertilizer type, irrigation frequency, row spacing | Response surface design found optimum for three factors simultaneously in 15 plots |
| Software performance | API response latency | Cache size, connection pool depth, query timeout | Plackett-Burman screened 7 parameters; 2 dominated, tuned to reduce p95 latency by 34% |
| Food processing | Snack texture score | Bake time, oven temperature, moisture content | Full 2^3 factorial plus center points confirmed curvature; response surface found optimum |
The same logic applies whether you're mixing compounds, writing ad copy, or tuning a database. If inputs vary and you're not sure which ones matter, DOE answers the question faster than intuition will.
Best practices and common mistakes
Do:
- Randomize run order every time, even when it's inconvenient.
- Replicate at least the center point to get a pure error estimate.
- Validate your measurement system before you start (gauge R&R if needed).
- Confirm results at optimal settings before changing production.
- Document factor ranges, response definitions, and run logs so the experiment can be reproduced.
Don't:
- Add factors mid-experiment. Adding a factor after you've started invalidates the design structure.
- Use too many factors at inadequate resolution. Running a Resolution III design when you know interactions exist will give you confounded, misleading results.
- Confuse statistical significance with practical importance. Always check effect size.
- Skip the confirmation run. The model is a mathematical abstraction; the process is real.
- Try to hand-calculate DOE designs. Software generates valid randomized run orders with the correct confounding patterns. Don't improvise.
DOE fits naturally into the Improve phase of DMAIC, where it replaces guesswork with a statistically backed choice of optimal settings. It's also common in Lean Six Sigma projects and in any Six Sigma initiative where root cause analysis has already narrowed the suspect list to a handful of factors worth testing formally.
Related reading

Senior Operations & Growth Strategist
On this page
- What is design of experiments?
- DOE vs one-factor-at-a-time (OFAT)
- Key concepts in design of experiments
- Common types of experimental designs
- How to run a design of experiments study
- Step 1: Define the objective and the response variable
- Step 2: Choose factors and levels
- Step 3: Select a design
- Step 4: Run the experiment and randomize
- Step 5: Analyze the results
- Step 6: Confirm and iterate
- Design of experiments examples
- Best practices and common mistakes
- Related reading