Overall Equipment Effectiveness (OEE): Formula and How to Calculate It
Turn this article into takeaways for your work.
Each assistant summarizes the article only for you and suggests best practices for your work.
Overall equipment effectiveness, or OEE, is the single number most manufacturers use to judge how productively a piece of equipment is running. If you only track one metric on your shop floor, most lean practitioners would tell you it should be this one.
What is overall equipment effectiveness?
Overall equipment effectiveness (OEE) is a metric that measures how fully a piece of equipment is being used relative to its full potential, expressed as a percentage. It combines three factors, availability, performance, and quality, into one score. A machine running at 100% OEE is available whenever needed, running at full design speed the entire time, and producing zero defects.
That makes OEE a compressed diagnostic. One number tells you whether your losses come from unplanned downtime, slow running, or bad parts, and each root cause points to a different fix.
OEE was formalized in the 1980s as part of Total Productive Maintenance (TPM), a plant-wide approach to equipment reliability developed by Seiichi Nakajima. The goal was to give maintenance and production teams a shared language for measuring and eliminating losses. Today it's used in industries from automotive assembly to food processing to semiconductor fabrication.
Key facts
- World-class OEE is 85%. Most lean benchmarks treat 85% as the target to aspire toward, reflecting roughly 90% availability, 95% performance, and 99.9% quality.
- The average manufacturer runs around 60% OEE. That means 40% of possible productive capacity is being lost to downtime, slow speed, or defects, a significant opportunity.
- Three factors, one number. OEE is always the product of Availability x Performance x Quality. Improve any one of the three and OEE rises; ignore any one and the others can't compensate.
The OEE formula
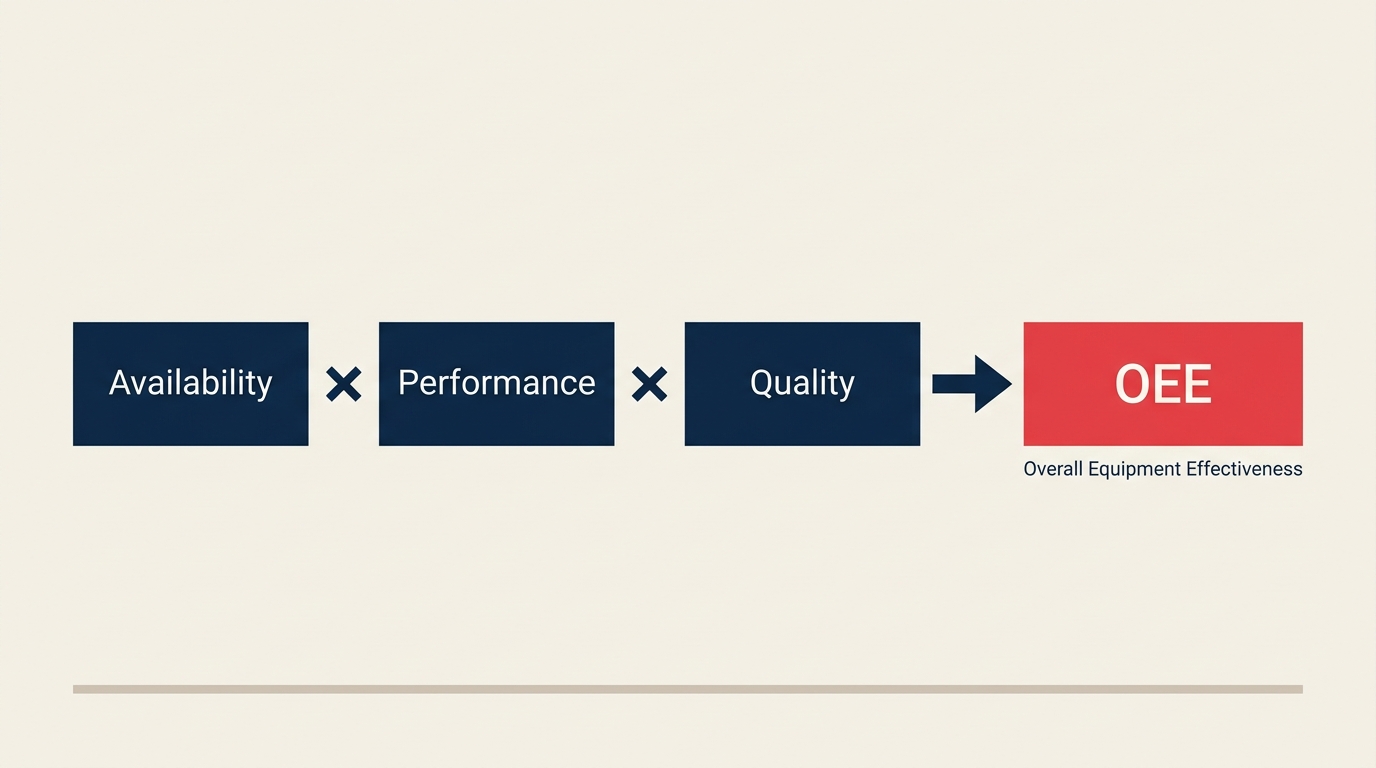
OEE is calculated by multiplying three ratios together:
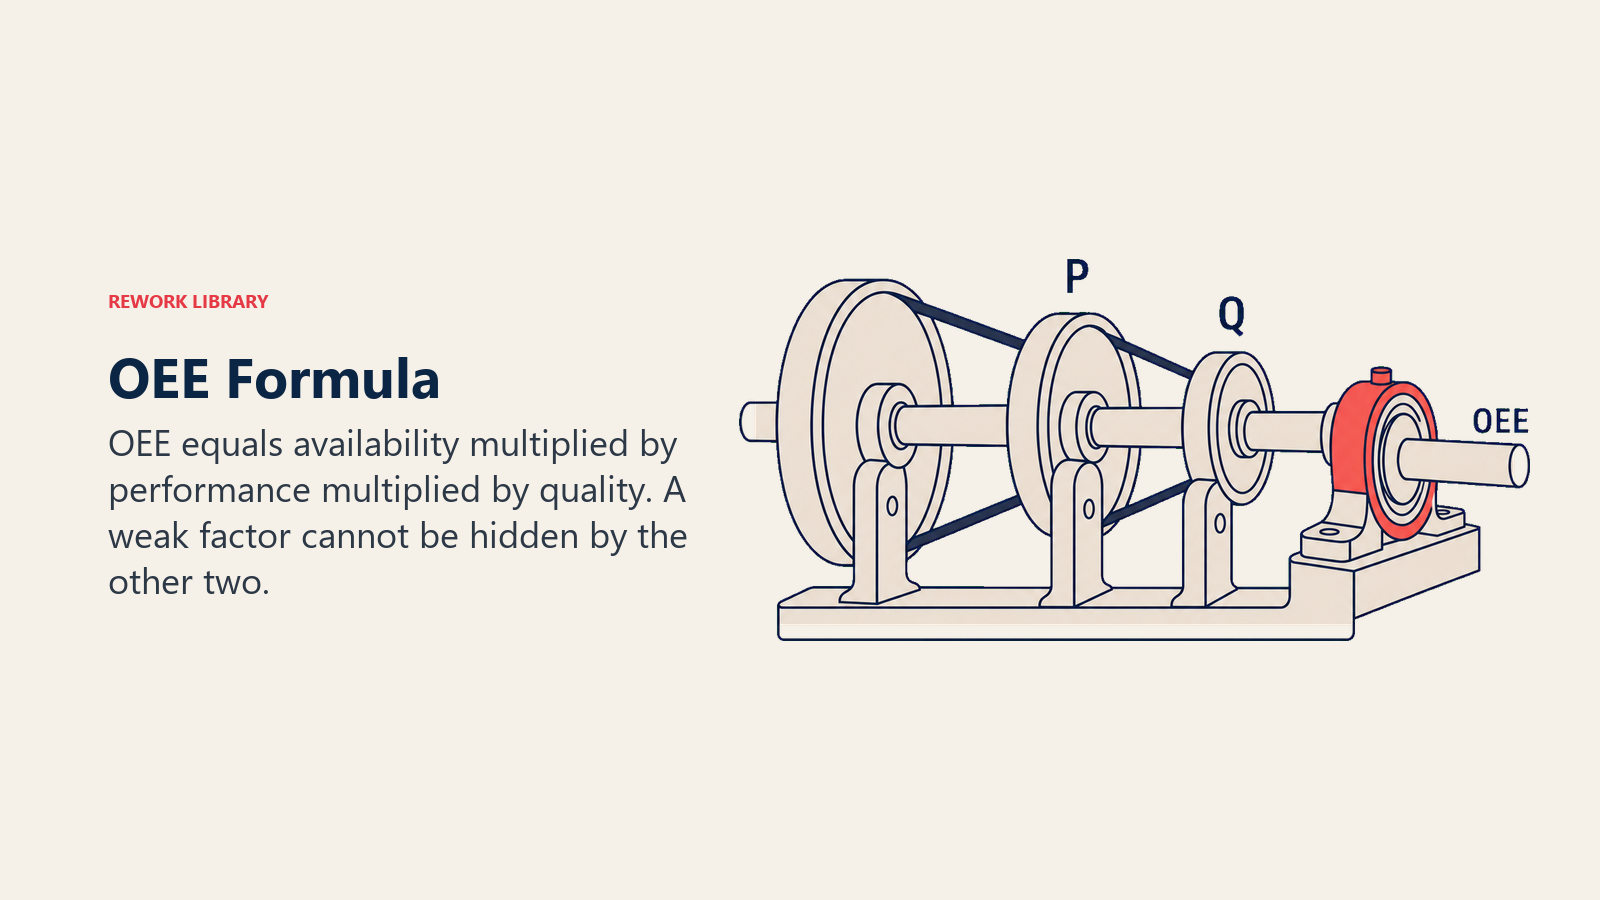
OEE = Availability x Performance x Quality
Each factor has its own formula:
| Factor | Formula | What it measures |
|---|---|---|
| Availability | (Run Time) / (Planned Production Time) | Time the machine was actually running vs. time it was scheduled to run |
| Performance | (Ideal Cycle Time x Total Count) / Run Time | Speed the machine ran vs. its theoretical maximum speed |
| Quality | (Good Count) / (Total Count) | Parts that passed inspection vs. total parts produced |
A few definitions worth pinning down:
- Planned Production Time is the total shift time minus any scheduled stops (planned maintenance, breaks, changeovers that are treated as scheduled). It's what you actually scheduled the machine to produce.
- Run Time is Planned Production Time minus unplanned downtime (breakdowns, waiting for materials, quality holds).
- Ideal Cycle Time is the fastest theoretical time per part, the manufacturer's spec or the fastest observed rate, whichever is more reliable.
- Good Count is finished parts that pass first-pass quality checks with no rework.
Multiply the three resulting decimals and you get a number between 0 and 1. Multiply by 100 to express it as a percentage.
A worked OEE calculation
Say you're running a CNC machining cell on a single eight-hour shift.
Step 1, Establish Planned Production Time
The shift is 480 minutes. You schedule two 15-minute breaks and a planned 30-minute changeover at the start of the shift. That's 60 minutes of scheduled downtime.
Planned Production Time = 480 - 60 = 420 minutes
Step 2, Calculate Availability
During the shift, the machine broke down twice for a combined 42 minutes of unplanned downtime.
Run Time = 420 - 42 = 378 minutes
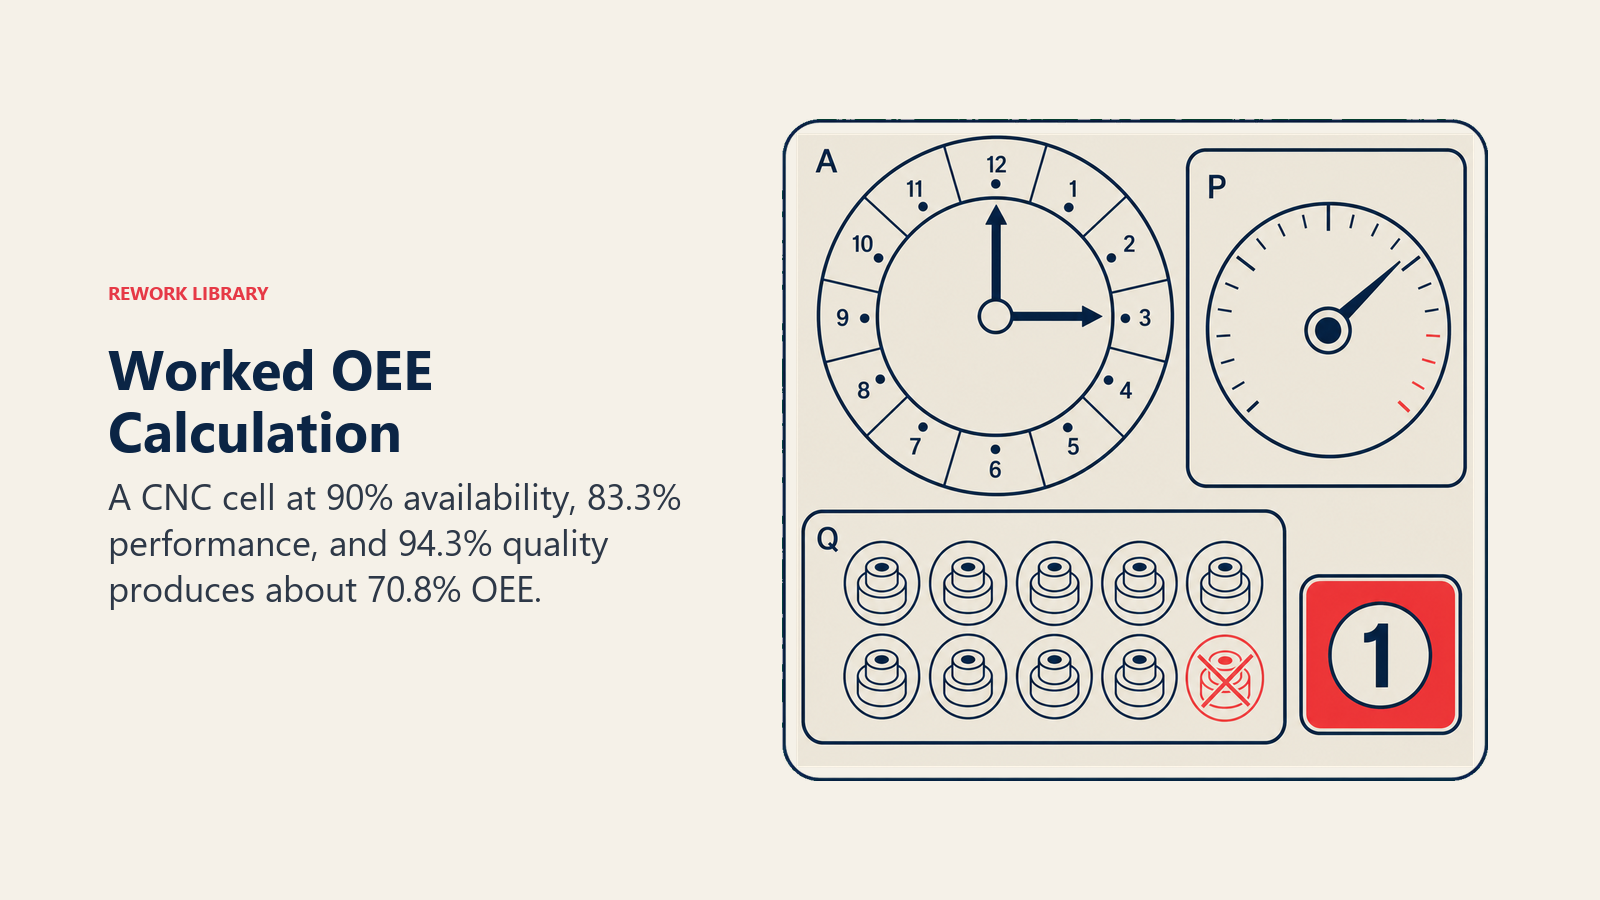
Availability = 378 / 420 = 0.90 (90%)
Step 3, Calculate Performance
The ideal cycle time for this part is 1.5 minutes per piece. During the 378 minutes of run time, the cell produced 210 parts.
Ideal output at full speed = 378 / 1.5 = 252 parts
Performance = (1.5 x 210) / 378 = 315 / 378 = 0.833 (83.3%)
You can read this as: the machine ran at about 83% of its theoretical speed because of minor stoppages and slow cycles.
Step 4, Calculate Quality
Of the 210 parts produced, 8 were scrapped and 4 required rework that counted as defects on first pass.
Good Count = 210 - 8 - 4 = 198
Quality = 198 / 210 = 0.943 (94.3%)
Step 5, Combine
OEE = 0.90 x 0.833 x 0.943 = 0.708, or about 70.8%
That result is above the industry average but still 14 points short of world class. The performance ratio (83.3%) is the weakest link, meaning minor stoppages and speed losses are the biggest opportunity on this cell.
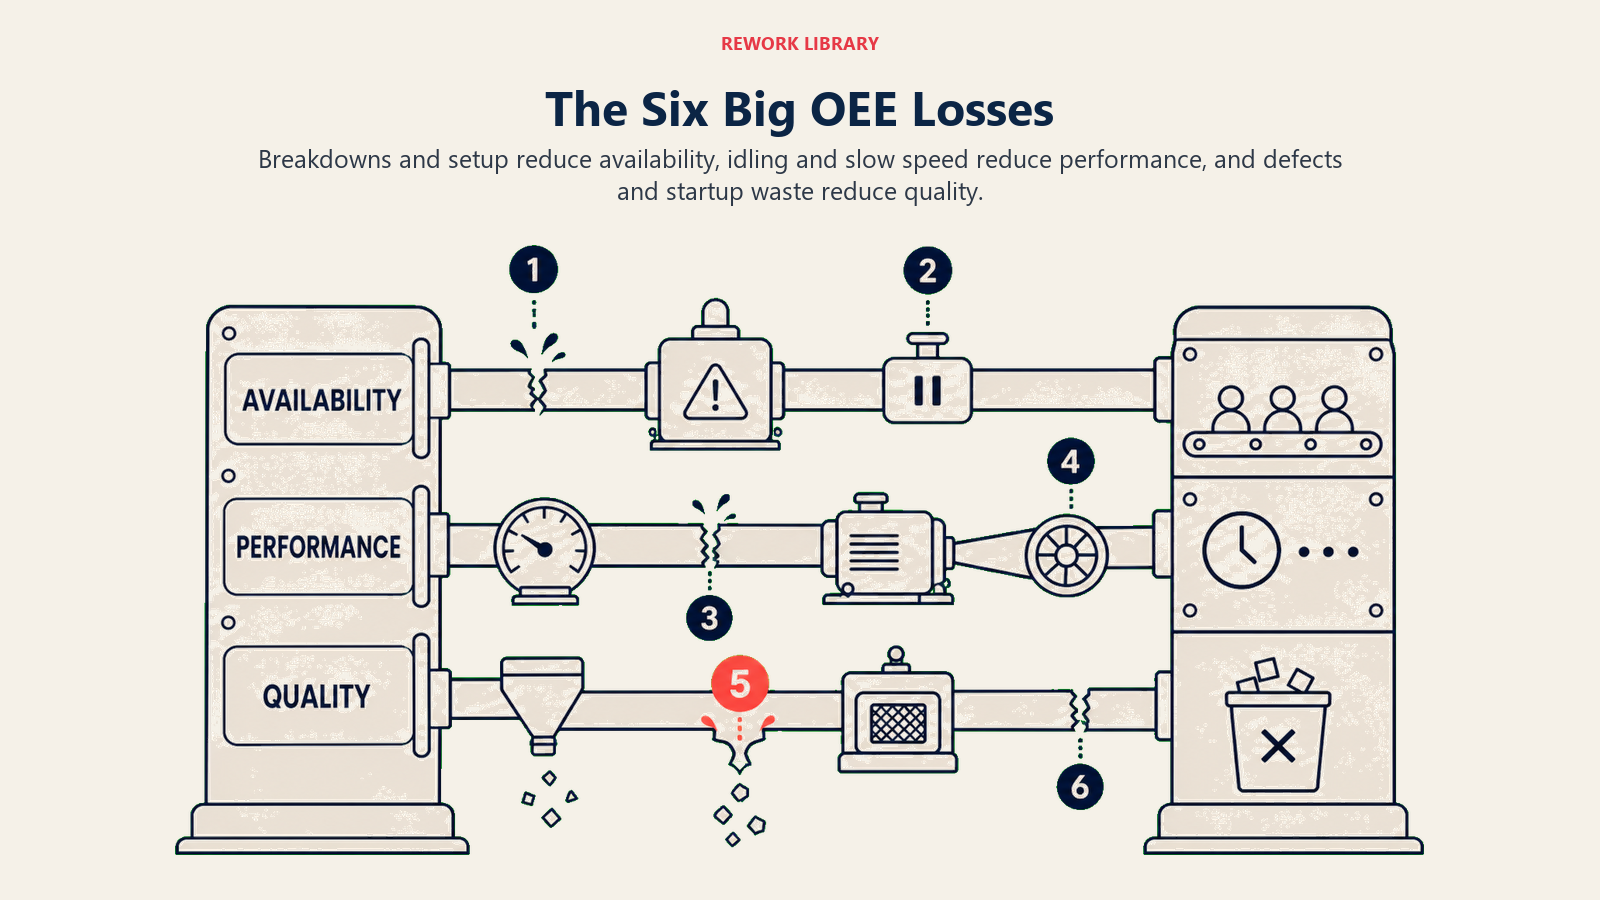
The Six Big Losses
The OEE framework pairs naturally with the Six Big Losses, a classification system that maps every type of production loss to one of the three OEE factors. It was defined alongside TPM to give teams a structured way to categorize what they see in their data.
| Loss | OEE factor | Description |
|---|---|---|
| 1. Breakdowns | Availability | Unplanned downtime from equipment failure |
| 2. Setup and adjustments | Availability | Time lost during changeovers, start-ups, or warm-up |
| 3. Idling and minor stoppages | Performance | Brief stoppages where the machine pauses but doesn't fully break down |
| 4. Reduced speed | Performance | Machine runs slower than its ideal cycle time |
| 5. Process defects | Quality | Scrap and rework generated during stable production |
| 6. Reduced yield | Quality | Defects and waste during start-up until the process stabilizes |
When your OEE data points to a weak factor, the Six Big Losses help you identify which specific loss category to attack first. A line with 75% availability almost certainly has a breakdown problem or a changeover problem, those are Loss 1 and Loss 2, and the fix strategies differ entirely.
Connecting OEE to the Six Big Losses also makes it easier to prioritize improvement projects. Instead of arguing over which breakdown matters most, your team can see at a glance where the biggest chunks of productive time are disappearing.
OEE benchmarks
Interpreting your OEE score requires context. Here's how practitioners generally read different score ranges:
100% OEE is theoretical perfection: the machine runs all scheduled time, at full speed, with zero defects. No real process achieves this sustainably. It's a ceiling, not a target.
85% OEE is the world-class benchmark. You get there with roughly 90% availability, 95% performance, and 99.9% quality. Plants that sustain 85%+ typically have mature TPM programs, disciplined changeover practices, and robust predictive maintenance.
60% OEE is close to the global average for manufacturers. It means about 40% of your scheduled capacity is lost. At this level, there are almost always quick wins available in one or two of the three factors.
40% OEE or below usually signals systemic issues: frequent breakdowns, poor changeover management, or widespread quality problems. Plants in this range are often also struggling with on-time delivery, because capacity losses directly drive schedule misses.
One practical note: OEE is most useful as a trend line and as a comparison within a single plant. Cross-plant or cross-industry comparisons require careful alignment on how each factor is defined, what one plant calls "planned downtime" another might include in run time.
How to improve OEE
Improving OEE means attacking whichever of the three factors is weakest. But a few approaches reliably move all three at once.
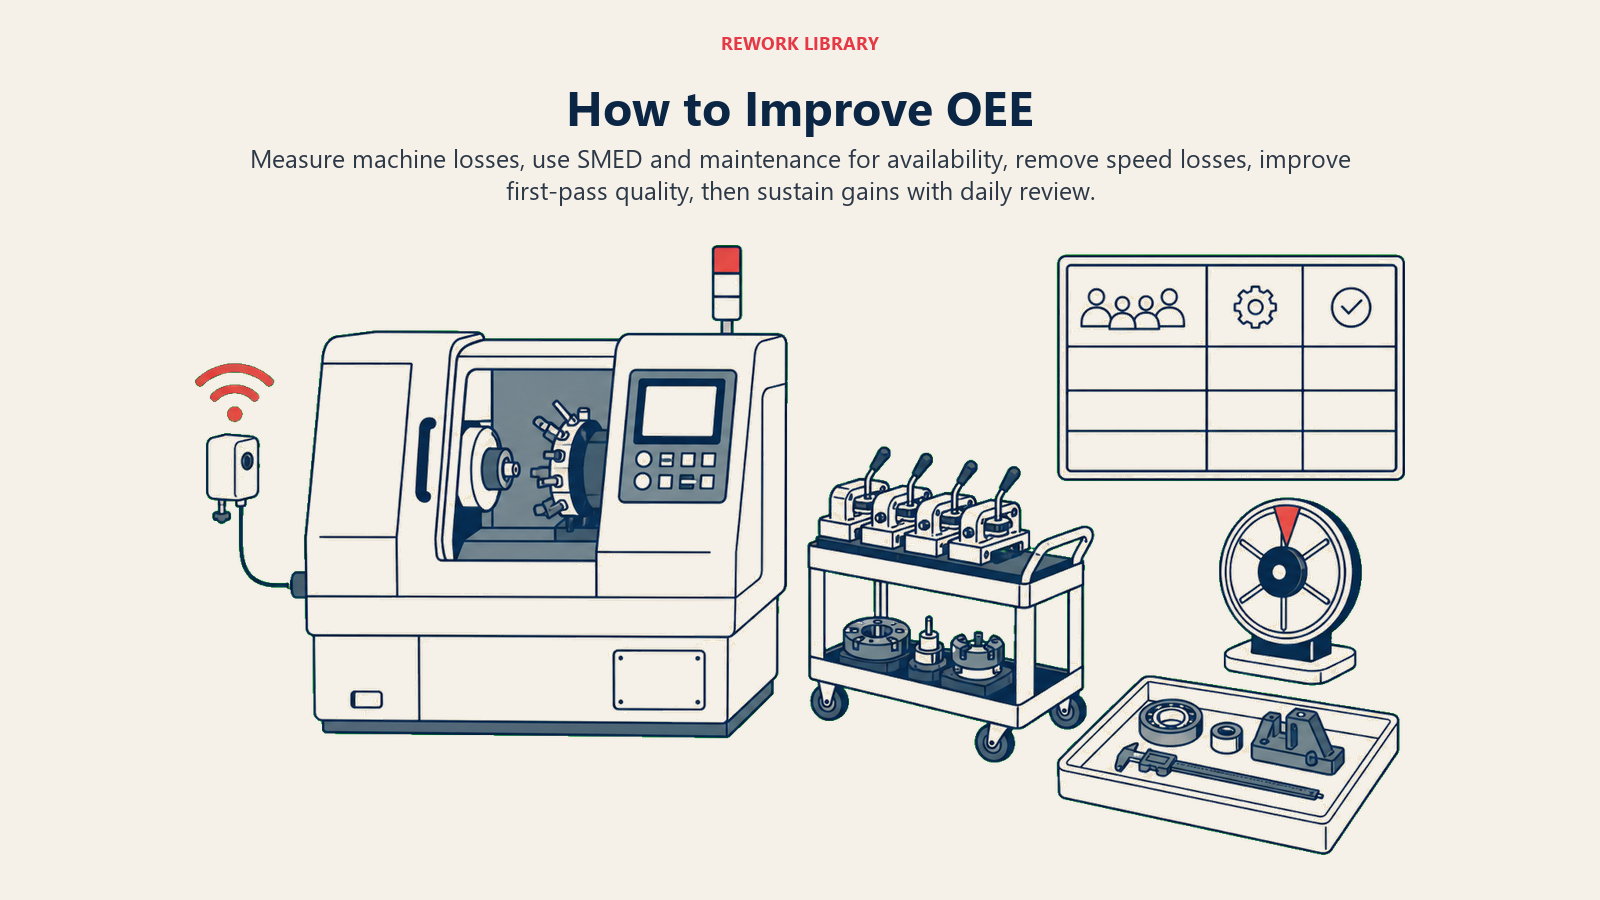
Step 1: Measure before you act
You can't improve what you don't track. Set up data collection at the machine level, ideally automated, but a well-designed paper log works. You need timestamps for downtime events, part counts, and defect counts. Even two weeks of clean data will reveal your biggest loss category.
Step 2: Fix availability with SMED and preventive maintenance
Availability losses come from breakdowns and long changeovers. SMED (Single-Minute Exchange of Die) is the structured method for shrinking changeover times, often by converting internal setup steps (machine stopped) to external ones (done while machine runs). Cutting a 90-minute changeover to 30 minutes on a high-utilization cell can add several percentage points to OEE in weeks.
Unplanned breakdowns respond to time-based and condition-based preventive maintenance. Total Productive Maintenance (TPM) extends this by involving operators in daily equipment checks, catching early warning signs before failures occur.
Step 3: Close the performance gap with minor-stoppage analysis
Performance losses are often invisible because individual stoppages last seconds or a minute or two, too short to log as breakdowns, but frequent enough to add up. Video the line or use automated counters to catalog every stoppage event for a week. Group them by cause. The top three causes typically account for 80% of the total, which is where you focus.
Slow running is a separate problem. Check whether ideal cycle time targets are realistic and current. Sometimes machines have been slowed deliberately to work around a quality problem, fixing the root cause unlocks the speed.
Step 4: Reduce defects at the source
Quality losses respond to root cause analysis and poka-yoke (mistake-proofing). Start with the defect types that appear most often or cost the most. Six Sigma tools like control charts can tell you whether your process is stable but off-target (a setup problem) or varying randomly (a materials or tooling problem), and the fix is different in each case.
Step 5: Sustain with visual management and daily review
Improvements erode without a system to sustain them. Post OEE results at the machine, reviewed daily by the operator and supervisor. Connecting this to a brief shift-start or shift-end huddle keeps the team focused on trends rather than just today's number. Gemba walks by supervisors and engineers reinforce that the data matters and that issues get acted on.
Common mistakes
Gaming the number. OEE is only useful if the inputs are honest. Teams under pressure to hit a target sometimes adjust what counts as "planned downtime" to shrink the denominator and inflate availability. That produces a better-looking score while hiding real losses. Define your inputs consistently and don't change the definitions when scores dip.
Ignoring planned downtime entirely. OEE measures losses against planned production time, it doesn't capture whether you're scheduling enough production time in the first place. A machine that runs 85% OEE on a four-hour shift might still be a bottleneck if the plant needs it running eight hours. That's where TEEP (Total Effective Equipment Performance) is useful, it measures against all available calendar time, not just planned time.
Treating OEE as a plant-wide average. A plant-wide OEE average is almost meaningless. A bottleneck machine running at 55% OEE is far more damaging to output than a non-bottleneck running at 95%. Focus your improvement energy on machines that constrain throughput, not on improving the average. The Theory of Constraints makes this point systematically.
Measuring without acting. OEE data that sits in a spreadsheet and never drives a maintenance request or a process change is a waste of everyone's time. The metric's value is in pointing you toward the next improvement project, not in being reported upward.
Frequently Asked Questions about Overall Equipment Effectiveness
What is a good OEE score?
It depends on your industry and your current baseline. World-class is 85%, and most practitioners treat that as an aspirational target. For a plant currently running at 45-50%, a realistic 12-month improvement goal might be reaching 65%. The more important question is whether your OEE is trending up and whether the gains are coming from your most constrained equipment.
What is the difference between OEE and TEEP?
OEE measures effectiveness against planned production time, the hours you scheduled the machine to run. TEEP (Total Effective Equipment Performance) measures against all calendar time (24 hours x 7 days x however many days in the period). TEEP = OEE x Utilization, where utilization is how much of total available time was actually scheduled. If a machine runs one shift per day, its utilization is roughly 33%, so a 75% OEE translates to about 25% TEEP. TEEP tells you how much capacity you're leaving on the table across all hours, not just the hours you chose to schedule.
Can OEE be applied outside manufacturing?
Yes, though the definitions need adjustment. In healthcare, OEE has been applied to medical imaging equipment and surgical theaters. In logistics, it's been used for automated sorting lines and warehouse equipment. The three-factor structure (availability, performance, quality) maps well to any capital-intensive asset, as long as you can define a "good unit" produced and an ideal cycle time.
How often should OEE be calculated?
At minimum, per shift. Many plants calculate it per hour or per production run on critical equipment, especially when troubleshooting a specific loss. Daily and weekly trend charts are standard in TPM programs. The cadence should match your ability to act on the data, there's no point calculating hourly OEE if the corrective process only runs weekly.
What software do teams typically use to track OEE?
Options range from manual paper logs and Excel workbooks (common in small plants) to dedicated Manufacturing Execution System (MES) modules and specialized OEE platforms that pull data directly from PLCs and sensors. The right choice depends on your current data infrastructure and how many machines you're tracking. Starting with a well-structured spreadsheet and consistent manual input is often faster than implementing a new system, and it forces clarity about your data definitions before you automate.
Most plants that take OEE seriously don't hit 85% in a year. But the discipline of measuring it consistently, connecting the number to the Six Big Losses, and fixing one root cause at a time produces steady compound improvement. Start with your bottleneck machine, get two weeks of clean data, and let the numbers tell you where to dig first.

Senior Operations & Growth Strategist
On this page
- What is overall equipment effectiveness?
- Key facts
- The OEE formula
- A worked OEE calculation
- The Six Big Losses
- OEE benchmarks
- How to improve OEE
- Step 1: Measure before you act
- Step 2: Fix availability with SMED and preventive maintenance
- Step 3: Close the performance gap with minor-stoppage analysis
- Step 4: Reduce defects at the source
- Step 5: Sustain with visual management and daily review
- Common mistakes