First Pass Yield (FPY) and Rolled Throughput Yield
Turn this article into takeaways for your work.
Each assistant summarizes the article only for you and suggests best practices for your work.
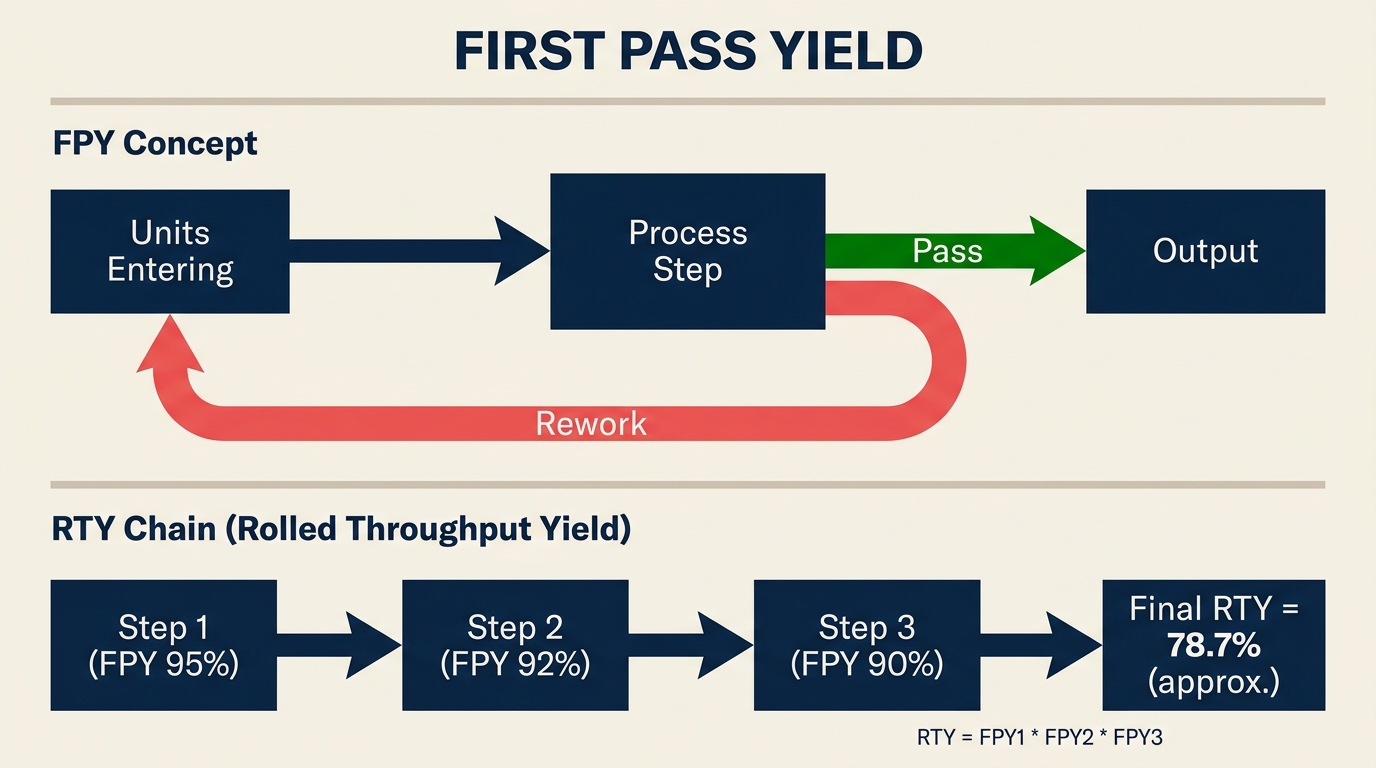
First pass yield (FPY) is the percentage of units that complete a process step correctly the first time, without rework or scrap. It sounds simple. But teams that dig into it often find that what looked like a 95% yield is actually hiding a rework operation running quietly in the background, burning labor hours nobody officially budgeted for.
What is first pass yield?
First pass yield (FPY) measures how many units pass through a process step correctly on the first attempt. A unit that fails inspection and gets reworked before shipping does NOT count as a first-pass success, even if the customer eventually receives a good product.
Key facts
- In Six Sigma methodology, a process operating at 6 sigma produces roughly 3.4 defects per million opportunities (DPMO), which equates to approximately 99.99966% yield (Motorola / ASQ, 2003).
- The American Society for Quality estimates that the cost of poor quality (including rework, scrap, and warranty returns) typically runs 5-30% of annual revenue for manufacturers (ASQ Quality Cost Research, 2019).
- A Toyota Production System study found that rework loops can consume up to 20-40% of available production time in batch-manufacturing environments before they are formally measured (Liker, "The Toyota Way", 2004).
That gap between "shipped" and "shipped right the first time" is where operational waste hides. Measuring FPY forces it into the open. Once you see it, you can price it, prioritize it, and fix it.
The concept sits at the core of Six Sigma and DMAIC improvement programs, but it applies to any repetitive process, from software code reviews to invoice processing to surgical prep checklists.
The first pass yield formula
FPY is calculated at a single process step:
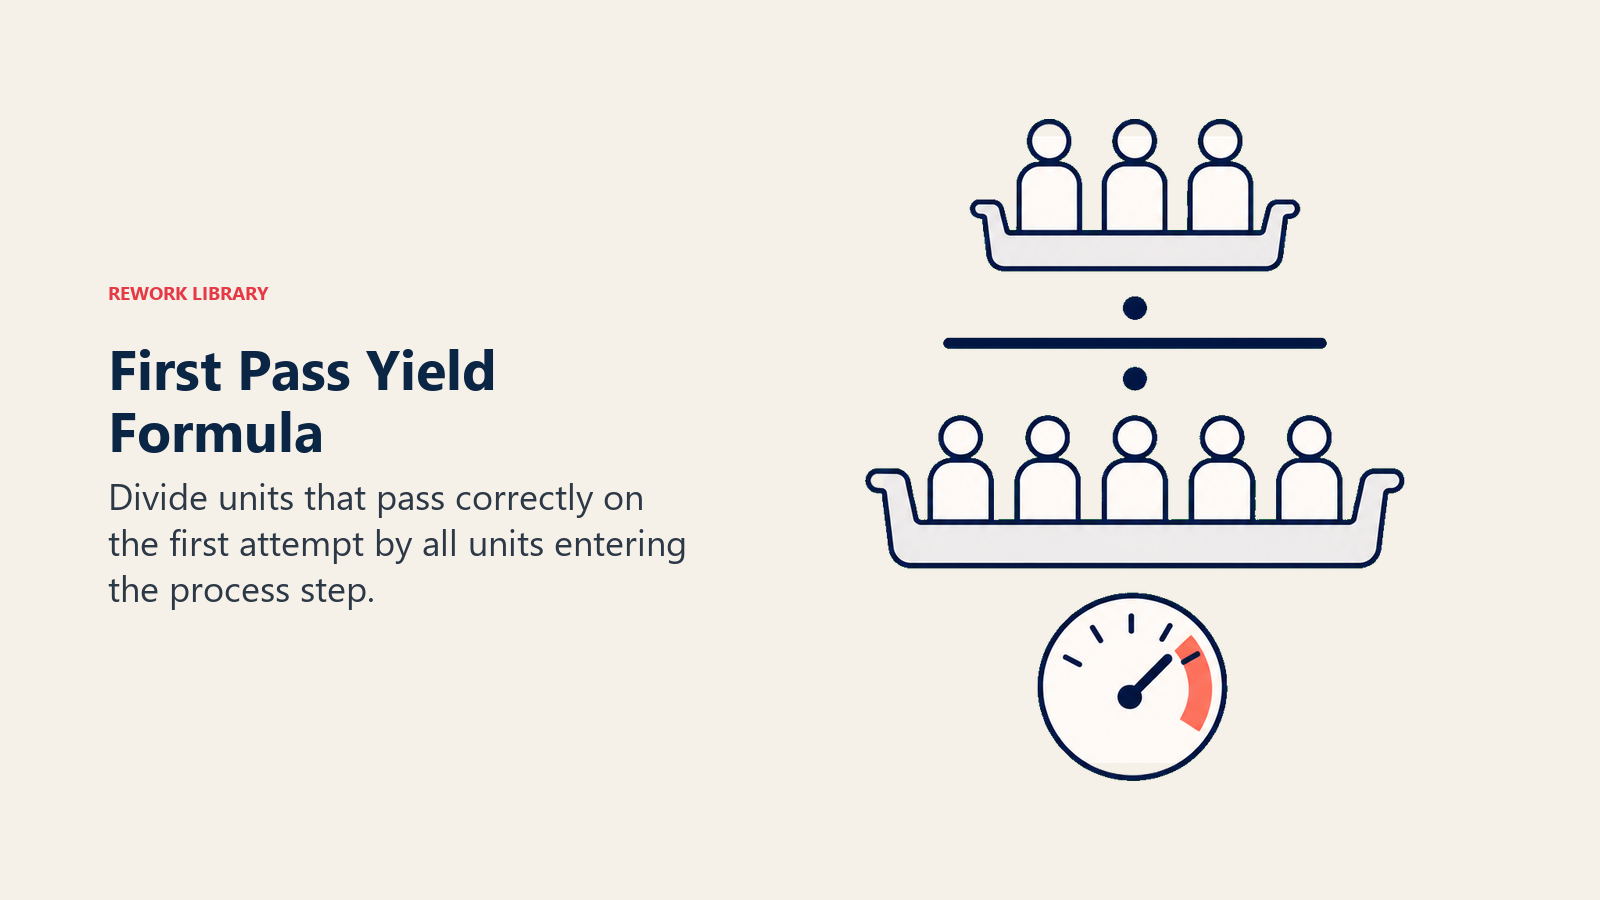
FPY = Units passing the step on first attempt / Total units entering the step
Worked example. A team assembles 200 circuit boards in a shift. After automated optical inspection, 14 boards fail and go to a rework station. All 14 are eventually fixed and shipped.
- Traditional yield = 200 good units out / 200 units in = 100%
- First pass yield = (200 - 14) / 200 = 186 / 200 = 93%
Traditional yield flatters the process by counting reworked units as successes. FPY does not. That 7-point gap represents real labor, real cycle time, and real risk that a reworked board eventually fails in the field.
This distinction is why quality engineers often call traditional yield a "vanity metric." It tells you what left the building. FPY tells you what your process actually does.
Rolled throughput yield (RTY)
A single FPY number describes one process step. Most real-world processes have many steps in sequence, and a defect at any one of them costs you. Rolled Throughput Yield (RTY) captures the cumulative effect.
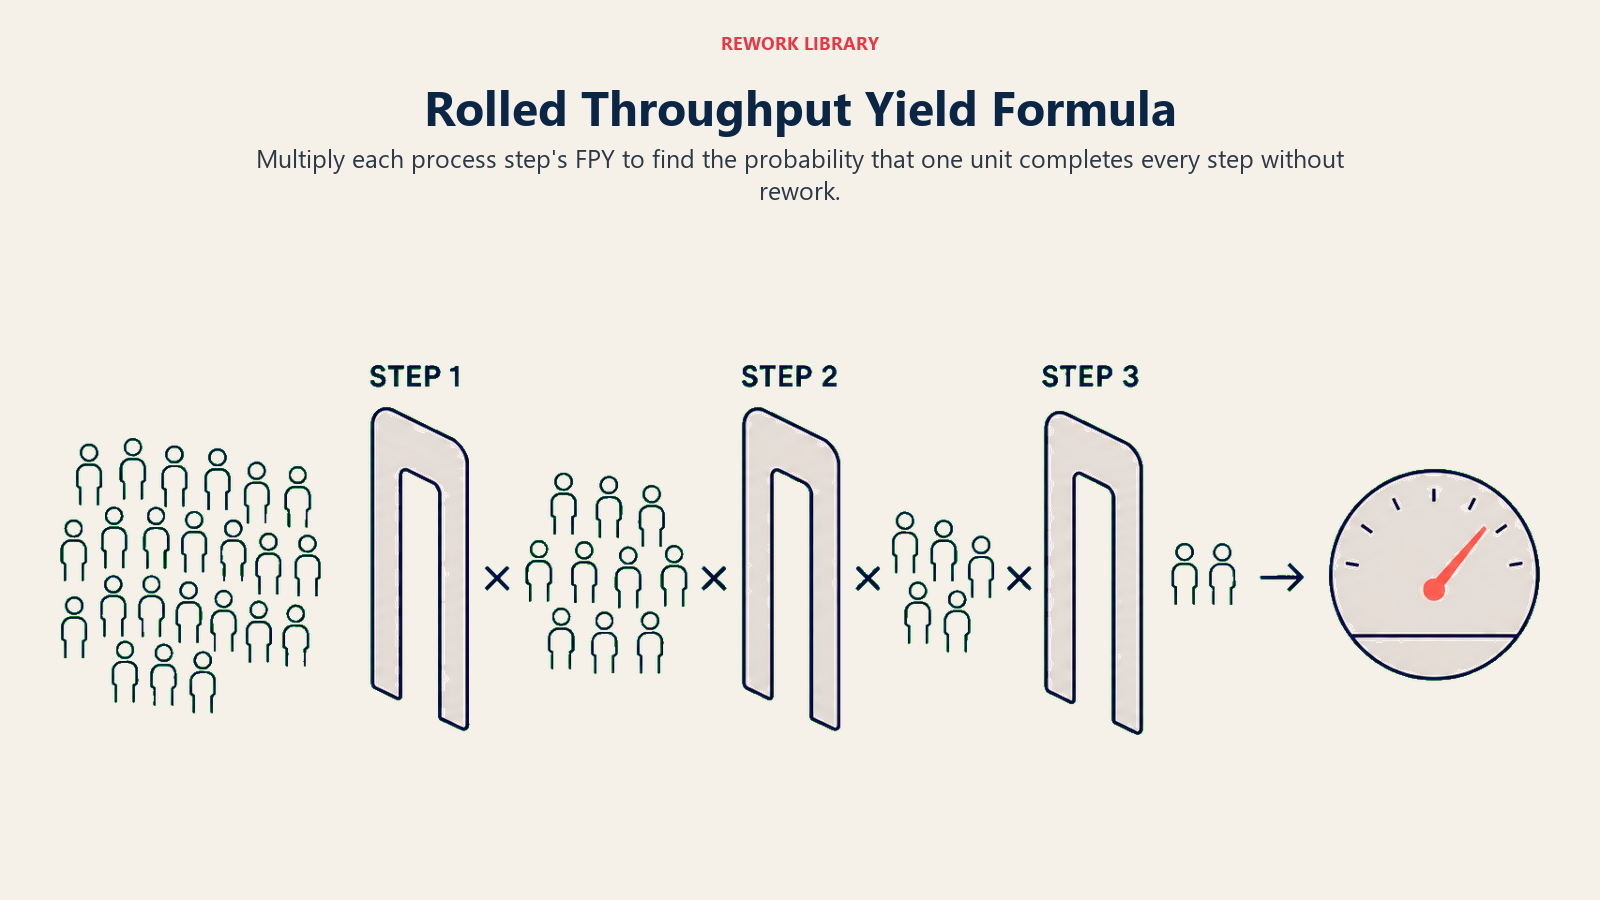
RTY formula:
RTY = FPY(step 1) × FPY(step 2) × FPY(step 3) × ... × FPY(step n)
Worked example. A document processing workflow has three steps:
| Step | FPY |
|---|---|
| Data entry | 97% |
| Manager review | 94% |
| Compliance check | 91% |
RTY = 0.97 × 0.94 × 0.91 = 0.830, or 83%
So only 83 out of every 100 documents make it through the entire workflow without a single rework event, even though no individual step looks particularly bad. This compounding effect surprises most operations teams the first time they calculate it.
The hidden factory
The "hidden factory" is the informal rework system that grows up around processes with poor FPY. Workers develop workarounds. Inspectors flag and re-route units. Supervisors run catch-up shifts. None of this shows up on official capacity plans or scheduling boards because it was never designed in; it evolved to cover up quality gaps.
RTY makes the hidden factory visible. When RTY is 83%, roughly 17% of your throughput capacity is consumed by the hidden factory. For a team with ten people, two of them are effectively working full-time on rework, but nobody calls it that.
Eliminating the hidden factory is one of the fastest paths to capacity recovery without hiring. This connects directly to how teams identify business bottlenecks and free up flow.
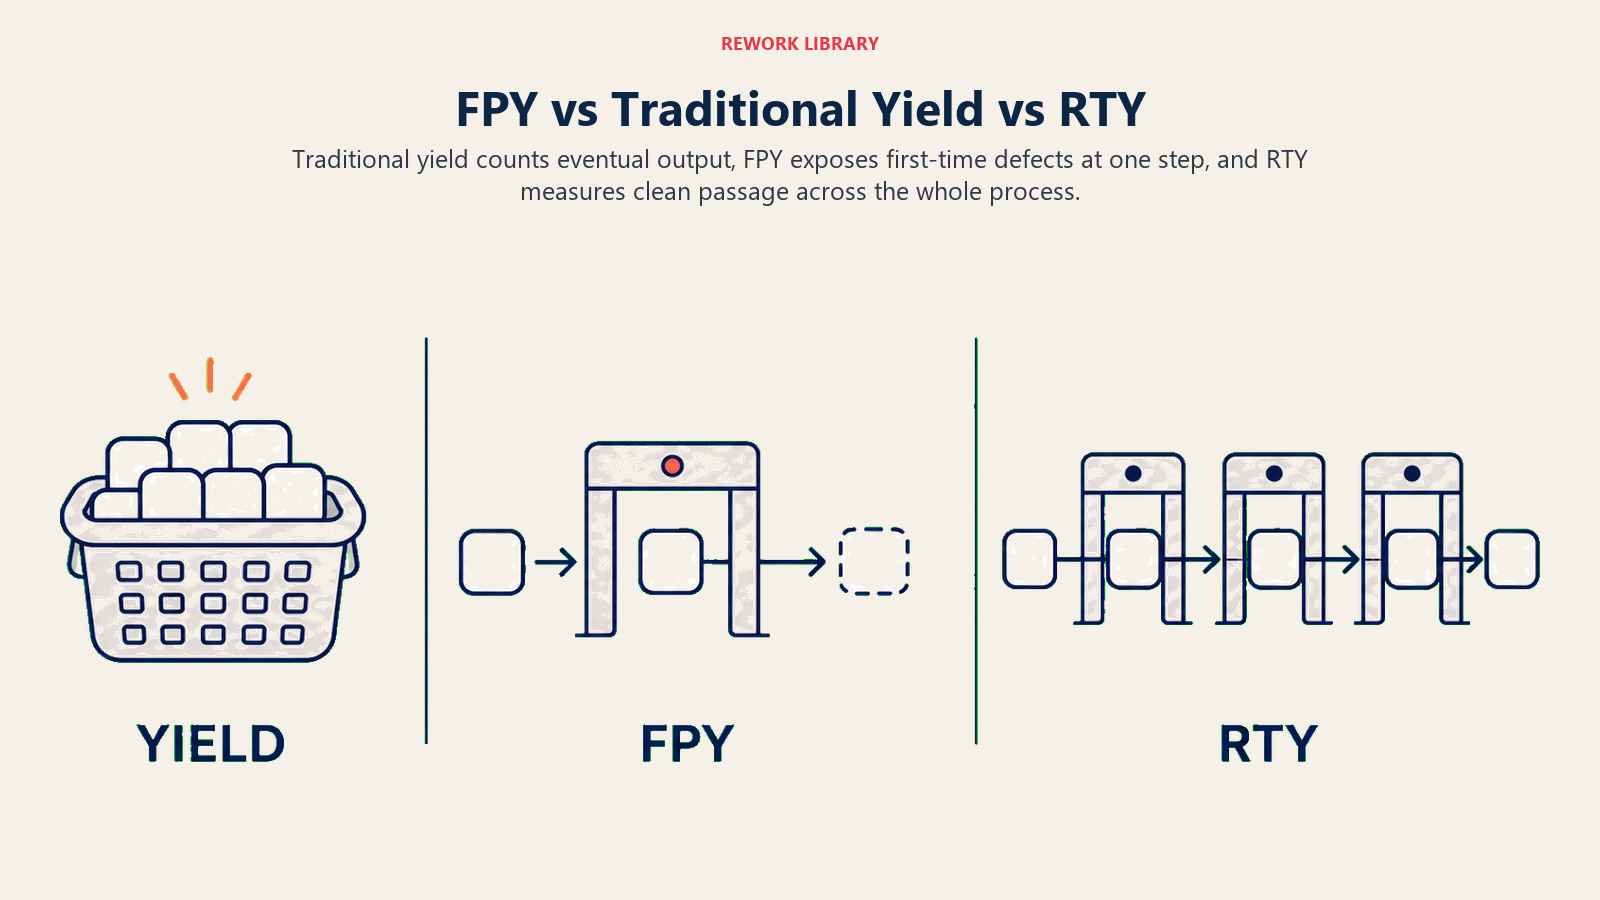
FPY vs traditional yield vs RTY
Traditional yield counts eventual output, FPY exposes first-time defects at one step, and RTY measures clean passage across the whole process.
| Metric | What it counts | Counts rework? | Multi-step? | Best used for |
|---|---|---|---|---|
| Traditional yield | Units out / units in | Yes | No | Customer-facing output reporting |
| First pass yield (FPY) | Units passing correctly, first time | No | No (single step) | Step-level quality diagnosis |
| Rolled throughput yield (RTY) | Probability a unit passes ALL steps first time | No | Yes | End-to-end process health, hidden factory sizing |
The three metrics answer different questions. Traditional yield tells you what your customer received. FPY tells you how clean each step is. RTY tells you how much waste runs through the whole process.
In most improvement projects, you start with RTY to spot the weakest step, then use FPY to drill into that step, then use DPMO and sigma level to quantify and set targets.
Why first pass yield matters
The short answer is cost. Every rework event consumes labor, machine time, and materials. But the effects run wider than the direct cost:
Cycle time. A unit sent to rework re-enters the queue. Lead times stretch. Customers wait longer. In service industries, a returned file or resubmitted application can delay outcomes by days or weeks.
Capacity. Rework consumes the same machines and people as production. A process running at 80% FPY is, in effect, running at roughly 80% of its designed capacity, because 20% of inputs cycle back through. Recovering FPY is often cheaper and faster than buying new equipment.
Process capability data quality. When reworked units are mixed back into the output stream without being flagged, statistical process control charts see a cleaner picture than reality. Control limits look tighter than they are. Teams miss signals that the process is drifting.
Morale. Workers who spend significant time fixing problems they did not cause get frustrated. When FPY improves, rework decreases, and the job gets cleaner and faster. Teams consistently report higher engagement when quality metrics improve.
See also process KPIs and cost of quality for the broader measurement framework that FPY slots into.
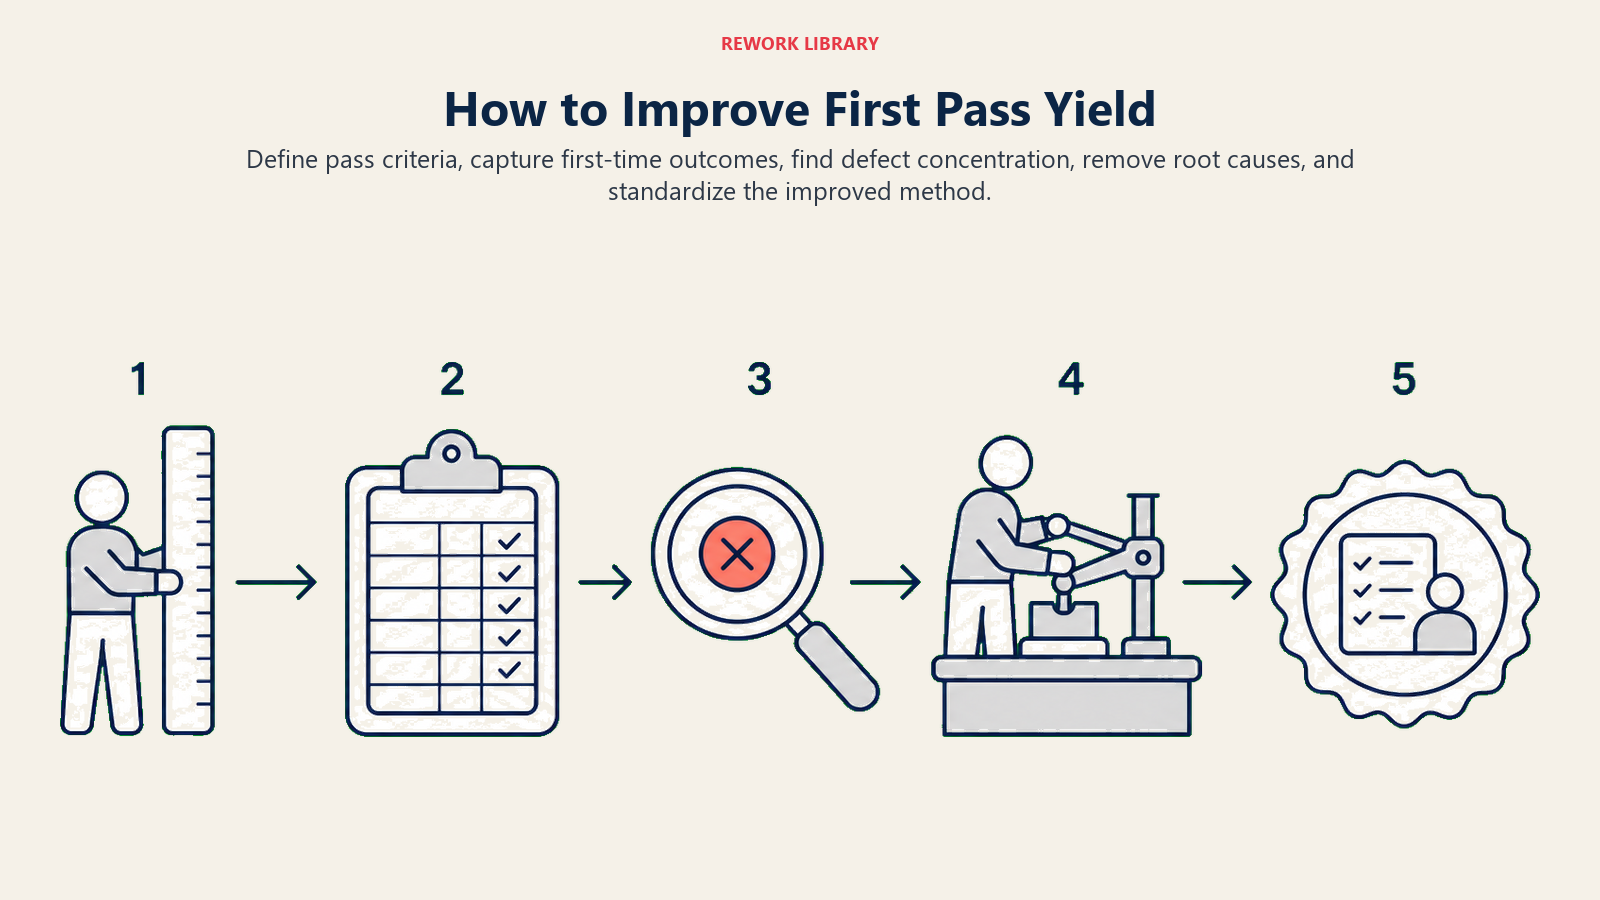
How to measure and improve first pass yield
Define pass criteria, capture first-time outcomes, find defect concentration, remove root causes, and standardize the improved method.
Step 1: Define the unit and the defect
You can't measure FPY without agreeing on what counts as a pass. Write down the exact acceptance criteria for a unit before any rework occurs. This includes dimensions, functional tests, checklist completions, or approval signatures, depending on your process type. Ambiguous criteria lead to inconsistent inspection, which corrupts the data.
Step 2: Track first-time outcomes at each step
This is the data collection challenge. Most systems record only final output, not whether rework occurred. You need a tally at each step: units in, units passing first time, units sent to rework. A simple tally sheet works. A control chart works better, because it shows trends and signals process shifts.
Step 3: Calculate FPY and RTY
Once you have step-level data, FPY is a simple ratio. RTY is the product of all step FPYs. Calculate both. RTY almost always shocks teams because the compounding math makes the whole-process picture worse than any single step suggests.
Step 4: Identify the biggest contributor to RTY loss
The step with the lowest FPY contributes most to RTY degradation, but not always the most absolute defects. A step running at 75% FPY with 100 units through it contributes 25 rework events. A step running at 98% FPY with 2,000 units through it contributes 40 rework events. Prioritize by total rework volume, not just percentage.
A proper DMAIC project then investigates root causes: machine variation, operator technique, incoming material quality, or unclear instructions.
Step 5: Set targets and control the gains
Once root causes are addressed, raise the FPY target for the improved step and monitor control charts to confirm the process holds. Gains from FPY improvement tend to be stable because you've fixed the underlying cause, not just screened out defects at the end.
Recalculate RTY after each step improvement. Teams usually see a non-linear RTY lift when even one or two bottleneck steps improve significantly.
Examples across process types and industries
| Industry | Process | Typical FPY driver |
|---|---|---|
| Electronics manufacturing | PCB assembly and AOI inspection | Solder paste volume, component placement accuracy |
| Software development | Code review and unit test pass rate | Requirements clarity, code review standards |
| Healthcare | Lab specimen processing | Sample labeling, tube selection, centrifuge protocol |
| Financial services | Loan application intake | Document completeness, applicant guidance |
| Food & beverage | Filling and sealing | Line speed, seal temperature consistency |
| Logistics | Order picking and packing | Barcode scan compliance, bin location accuracy |
The formula is the same across all of them. What counts as a "defect" changes, but the logic of measuring first-time correctness does not.
Frequently Asked Questions about First Pass Yield
What is a good first pass yield?
It depends on the process and industry. World-class manufacturing typically targets FPY above 99% per step. Transactional processes like invoice processing or HR onboarding often start below 90% before improvement programs begin. The better question is whether your FPY is improving over time, not whether it hits an arbitrary benchmark.
Is higher FPY always better?
Not unconditionally. A process that achieves 100% FPY by slowing inspection down dramatically may be trading quality for throughput. The goal is high FPY at full production speed. But in practice, for any process running below 95% FPY, pushing it higher will almost always improve both quality and throughput simultaneously, because rework is being eliminated rather than just redistributed.
How does FPY relate to sigma level?
Sigma level is a normalized measure of defect rate based on DPMO (defects per million opportunities). FPY and sigma level measure related things but are not identical. FPY counts units with any defect. DPMO counts individual defect opportunities within a unit. A unit can have multiple defect opportunities. Generally, higher FPY correlates with higher sigma level, but the exact relationship depends on how many opportunities exist per unit.
Can FPY be applied to service processes?
Yes. A document that gets sent back for corrections, a call that requires a supervisor escalation on first contact, or a ticket that bounces between teams before resolution are all rework events. FPY in service processes is often called "First Contact Resolution" or "Straight-Through Processing" depending on the context, but the math is identical.
How do you handle units scrapped rather than reworked?
Scrapped units reduce FPY by the same calculation: they did not pass on the first attempt and cannot be reworked into a good unit. For RTY, scrapped units effectively mean zero units are passed through subsequent steps. In practice, scrap is treated as a separate metric alongside FPY (scrap rate) to distinguish total loss from recoverable rework.
First pass yield and rolled throughput yield give you a clear, honest picture of process health, one that traditional yield metrics were never designed to provide. When teams start tracking FPY seriously, the hidden factory becomes visible, and so does the path to recovering capacity without additional headcount or capital. The next step is usually connecting FPY data to a cost-of-quality framework, so the improvement business case writes itself.
Related reading

Senior Operations & Growth Strategist
On this page
- What is first pass yield?
- The first pass yield formula
- Rolled throughput yield (RTY)
- The hidden factory
- FPY vs traditional yield vs RTY
- Why first pass yield matters
- How to measure and improve first pass yield
- Step 1: Define the unit and the defect
- Step 2: Track first-time outcomes at each step
- Step 3: Calculate FPY and RTY
- Step 4: Identify the biggest contributor to RTY loss
- Step 5: Set targets and control the gains
- Examples across process types and industries
- Related reading