Demand-to-Dealer Pull-Through: Closing the Loop Between Farmer Intent and Dealer Sales
Turn this article into takeaways for your work.


Each assistant summarizes the article only for you and suggests best practices for your work.
A field rep runs 40 farmer meetings across a district over three weeks. She's visiting paddy villages in Nalgonda, walking plots, showing chlorothalonil application timing, explaining why the fungicide outperforms what most farmers have been using. Farmers are asking good questions. They're asking about pricing. They're asking which dealer stocks it. She finishes the round confident this season is going to perform.
Then the secondary sales data lands. The dealer in Nalgonda sold half the volume she projected. The dealer in the neighboring block sold almost nothing.
The demand existed. Farmers intended to buy. But somewhere between the advisory visit and the point of sale, the conversion evaporated.
This is the defining measurement problem in agri-input field sales. Farmer contact volume is not pull-through. A rep can hit 100% of her meeting targets and still generate zero commercial return if the handoff from farmer intent to dealer sell-out breaks. Most companies track the front end of the funnel obsessively, counting demo plots, field days, and advisory visits. They track the back end intermittently, pulling secondary sales data weeks after the buying window has closed. The gap in between, where farmer intent becomes dealer shortfall, is where the season is actually won or lost.
The Pull-Through Gap: Where Farmer Intent Becomes Dealer Shortfall
Pull-through, in agri-inputs, is the conversion rate from demonstrated farmer interest to actual dealer sell-out by SKU. When a rep runs a demo plot showing a systemic fungicide on cotton and 15 farmers watch it, the demo generates interest. Pull-through measures how many of those 15 farmers actually bought the product from a dealer during the relevant application window.
Key Facts
- When agro-input dealers engage actively with farmers at the counter, they influence product selection in 80% of cases, per a 2021 PMC study of 402 agro-dealers in Uganda (pmc.ncbi.nlm.nih.gov/articles/PMC8411546). This is the core mechanism by which dealer alignment (or misalignment) translates rep field work into sell-out.
- In one smallholder survey in the Indian Journal of Agricultural Research, roughly two-thirds of farmers said peer farmers influenced their pesticide buying decisions. Farmer-to-farmer recommendation networks either reinforce or undermine the rep's advisory work after she leaves the village.
- Agri-input brands that lack visibility into secondary sales data operate with reports arriving days or weeks after actual dealer movement has occurred, per McKinsey analysis of agri-input distribution, which identifies in-season adjustment of inventory and sales execution as "a defining capability of high-performing agri-input businesses" (mckinsey.com).
Four structural causes create the gap between intent and sell-out.
Dealer substitution is the most common and the most costly. The farmer walks into the dealer and asks for the product the rep recommended. The dealer recommends something else, either because a competitor's product has better margin, because it's more prominently displayed, or because the dealer's own rep briefed him more recently. In 60 seconds, a competitor overrides everything the rep built over three weeks. FAO's Agricultural and Food Marketing Management documents how agri-input companies must treat channel partners as customers to be marketed to, not conduits to be marketed through. That distinction determines whether dealer recommendations align with manufacturer intent at the counter.
Stock-outs kill pull-through during high-demand windows. If a rep has convinced farmers across 20 villages that chlorothalonil is the right call for paddy blast control, but the dealer only has two cases on hand when the application window opens, demand evaporates. Farmers don't wait. They buy what's available.
Competing rep influence is a timing problem. In the week after a rep finishes her district round, a competitor's rep visits the same dealers. If that rep has better material, better margins to offer, or simply more recent shelf presence, he can undo the rep's positioning before a single farmer has arrived to purchase.
Timing mismatch is the subtlest cause. A rep visits in the third week of March. The relevant application window for fungicide on wheat is the second week of April. By then, the farmer's cash position has changed, crop conditions look different, or the recommendation simply isn't fresh enough to drive action. Advisory visits that happen too far from the purchase moment lose conviction.
The cost framing matters here. The rep's travel, time, demo plot cost, and input materials are sunk at the point of the advisory visit. If pull-through is 50%, half that field investment generated zero commercial return. At 30%, the math on field-force ROI starts to look very difficult to defend.
Mapping the Demand-to-Purchase Journey
The journey from farmer contact to dealer sell-out moves through five stages, and leakage can occur at each one.
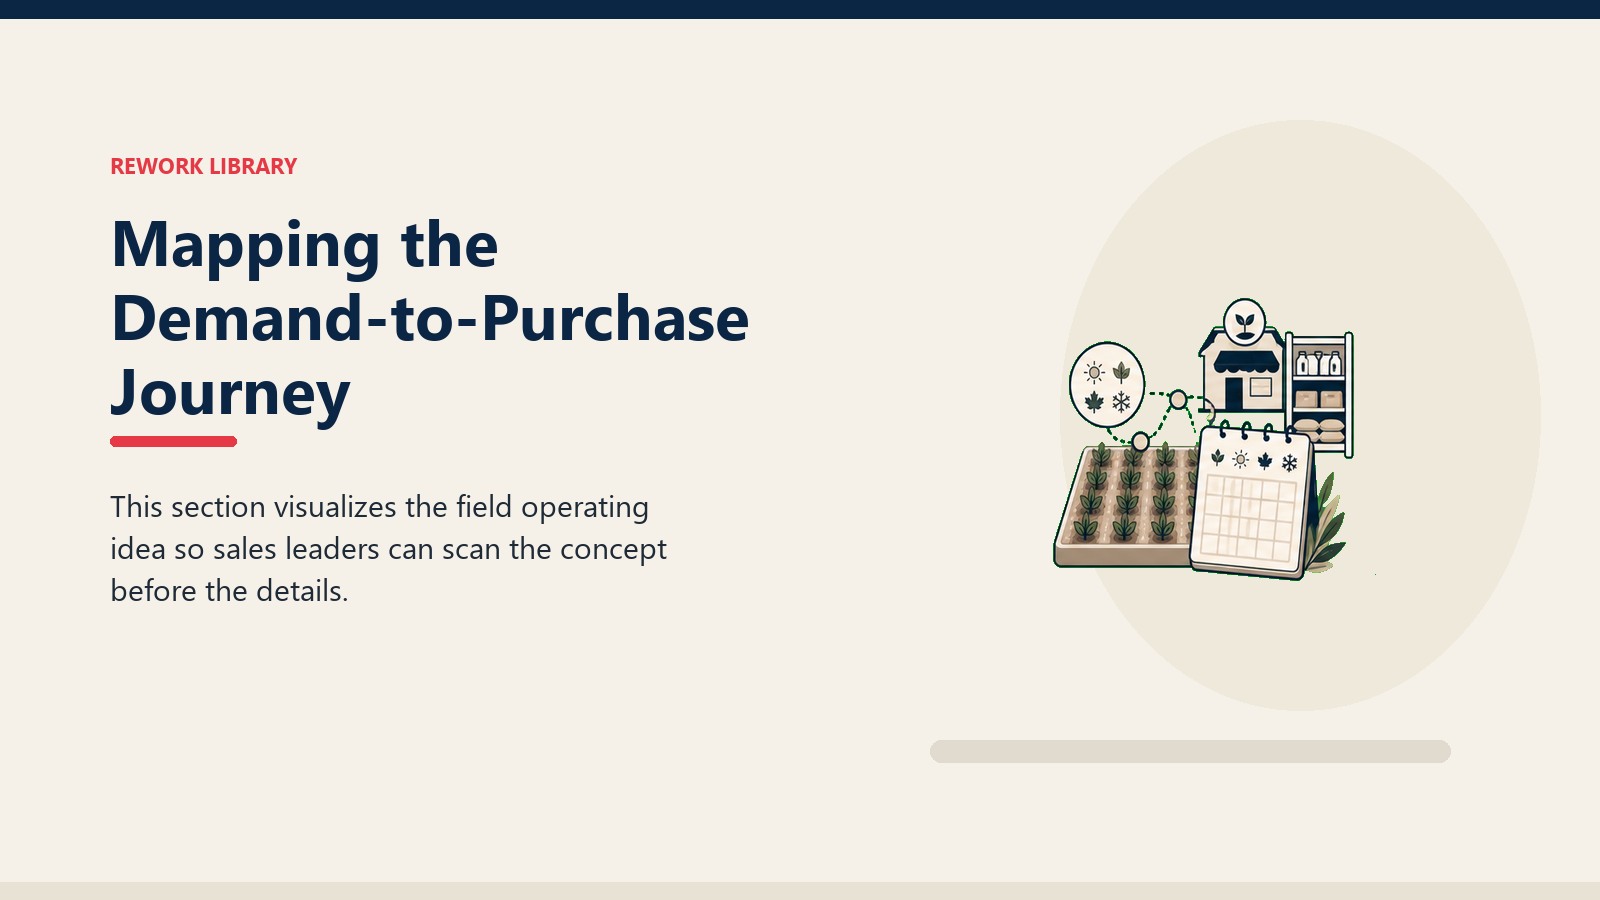
Stage 1: Advisory visit or demo plot. The rep introduces the product in context, either through a demonstration on a working plot or a structured advisory conversation. This is where farmer awareness and initial interest are built.
Stage 2: Farmer intent. The farmer decides, internally, to try or buy the product. This intent is real but fragile. It decays if nothing reinforces it in the following days, and it can be overridden by a neighbor's advice, a competitor's campaign, or simply a change in weather that shifts the perceived crop risk.
Stage 3: Farmer visits the dealer. This happens days or weeks after the advisory visit, depending on crop stage, cash availability, and how the season is progressing. The rep has no visibility into exactly when this happens unless she's built a system to track it.
Stage 4: Dealer recommendation at point of sale. This is the stage most reps ignore, and it's the highest-risk point in the journey. The dealer is making a live recommendation to the farmer at the counter. If the dealer is aligned with the rep's recommendation, he confirms it and completes the sale. If he's not, he substitutes something else. The farmer, already at the counter, usually defers to the dealer's guidance.
Stage 5: Purchase and usage. If Stage 4 holds, the sale completes and the product reaches the farm. This is also where post-purchase support matters, but for pull-through measurement, Stage 5 is the end state.
Stage 4 is where the entire upstream effort is either validated or overwritten. Good dealer relationship management isn't a courtesy activity. It's the mechanism that keeps Stage 4 aligned with Stages 1 and 2. So what specific rep behaviors actually protect that stage?
Rep Behaviors That Drive Pull-Through
Four specific behaviors separate reps who generate pull-through from reps who generate activity metrics.
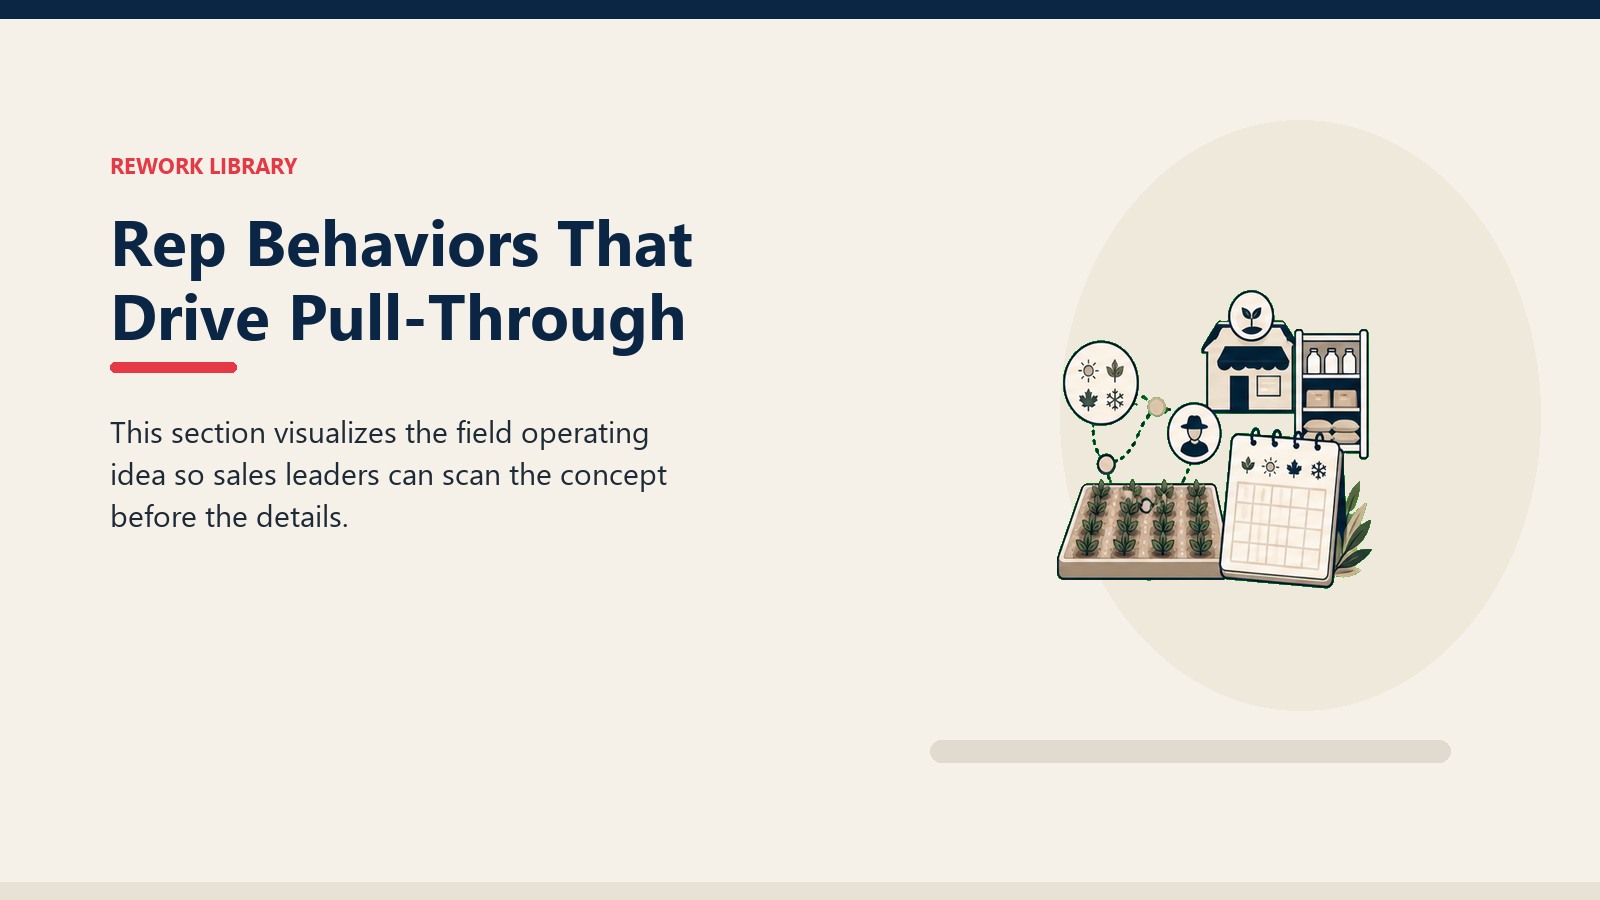
Named-farmer referrals. When the rep briefs the dealer after completing a round of farmer meetings, she names which farmers are coming and what they're planning to buy. "Mr. Suresh from Nalgonda village is planning to pick up 5 liters of the chlorothalonil formulation in the next 10 days. He mentioned he's waiting until after he sells his groundnut stock." This shifts the dealer from passive to prepared. The dealer knows to have stock. He knows what Suresh is coming for. He's less likely to substitute because the purchase has been pre-framed.
Pre-campaign dealer briefing. Before starting a round of farmer meetings in a territory, the rep briefs the relevant dealers on the campaign: the product, the message, the application timing, the target farmer segment. Dealers should hear about the rep's campaign from the rep, not from farmers arriving at the counter. A dealer who is caught off-guard by sudden farmer demand for a product he knows nothing about is far more likely to fumble the sale.
Farmer-to-dealer message reinforcement. Give the farmer something to carry to the dealer: a product card, a trial result summary from the demo plot, an application timing guide. When the farmer arrives at the dealer with a tangible reference, the recommendation arrives with him. It's harder for the dealer to override a recommendation that the farmer is holding in his hand. This is a simple tactic but it meaningfully closes the gap between advisory intent and point-of-sale execution. It connects the work described in demo plot demand generation directly to the dealer counter.
Timing the visit within the buying window. The advisory visit should happen 7 to 14 days before the crop stage when the purchase is needed. Not four weeks before. Intent decays. A farmer who was convinced to try a systemic fungicide in early March will not remember the recommendation with the same clarity in mid-April when the wheat is heading and his neighbor is telling him something different. The dealer visit playbook covers how to sequence rep activity against the crop calendar, which is the most underused tool in territory planning.
Dealer Enablement for Pull-Through
The dealer is the last mile. Farmer intent only converts when three things are in place at the dealer level before the buying window opens.
Stocking confirmation. The dealer must have adequate inventory of the specific SKU the rep has been promoting. This sounds obvious, but it's routinely missed. Reps assume dealers will stock up based on historical patterns. They don't verify until after the window has opened and farmers have already been turned away. The rep's dealer briefing should include an explicit stock review and, where necessary, a restocking prompt with the distributor. Liquidation and secondary sales tracking gives the framework for linking stocking levels to sell-out velocity so the rep can identify under-stocked dealers before the window, not after.
Aligned talking points. The dealer should be able to explain the product benefit in the same language the rep used with farmers. Not word-for-word, but aligned. If the rep spent three weeks telling paddy farmers that chlorothalonil is more effective than mancozeb for blast control because of its multi-site mode of action, and the dealer tells the arriving farmer "it's a fungicide, works fine," that disconnect undermines both the product's perceived value and the farmer's confidence in the rep's recommendation. A 10-minute dealer briefing that covers the product's core claim is enough to close this gap.
Display and point-of-sale visibility. A product that isn't visible at the dealer counter is easily substituted. Point-of-sale material, shelf placement, and trial result posters are not marketing luxuries. In a village dealer shop where 20 products compete for 3 feet of shelf space, visibility is a commercial decision with direct pull-through consequences. This is one reason dealer relationship management involves tracking in-store placement, not just purchase orders. But stocking and visibility only matter if you can measure whether they're actually translating to sales.
Tracking Pull-Through by Territory
Pull-through rate is calculated as: dealer sell-out of the promoted SKU divided by total farmer intent signals from field activity in that territory over the same crop window.
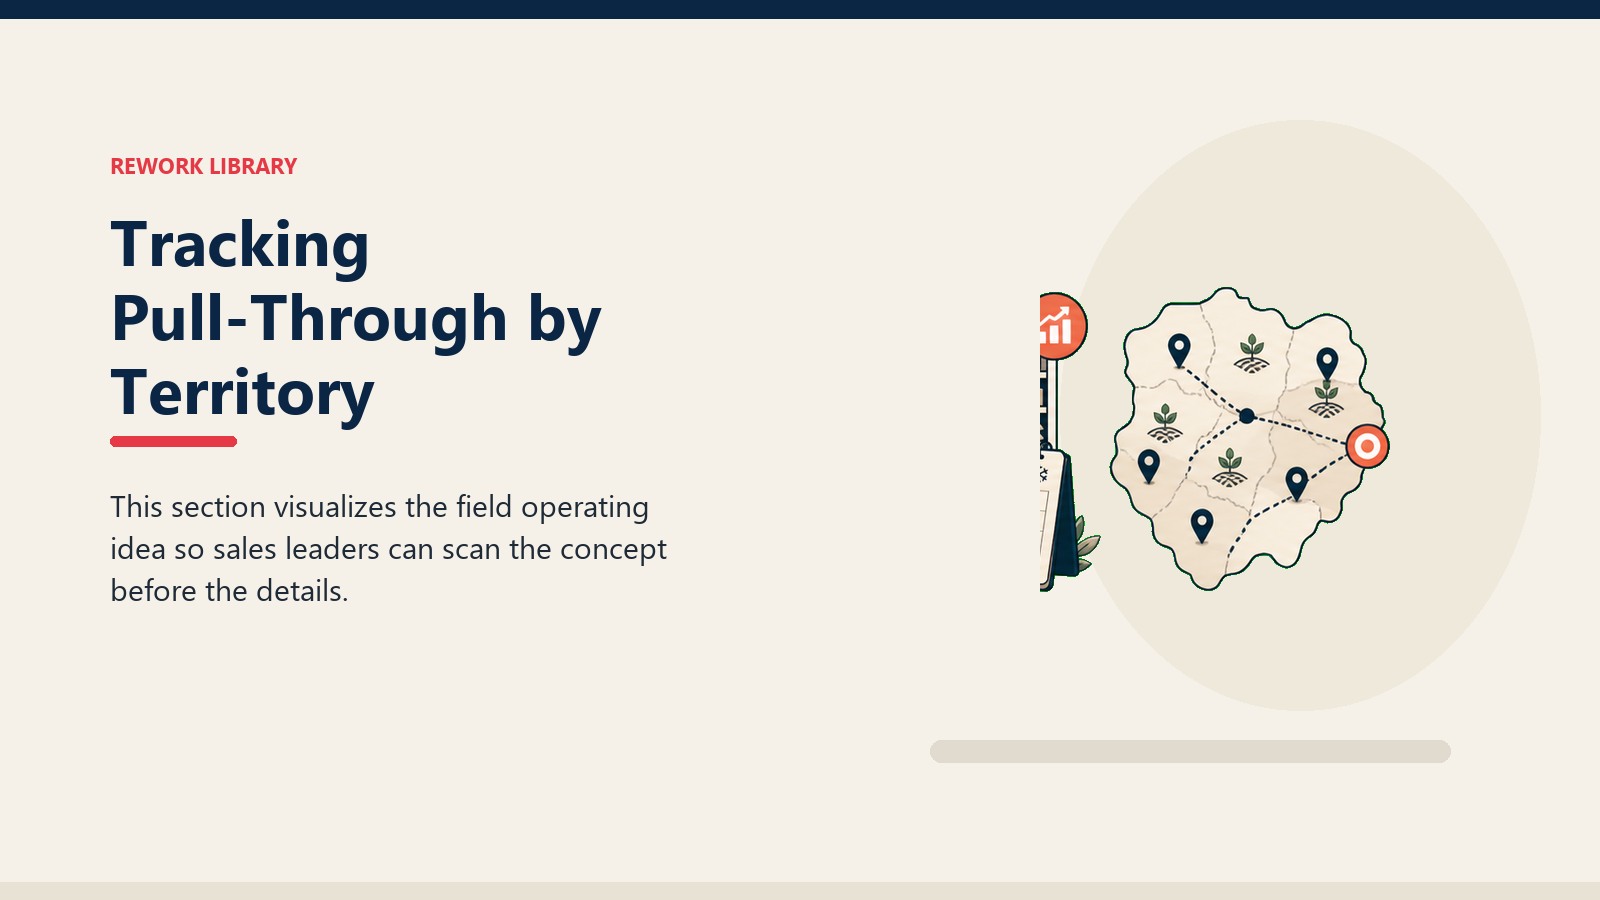
The table below gives benchmarks for interpreting pull-through rates.
| Pull-Through Level | Rate | Implication |
|---|---|---|
| Excellent | >75% | Demand generation and dealer alignment working well |
| Acceptable | 50-75% | Some leakage at dealer stage; investigate substitution or timing |
| Below target | 30-50% | Structural gap: stocking, messaging, or timing misaligned |
| Critical | <30% | Field activity generating no commercial return; investigate root cause |
Calculating this requires linking two data sets: field activity records (demo plots run, farmer meetings held, villages covered) and secondary sales data by dealer by SKU from the same geography in the same four-to-six week window. The field activity records should come from the rep's SFA system. The secondary sales data comes from the distributor or through dealer sell-out surveys.
The overlap between these two data sets, by village and by dealer catchment, gives the pull-through rate at the territory level. Field reporting and demo tracking covers the data capture side. Liquidation and secondary sales tracking covers the sell-out side. The pull-through rate is what connects them.
If you're coming from a general sales context, the logic maps closely to pipeline coverage analysis, which examines how well the opportunity funnel is stocked relative to target. The math is the same. The data sources are different. And the data only gets captured if reps are actually logging demand signals the day of the visit.
Demand Signal Reporting
Reps generate demand signals every day. A farmer says he wants to try the new herbicide on his next maize block. Another says she'll buy if the price holds. A third asks to see trial results before committing. These are demand signals. And in most agri-input organizations, they die in a field diary or a WhatsApp message to the territory manager.
The demand signal is the handoff from farmer advisory work to dealer commercial execution. Without it, the dealer has no idea which farmers the rep has just convinced, and the rep has no record of the specific commitments she built during the field round. Agricultural marketing as a discipline covers exactly this gap: the services involved in moving a product from producer to consumer, including the planning, distribution, and handling that connects farmer intent to point-of-sale execution.
What to log in the CRM or SFA: farmer name, village, crop, intended product and quantity, likely purchase timing relative to crop stage. What not to log: generic impressions ("farmers interested," "positive reception"). The demand signal only has commercial value if it's specific enough to act on.
When to log it: the same day as the advisory visit, not at the end of the week. Intent decays on both sides. The rep forgets the nuance. The dealer visit that was supposed to happen on Thursday gets pushed to the following week. A same-day log preserves the signal when it's strongest.
Who sees it: the rep's dealer visit plan for the following week should pull from the demand signal log, organizing the follow-up around the dealers whose catchment areas include the high-intent farmers. This is what agri sales CRM and SFA is designed to support: closing the loop between field advisory work and dealer-facing commercial follow-through.
For a view of how demand signals connect to sell-out data in a broader distribution context, secondary sales and stock visibility frameworks from FMCG distribution show how this same challenge scales. The mechanics translate directly to agri-inputs.
Alignment Meeting Cadence
Two cadence levels keep demand and dealer execution in sync across the season.
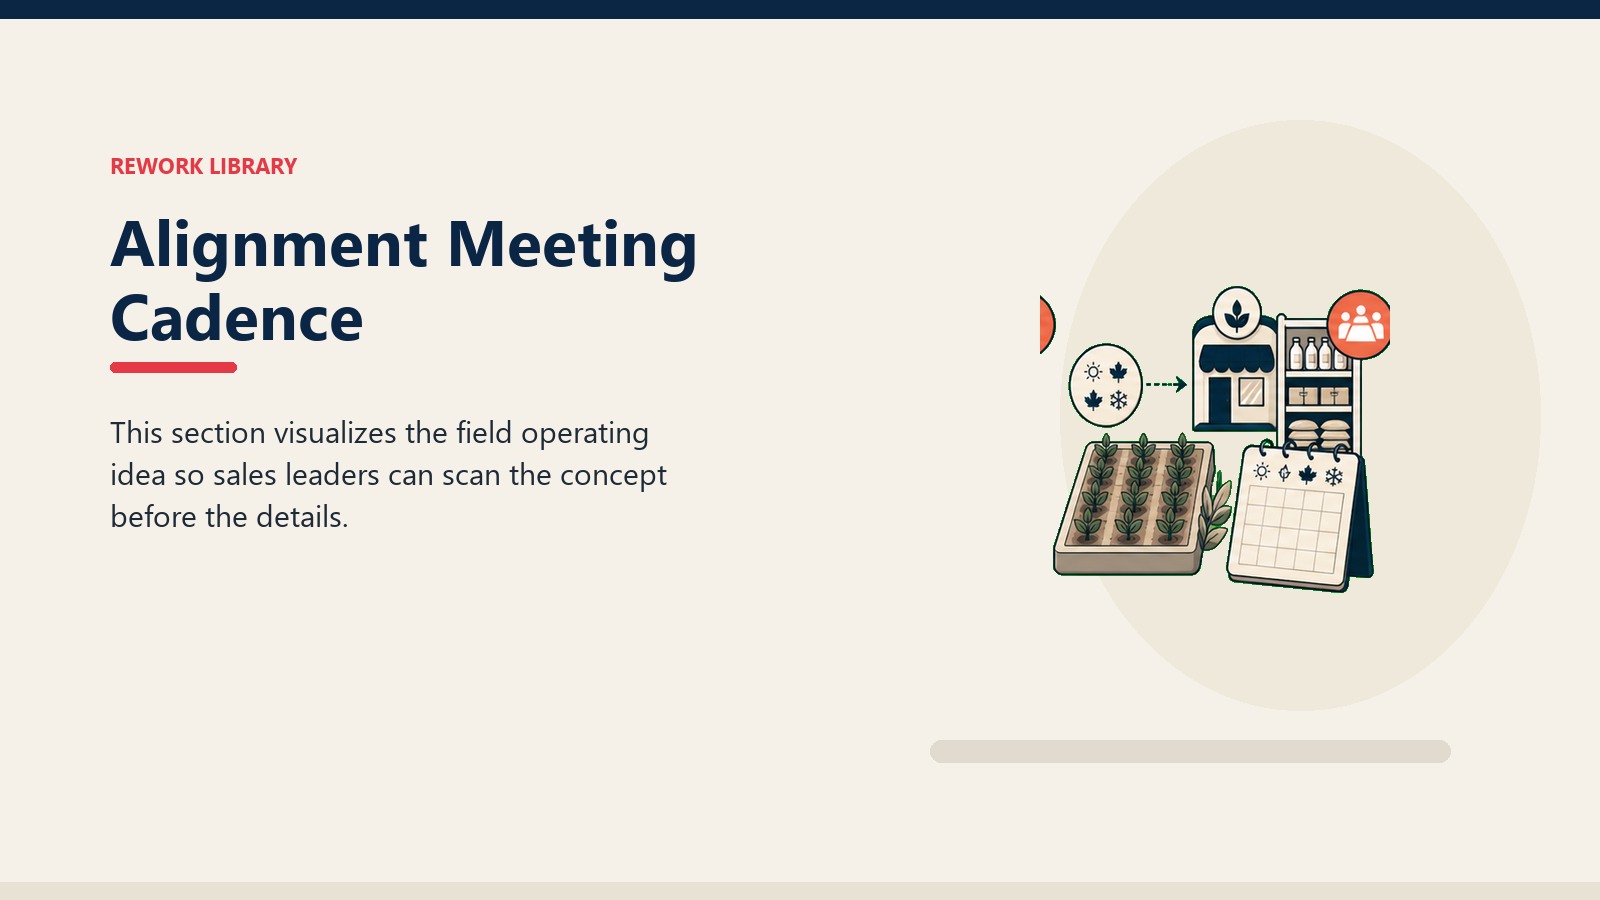
Weekly rep-dealer check-in. This meeting should be timed to crop stage, not to the calendar. In the two weeks before a critical application window (wheat heading, paddy tillering, cotton boll development), the rep should be at the dealer weekly. The agenda is simple: which farmers have come in from the advisory round, what did they buy, what's still outstanding from the intent list, and do we have enough stock to cover what's expected. This is not a relationship visit. It's an operational conversation.
Monthly territory review. This is the meeting where pull-through rate is calculated and discussed, linking demand generation activity (demo plots run, farmer meetings held, field days hosted) to sell-out data by SKU by dealer. Reps who arrive at this review with pull-through rate by territory, broken down by dealer and by SKU, earn credibility with territory managers that reps who only report contact volume cannot match. The number answers the question the territory manager actually cares about: did the field activity generate revenue?
A brief alignment checklist by season phase keeps the cadence structured:
Pre-season (6-8 weeks before planting/critical input window): Stocking confirmation with each key dealer, product positioning briefed, point-of-sale material placed, crop calendar mapped to advisory visit schedule.
In-season (during active application windows): Weekly check-ins with key dealers, demand signal log reviewed against actual purchases, stock replenishment flagged to distributors as needed.
Post-season: Pull-through rate calculated and reviewed, dealer performance against projected sell-out assessed, farmer feedback on product experience collected for next cycle.
Season campaign planning covers the broader seasonal sequencing, including how to align these cadences with territory targets and company-wide campaign timing. Which raises the question every territory manager eventually faces: when the season ends, how do you know whether the field activity actually drove the revenue?
Quotable Nuggets
"A rep can hit 100% of her meeting targets and still generate zero commercial return if the dealer isn't aligned before the farmer walks in. Activity metrics and pull-through metrics are measuring different things." (Demand-to-dealer conversion principle)
"The demand signal is the handoff from field advisory to dealer commercial execution. Without a named-farmer referral from the rep, the dealer has no idea which farmers are coming or what they intend to buy. The substitution happens in that information vacuum." (Pull-through alignment practice)
"In-season secondary sales data that arrives three weeks late isn't intelligence. It's history. The commercial window for correction has already closed." (McKinsey analysis of agri-input distribution, paraphrased from mckinsey.com/industries/agriculture)
Frequently Asked Questions about Demand-to-Dealer Pull-Through
What is pull-through rate and how is it calculated?
Pull-through rate is the percentage of demonstrated farmer intent that converts to actual dealer sell-out of the promoted SKU within the relevant application window. The formula is: dealer sell-out of the target SKU in a territory, divided by total farmer intent signals logged for that product in the same geography during the same crop stage window. A pull-through rate above 75% indicates field activity and dealer execution are working together. Below 30% signals a structural breakdown: either stocking, messaging, timing, or dealer alignment has broken down.
Why does dealer substitution happen even when the farmer asked for the rep's recommended product?
Three reasons, in rough order of frequency. The dealer may not have the product in stock and defaults to whatever achieves the same crop outcome for the farmer. The dealer may get better margin from an alternative product and actively recommends it. Or the dealer simply doesn't know the product well enough to confidently close the sale the farmer walked in intending to make. Pre-campaign dealer briefing and named-farmer referrals address all three: the dealer is stocked, briefed, and knows who's coming and what they asked for.
How far in advance should the rep conduct advisory visits relative to the farmer's purchase window?
7 to 14 days is the target range. Earlier than that, and farmer intent decays before they reach the purchase decision. Later than that, and competing information (a neighbor's advice, a competitor's promotion, a changed weather outlook) fills the gap the rep left. The advisory visit should happen close enough to the buying window that the recommendation is still top of mind when the farmer reaches the dealer counter.
What data sources does a rep need to calculate pull-through rate by territory?
Two sources: field activity records and secondary sales data. Field activity records come from the SFA system and capture demo plots run, farmer meetings held, and demand signals logged (named farmers with stated purchase intent and timing). Secondary sales data comes from distributors or dealer sell-out surveys and captures SKU-level movement from dealer to farmer within a defined geographic zone. Linking these two data sets by dealer catchment area, by SKU, and by the same crop window gives the pull-through rate at territory level.
How should reps handle a situation where the dealer is actively substituting the recommended product?
Directly, not defensively. The rep's conversation with the dealer needs to cover: why the product the rep has been promoting is the better technical fit for the farmers in this territory, what support the rep will provide the dealer if she sends farmers in for it, and whether there's a stocking or margin issue that needs to be resolved. If the dealer is substituting because of margin, the rep should surface that to her RSM and explore whether a promotional support arrangement is available. Trying to win the dealer argument without understanding the substitution motive usually fails.
The Demand-to-Dealer Conversion Model: Five stages move from field work to purchase: Advisory Visit, Farmer Intent, Farmer-to-Dealer Visit, Dealer Recommendation at the counter, and Purchase. Leakage can occur at each stage. Stage 4 (Dealer Recommendation) is the highest-risk point, the one most directly controlled by what the rep does in the days before the farmer arrives. Named-farmer referrals and pre-visit dealer briefing are the two interventions that protect Stage 4 from substitution.
Learn More
Related reading on demand generation, dealer management, and pull-through tracking:

Senior Implementation Consultant