Sales and Distribution Supply Alignment: How Field Sales and Supply Chain Win Peak Season Together
Turn this article into takeaways for your work.


Each assistant summarizes the article only for you and suggests best practices for your work.
The kharif sowing window opens in June. Your field reps have been working dealers for six weeks, running demo plots, pushing seed treatment bundles, building stocking commitments. A regional manager forecasts strong demand. The supply team gets the signal in late May. But the primary distributor in three districts is sitting below 10 days of cover because the warehouse transfer was delayed by a fortnight. Dealers who committed to stock call competing brands. Farmers at the counter hear "out of stock" and walk away with whatever is available.
The sales team blames supply. Supply points to the late forecast. And the revenue that took weeks to build evaporates in a few days because nobody owned the handoff between what reps promised and what operations could actually deliver.
This is the alignment gap in agri-inputs commercial operations. And it is more expensive than most organizations measure, because stock-outs at the height of demand don't just cost the season's primary sales. They cost dealer loyalty, farmer trial conversion, and the commercial momentum that took an entire pre-season to build.
What Actually Breaks When Field Sales and Supply Chain Are Misaligned?
Misalignment between field sales and supply chain in agri-inputs isn't a communication problem. It's a structural problem with how planning cycles, data flows, and decision rights are built.
| Current State (Misaligned) | Aligned State |
|---|---|
| Field reps submit demand forecasts informally via WhatsApp or call to RSMs | Reps submit structured seasonal indent forms with dealer-level stocking intent and crop area data |
| Supply planning runs on historical primary sales data, 6-8 week lag | Supply planning uses field forecasts plus secondary sales signals to project seasonal demand |
| Regional buffer stocks are set centrally without field input | Regional stocks are pre-positioned based on crop calendar milestones and rep-submitted intent volumes |
| Distributor stock levels are checked ad hoc when complaints arise | Distributor stock visibility is tracked weekly against minimum cover thresholds |
| Stock-outs surface through dealer complaints or rep visits | Early warning triggers fire when distributor cover falls below 14 days for priority SKUs |
| Sales and supply meet only during escalations | Joint sales-supply planning sessions run monthly with a formal cadence and shared scorecard |
| Delivery OTIF is tracked by supply in isolation | OTIF is a shared KPI on the commercial dashboard, reviewed by both sales and supply leadership |
The core structural problem is that field reps operate on a crop-calendar clock while supply planning operates on a procurement-and-logistics clock. These two rhythms diverge most painfully in the six weeks before sowing, when demand builds faster than traditional planning cycles can respond.
The fix isn't a better system. It's a shared operating model: defined inputs, defined handoffs, and a cadence that forces both sides to surface conflicts before they become stock-outs. Supply chain management literature identifies the root tension clearly: sales departments push for higher inventory levels to avoid stock-outs while operations prefers leaner holdings to cut costs. That structural conflict only resolves when both functions share the same demand signals and review the same performance data.
Key Facts
- McKinsey identifies in-season adjustment of inventory, sales execution, and market development as "a defining capability of high-performing agri-input businesses" (mckinsey.com/industries/agriculture). Companies that cannot adjust stock positioning mid-season consistently lose the commercial window that took the entire pre-season to build.
- Agri-input brands that lack real-time secondary sales visibility operate from distribution reports arriving days or weeks after actual dealer movement, per BeatRoute's analysis of agri-input distribution gaps (beatroute.io/sales-execution/agri-input-revenue-leak). An industry estimate, not independently verified by a third-party study, puts total seasonal revenue leakage from disconnected placement, demand generation, and liquidation at approximately 30%.
- OTIF (on-time, in-full) benchmarks for B2B distribution sit at 90% or higher for standard performance and 95%+ for best-in-class, per supply chain practice standards (mrpeasy.com/blog/on-time-in-full-otif). In agri-inputs, where the delivery window is measured in days rather than weeks, OTIF below 90% during peak sowing is a direct commercial loss, not a logistics metric.
Demand Signal Operating Model: What Reps Submit and When
A field rep's knowledge of dealer stocking intent, crop area under active cultivation, and competitor activity at the retailer level is worth far more than the historical sales data supply teams typically rely on. But that knowledge needs to be structured to be useful.
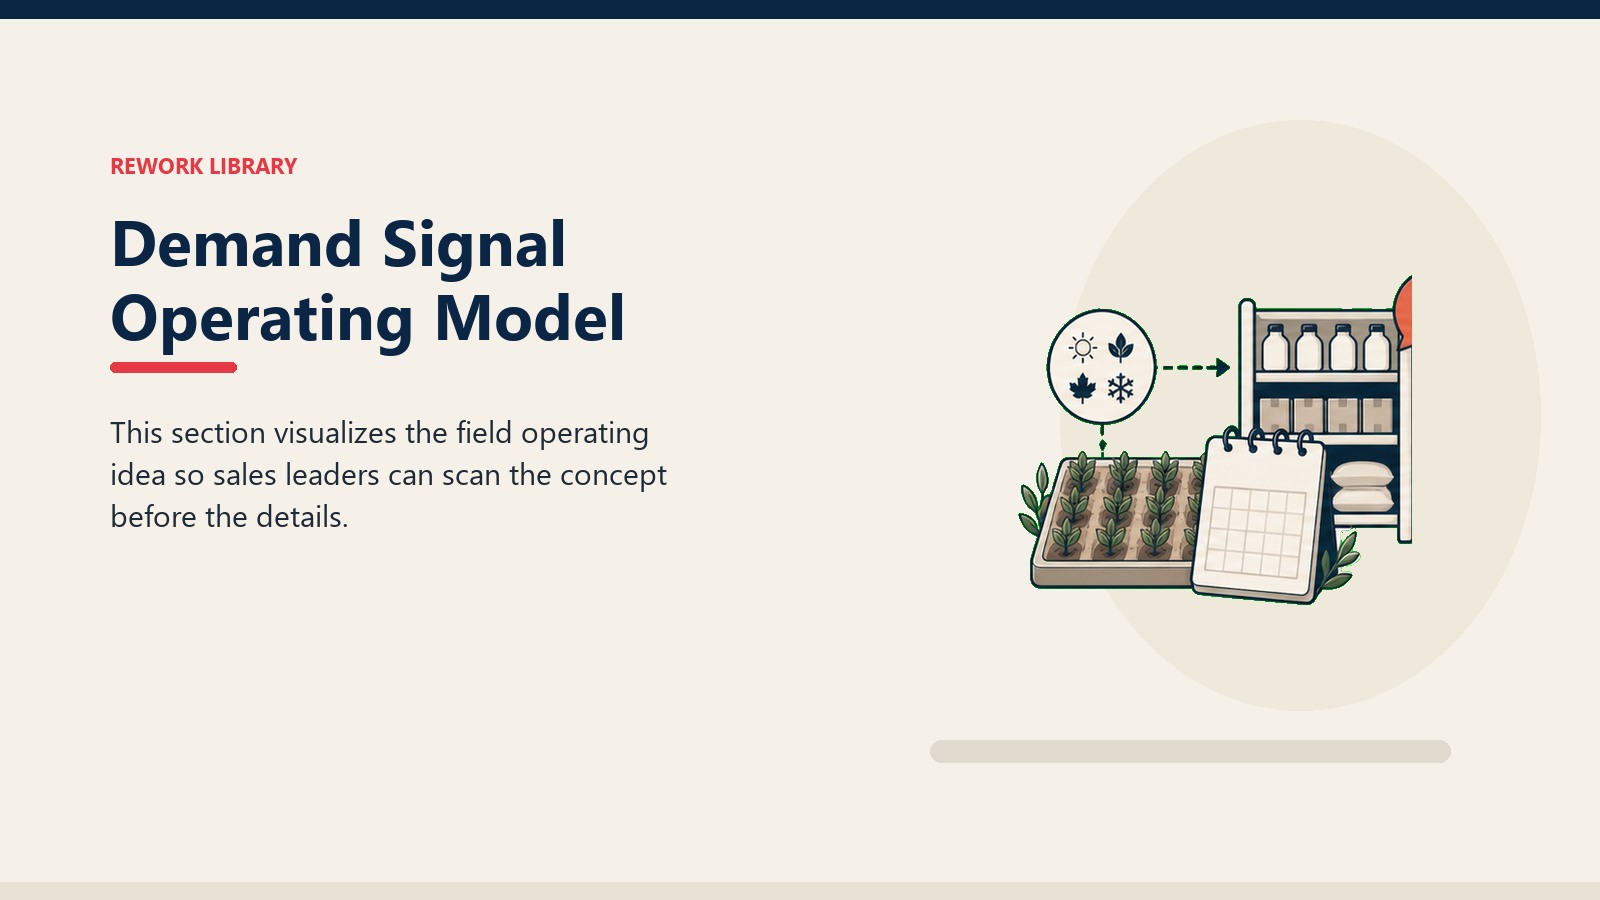
The demand signal model works in two cycles: a pre-season indent round and an in-season rolling update.
Pre-season indent round runs 10-12 weeks before the primary sowing date for each crop season. Each rep submits a forecast by territory covering the following fields:
| Field | What to Enter |
|---|---|
| District and territory code | Standard zone reference |
| Primary crop and sowing window (date range) | Rice-kharif June 15-July 10; Cotton-kharif May 25-June 20 |
| SKU and pack size | Product code, unit pack |
| Dealer stocking intent (volume, in units) | Collected from top 5 dealers per territory during pre-season visits |
| Demo plot pipeline (units allocated) | Units committed to demo plots scheduled in the season |
| Competitor stocking level estimate | High / Medium / Low based on dealer visits |
| Risk flag | Early / On-track / At-risk based on monsoon forecast and market signals |
This isn't a demand planning exercise that lives in a spreadsheet with 40 fields. It's a structured field visit output. Reps who are visiting dealers to build stocking commitments are collecting this data anyway. The indent form channels it into something supply can act on. FAO's analysis of input and equipment supply services shows that effective private-sector input distribution requires "equal opportunities to trade" and clear market signals, conditions that depend on exactly this kind of ground-level demand data flowing from field to supply.
In-season rolling update runs every three weeks during active sowing periods. Reps update two fields: actual dealer offtake versus committed stocking levels, and any signals of demand acceleration or risk (crop stress, late monsoon, competitor promotion). This is a five-minute update, not a reporting burden, and it lets supply teams adjust regional buffer allocations before the problem becomes a stock-out.
For a fuller treatment of how seasonal demand signals connect to route-to-market design, see Route to Market for Agri Inputs and Seasonal Supply Chain and Inventory.
Pre-Positioning and Stock Allocation Logic
Field forecasts are only useful if supply teams translate them into stocking actions on a defined timeline. The translation requires a simple decision framework that converts signal strength into allocation action.
Signal strength assessment combines two inputs: the confidence level of the rep's dealer intent data (based on number of dealers visited and quality of the commitment conversation) and the historical accuracy of that rep's prior forecasts. A rep who has consistently over-forecast by 30% carries lower signal weight than one with tight accuracy history.
| Signal Strength | Coverage of Territory Dealers | Historical Forecast Accuracy | Stocking Action |
|---|---|---|---|
| Strong | 70%+ of top dealers visited with written commitment | Within 15% of actual in prior season | Pre-position full indent volume at primary distributor 6 weeks ahead of sowing |
| Moderate | 40-70% of top dealers visited with verbal commitment | 15-30% variance from actual in prior season | Pre-position 70% of indent volume; hold 30% at regional warehouse for fast top-up |
| Weak | Below 40% of dealers visited or intent unconfirmed | Over 30% variance from actual or first-season territory | Pre-position 50% of indent; plan a three-week in-season replenishment trigger |
| No signal submitted | Rep did not submit indent by deadline | N/A | Use prior season actuals adjusted for crop area change; flag for field manager follow-up |
The allocation decisions from this table feed directly into the primary distributor pre-load schedule. Distributor pre-loads happen in waves: an initial loading 8 weeks before sowing, a replenishment trigger when distributor cover falls below 21 days, and an emergency top-up protocol (48-hour lead time, priority logistics) for in-season spikes.
Regional warehouse buffer stocks absorb variance. They're sized at 15-20% of the total pre-season indent for a region, specifically to fund the moderate and weak signal territories when their demand outpaces the conservative pre-position.
This connects directly to Pre-Season Stocking and Liquidation and the Distributor and Wholesaler Management operating model for how those pre-loads get managed commercially once they land.
Last-Mile Delivery Coordination
Pre-positioning handles the planned demand. But in-season demand spikes, logistics failures, and distributor stock management gaps are what actually break the chain.
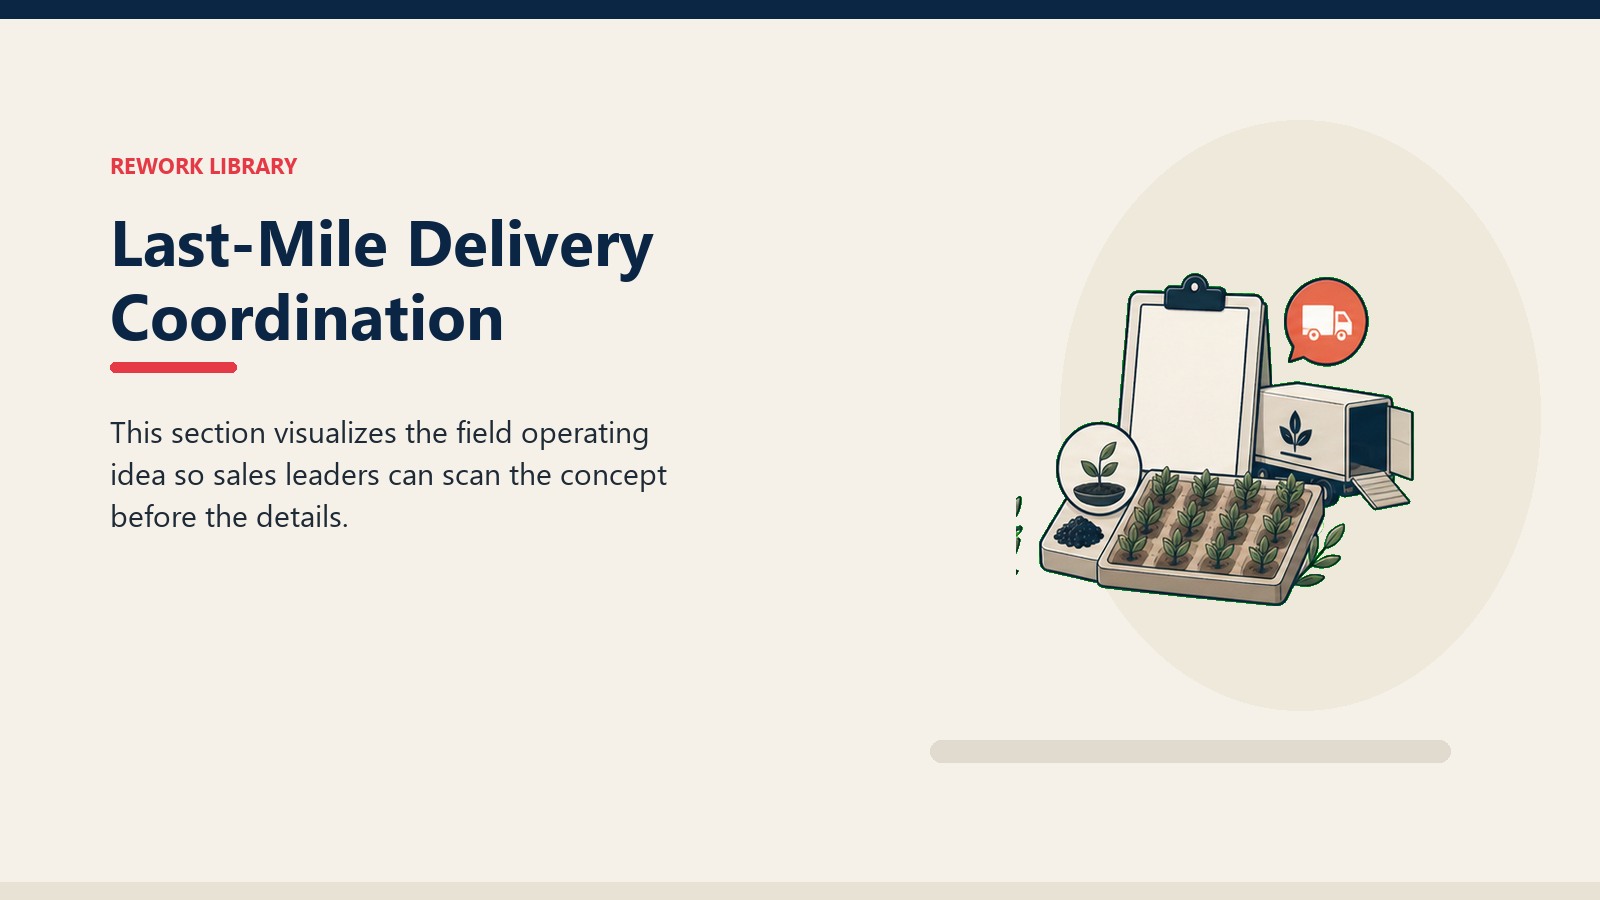
Last-mile coordination requires clear role ownership across three nodes: the primary distributor, the field rep, and the sales ops / supply interface.
Primary distributor owns the last-mile delivery from warehouse to dealer. Their responsibilities: maintain cover above the contractual minimum (typically 21 days for priority SKUs), process dealer orders within 24 hours in peak season, report stock levels weekly to the company's supply ops team, and flag stock-out risk before it materializes rather than after.
Field rep owns the retailer-level demand signal and the escalation trigger. When a rep visits a dealer and finds the distributor hasn't delivered against a pending order within 48 hours, that's an escalation. Reps track delivery status through the SFA (Sales Force Automation) app's distributor order module, or via a simple WhatsApp report to the RSM (Regional Sales Manager) if the SFA doesn't have that capability yet.
Sales ops / supply interface owns the response. When a field escalation comes in, the ops team has a defined playbook: check the primary distributor's current cover, identify whether the gap is a stock problem (shortage at distributor) or a logistics problem (stock exists but delivery hasn't been scheduled), and trigger the right response: emergency replenishment from regional warehouse, or a logistics push to the distributor's delivery team.
Escalation path for in-season delivery failures:
- Dealer complaint or rep observation: rep flags to RSM within 4 hours
- RSM confirms distributor stock status and logs escalation in ops tracker within same day
- Sales ops checks distributor cover and routes to supply team with urgency level (Level 1: cover below 7 days, resolve within 24 hours; Level 2: cover 7-14 days, resolve within 48 hours)
- Supply team dispatches regional warehouse stock or arranges inter-distributor transfer
- RSM confirms delivery to dealer within resolution window and closes the escalation
This escalation path has teeth only if both sales and supply teams have agreed to the SLAs in advance, which is why it belongs in the joint planning cadence rather than in each team's separate operating procedures.
See the Sales Ops and Field Force Alignment article for how the SFA and ops infrastructure supports this escalation workflow without creating a parallel reporting burden on reps.
Joint Planning Cadence
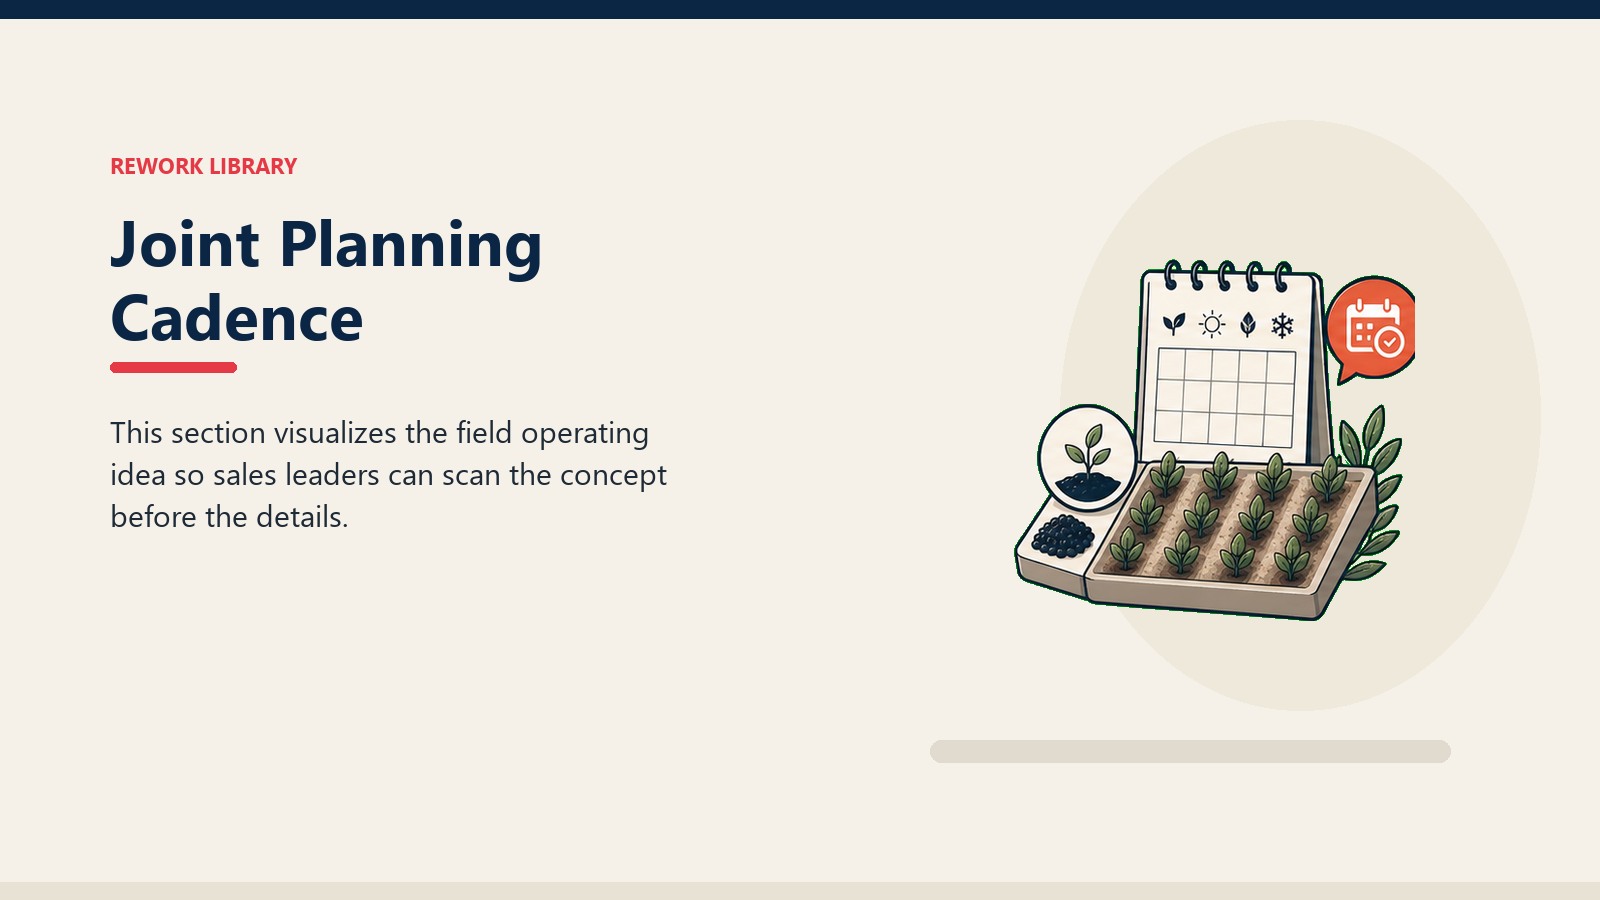
The operating model doesn't run itself. It needs a rhythm of structured conversations that keep field intelligence flowing to supply and supply constraints visible to sales before they become dealer-level surprises. This cadence maps directly to Sales and Operations Planning, a standard cross-functional process that "brings together sales operations, production capacity, inventory levels, and budgets so that different parts of the company work from the same assumptions."
| Cadence | Participants | Duration | What Gets Decided |
|---|---|---|---|
| Weekly ops sync (in-season) | Sales ops lead, supply ops lead, regional logistics | 30 minutes | Stock cover by region, delivery OTIF red flags, in-flight escalation status |
| Monthly joint planning session | Sales leadership, supply chain director, regional managers | 90 minutes | Season forecast revision, regional allocation adjustments, upcoming crop season pre-position triggers |
| Pre-season alignment workshop | Commercial director, supply chain director, RSMs, supply planners | Half day | Full-season indent review, distributor pre-load schedule, risk scenario planning |
| Post-season debrief | Sales ops, supply chain, field managers | 2 hours | Forecast accuracy review, stock-out root cause analysis, process improvements for next season |
The weekly in-season sync is where the real operational management happens. It should be short, focused on exceptions, and outcome-oriented: what's below threshold, who owns the fix, and when is the resolution committed.
The monthly joint planning session is where forecast revisions get made. Not informally, by email, but formally: the updated regional forecasts get reviewed against current supply positions, and allocation adjustments are made before cover falls below trigger levels.
The pre-season alignment workshop is the highest-leverage session of the year. Done well, it converts the rep-level indent submissions into a coherent supply plan before the procurement windows close. Done poorly (or skipped), it leaves supply planning teams to guess, and they'll guess conservatively, which means under-stocking at the worst possible time.
For cross-functional alignment principles that underpin this cadence, see the Learn More section for demand planning and field alignment, sales and distribution trade alignment, and forecast governance frameworks from adjacent industries.
Metrics That Keep Both Teams Honest
Shared accountability requires a shared scorecard. If field sales tracks revenue and supply tracks logistics costs in isolation, the two teams will optimize for different things and the alignment will collapse at the first commercial pressure point.
The shared scorecard covers three layers: demand signal quality (did the field provide accurate, timely input?), supply execution (did supply translate signals into stock before demand peaked?), and last-mile performance (did product reach dealers when they needed it?).
| Metric | Owner | Target | Review Frequency |
|---|---|---|---|
| Seasonal indent submission rate (% of reps submitting by deadline) | Sales ops | 90%+ | Pre-season |
| Forecast accuracy by rep (actual vs. submitted indent, % variance) | Sales ops | Within 20% variance for 80% of reps | Post-season |
| Pre-position completion rate (% of indent volume landed at distributors before sowing) | Supply chain | 95%+ | Weekly (in pre-season) |
| Distributor cover (days of stock on hand, priority SKUs) | Supply chain / Sales ops joint | Minimum 21 days during peak season | Weekly (in season) |
| Fill rate by territory (% of dealer orders fulfilled in full within SLA) | Supply chain | 95%+ | Weekly (in season) |
| Delivery OTIF by distributor (on-time, in-full %) | Logistics | 90%+ | Weekly (in season) |
| Stock-out incidents by territory (zero target for primary SKUs) | Joint | Zero | Flagged immediately, reviewed monthly |
Presenting this scorecard in the joint monthly session, rather than separately in sales leadership reviews and supply operations reviews, creates the shared visibility that drives joint accountability. When a territory's fill rate drops, both teams see it at the same time and own the fix together. Three specific changes get that model operational before the next season opens.
Three Operational Moves That Close the Alignment Gap
Getting this operating model in place before the next season opens requires three specific changes, not a systems overhaul.
Move 1: Make the indent a field visit output, not a planning department exercise. Pre-season indent submission should happen during dealer visits, using a structured form that reps complete while collecting stocking commitments. This means the data is grounded in actual dealer conversations, not backward-looking historical sales, and it positions the rep as the source of commercial intelligence rather than a reporting subject.
Move 2: Publish the shared scorecard to both teams simultaneously. When sales leadership sees fill rate data in their regional review and supply leadership sees the same data in their ops review, the shared scorecard is performing as designed. If each team sees a version filtered for their function, accountability stays siloed.
Move 3: Hold the pre-season alignment workshop before procurement windows close, not after. The temptation is to run alignment workshops after the supply plan is set, as a communication exercise. That's the wrong sequence. The workshop's purpose is to let field intelligence change the supply plan while there's still time to act. For most kharif planning cycles, this means the workshop needs to happen in March or early April, not May.
Getting these three moves right won't eliminate every in-season stock-out. Monsoon variation, logistics failures, and demand acceleration will always create pressure. But they'll ensure that the alignment gaps that are within your control don't become the ones that cost you the season.
The Crop-Calendar Signal Model: A two-cycle demand planning structure built around agronomic timing rather than financial quarters. Cycle 1 is the pre-season indent round: structured field visits to top dealers 10 to 12 weeks before sowing, generating written stocking commitments by SKU, documented in the SFA and submitted to supply planning before procurement windows close. Cycle 2 is the in-season rolling update: a five-minute structured update every three weeks during active sowing, covering actual dealer offtake against committed stocking levels and any demand acceleration signals. The two cycles together replace the informal WhatsApp forecast with a structured data feed that supply planning can act on at the right time.
Quotable Nuggets
"The revenue that took the entire pre-season to build can evaporate in three days of stock-outs at the height of demand. The only way to prevent it is to have the alignment conversation before the procurement window closes, not after the selling window opens." (Sales-supply alignment operating principle)
"A rep's knowledge of dealer stocking intent and competitive activity is worth more than six months of historical sales data to a supply planner, but only if it's structured well enough to act on. The indent form is the instrument that converts field intelligence into supply decisions." (Demand signal operating model principle)
"Sales departments push for higher inventory levels to avoid stock-outs. Operations prefers leaner holdings to cut costs. That structural conflict only resolves when both functions share the same demand signals and review the same performance data." (Supply chain management literature, per Wikipedia: Supply Chain Management)
Frequently Asked Questions about Sales and Distribution Supply Alignment
Why does sales-supply alignment matter more in agri-inputs than in other sectors?
Agri-inputs demand is highly compressed in time, tied to biological crop calendars that don't accommodate late deliveries. A fertilizer or pesticide needed during the two-week critical spray window either arrives or it doesn't. There's no "sell it next week" option the way there is in most FMCG categories. That time compression means misalignment between field demand signals and supply positioning has consequences that are both irreversible for the season and commercially damaging in terms of dealer and farmer trust.
How should companies handle reps who submit inaccurate seasonal forecasts?
Treat forecast accuracy as a trackable skill, not a judgment call. Track each rep's variance between submitted indent and actual offtake over multiple seasons. Share that accuracy history back to the rep and their RSM as part of the post-season debrief. Reps who systematically over-forecast need coaching on how to read dealer intent more accurately. Those who under-forecast often do so defensively because prior seasons saw their submissions ignored; making visible that field forecasts are actually used in supply planning changes that dynamic.
What's a realistic timeline to implement this operating model?
The indent form and submission process can be operational within a single planning cycle if field managers champion it. The joint cadence and scorecard take one season to embed, because both teams need to experience the rhythm before it feels natural rather than bureaucratic. Plan for a first season of learning (where the data will be imperfect and the cadence will skip beats) and a second season of execution (where the operating model delivers its value).
What is OTIF and why does it matter in agri-inputs specifically?
OTIF stands for on-time, in-full: the percentage of dealer orders fulfilled completely within the committed delivery window. In most distribution sectors, a 95% OTIF target is considered best-in-class. In agri-inputs, OTIF below 90% during the two to three week peak sowing window isn't a logistics metric. It's a direct commercial loss. A dealer who places an order on Monday and receives partial delivery on Friday, after farmers have already come to the counter and been turned away, does not simply reorder. He fills the gap with a competitor's product and begins evaluating his stocking strategy for next season.
How do you handle a distributor who under-delivers against committed stock levels mid-season?
The escalation path matters more than the complaint. When a rep identifies a delivery shortfall, the clock starts: the rep flags the RSM within four hours, the RSM confirms distributor stock status the same day, and the ops team checks whether the gap is a stock problem (shortage at the distributor level) or a logistics problem (stock exists but delivery hasn't been dispatched). Level 1 gaps (cover below seven days) require resolution within 24 hours, using regional warehouse stock if necessary. The distributor briefing on why the shortfall happened follows after the commercial situation is resolved, not before.
Should the pre-season indent be submitted before or after the rep's dealer visits?
After, not before. The indent form should be a field visit output, not a planning department exercise performed in advance of real conversations. A rep who fills out the indent from historical sales data and a spreadsheet is giving supply planning a guess. A rep who fills it out during and immediately after structured stocking conversations with her top dealers is giving supply planning a demand signal grounded in actual commercial intent. The quality difference determines whether the pre-position that results is built for real demand or a conservative hedge.
Learn More

Senior Implementation Consultant
On this page
- What Actually Breaks When Field Sales and Supply Chain Are Misaligned?
- Demand Signal Operating Model: What Reps Submit and When
- Pre-Positioning and Stock Allocation Logic
- Last-Mile Delivery Coordination
- Joint Planning Cadence
- Metrics That Keep Both Teams Honest
- Three Operational Moves That Close the Alignment Gap
- Quotable Nuggets
- Learn More