The Agri-Input Sales Growth Model: From Field Rep to Commercial Engine
Turn this article into takeaways for your work.


Each assistant summarizes the article only for you and suggests best practices for your work.
Here's a pattern that shows up in agri-input companies across South Asia and Southeast Asia: a sales force of two hundred reps covering every taluka (sub-district administrative block) in a state, a portfolio of fungicides, herbicides, and hybrid seeds that competes well on efficacy, and a distribution network that reaches six thousand dealers. And yet the company has been sitting at 22-24% market share for three consecutive seasons.
The commercial leadership's default response is predictable. Add more reps to thin beats. Push harder on pre-season stocking. Run one more demo plot campaign. And the share stays flat.
The problem isn't effort or headcount or product quality. It's the absence of a connected growth model. Field activity, dealer management, agronomist deployment, and seasonal campaigns run as independent programs with separate ownership and separate measurement. When they don't connect, you can't compound. And in agri-inputs, companies that don't compound across seasons don't grow market share. They just run faster to stay in place.
What Are the Four Growth Layers in an Agri-Input Commercial Engine?
Key Facts: Agri-Input Commercial Performance
- Global agricultural pesticide use reached 3.73 million tonnes of active ingredients in 2023, more than double the 1990 level, but most mid-size agri-input companies have not grown their market share proportionally. (FAO, 2024)
- Access to demonstration plots raised smallholder farmers' probability of purchasing improved inputs by 13 to 17 percentage points compared to farmers without plot access. (Sseguya et al., PLOS ONE, 2021)
- Agro-dealers in remote, low-competition locations stock fewer product varieties and charge higher prices, meaning farmer access to inputs worsens as coverage thins. (Mather et al., Food Security, 2021)
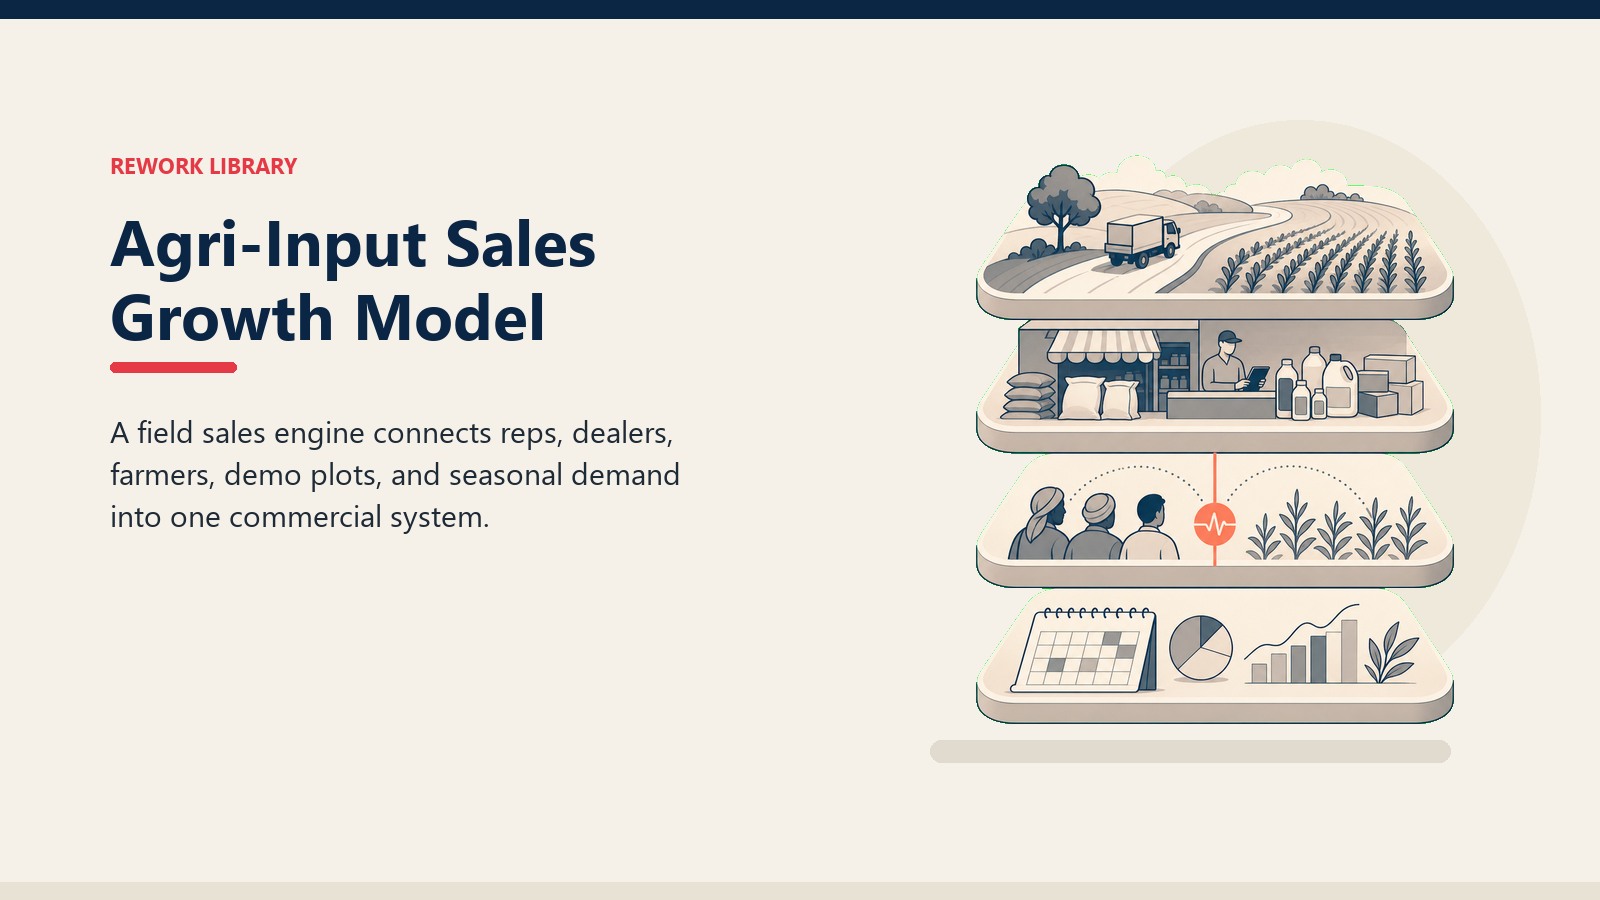
The agri-input commercial engine runs on four interconnected layers. Understanding where each layer is working and where it's leaking is the first diagnostic any sales head needs to do before changing structure, headcount, or campaign spend.
Layer 1: Reach Reach is the dealer universe the company has activated and the coverage those dealers provide over the farming geography. It's not just dealer count. An agri-input company can have six thousand empanelled dealers and still have coverage gaps in irrigated cotton belts or tribal rain-fed maize zones where the active dealers don't actually carry the right portfolio for the local crop system.
Reach metrics track how many dealers in the target universe stock the company's product, how frequently reps visit them, and whether the dealers in high-potential micro-markets are getting proportional attention. See Dealer Universe Mapping for how to size and segment that universe before the season.
Layer 2: Demand Demand is farmer awareness, preference, and pull-through. The mistake most companies make is assuming that dealer stocking equals farmer demand. It doesn't. Dealers stock what company reps push them to take on credit. Farmers ask for what they've heard about, seen work on a neighbor's plot, or had recommended by an agronomist.
Without active demand creation, dealers hold primary stock that doesn't move into secondary offtake. That creates channel stuffing and eventual credit pressure at the distributor level.
Layer 3: Conversion Conversion is the rate at which dealer stocking becomes farmer adoption. It's tracked as dealer offtake velocity (how fast product moves off dealer shelves into farmer hands) and farmer trial rate (what percentage of farmers in a beat who heard about the product actually used it in a season).
Conversion is where demo plots live. A well-run demo plot in a mustard-growing village creates visible proof for thirty to forty farmers in the surrounding area. That proof converts far faster than price promotions or marketing collateral. Sseguya et al. in PLOS ONE (2021) confirmed the effect is strongest when product is available within 5 km of the plot location.
Layer 4: Retention Retention is repeat purchase across seasons and across crop stages. A farmer who adopts a fungicide for kharif paddy disease management and sees a yield response is a high-probability buyer for the same product the following kharif. And he's a credible word-of-mouth source for his neighbors.
Without tracking farmer-level repeat, companies can't distinguish between real adoption growth and the seasonal noise of first-time trials that don't stick. The What Is Lead Management principles of capture, qualify, nurture, and retain apply directly to the farmer relationship lifecycle.
The Seasonal Revenue Cycle
Agri-inputs don't have a smooth revenue curve. They have two revenue windows in most Indian geographies, the kharif season from June to October centered on rice, cotton, maize, soybean, and groundnut, and the rabi season from October to March centered on wheat, mustard, chickpea, and vegetables. Each window has three sub-phases that require different commercial actions.
Pre-season: stocking push (8-10 weeks before sow) This is when reps and distributors run the primary sales campaign. Credit terms are extended, stocking targets are negotiated, and dealer shelves get loaded. But here's the problem that most companies treat as normal: pre-season stocking is driven by company targets and distributor credit appetite, not by farmer demand signals. The result is channel loading that may or may not reflect what farmers will actually buy.
Companies with a connected growth model use the previous season's secondary sales data, demo plot results, and farmer advisory feedback to build stocking targets that reflect real demand geography. Companies without that data reload channels the way they did last season and hope the product moves.
In-season: demand activation (sow to crop stage) This is the highest-leverage window. Farmers are in the field. Crop problems appear. Agronomists are doing crop health checks. Demo plots are showing results. Reps are visiting dealers to drive offtake.
In-season metrics tell you whether the pre-season loading was right sized. If offtake velocity is slow at mid-season, you have channel stuffing forming and a credit problem six weeks away. If offtake is faster than expected, you have stock-out risk and a competitor opportunity.
Post-season: liquidation and learning (post-harvest) Products that didn't move need to be liquidated before expiry or before the quality degrades. Channel credit needs to be cleared before the next pre-season push. And the sales head needs a clear read on which zones converted and which didn't, so the next season's coverage and demand model is calibrated, not copied.
Treating each season as an isolated event breaks the compounding logic. The rabi stocking model should be shaped by what kharif taught you. The next kharif campaign should reflect what rabi agronomist visits learned about farmer adoption barriers in each geography. Which brings up the asset most companies are wasting entirely.
Agronomist as the Demand Bridge
The agronomist, or in some markets the technical service representative or crop advisor, is the most overlooked asset in agri-input commercial models. In companies that use them only for product demonstrations and farmer meetings, they generate activity metrics. In companies that integrate them into the commercial engine, they generate demand signals that guide rep deployment, dealer stocking, and seasonal campaign prioritization. Agricultural extension research consistently shows that two-way advisory relationships, where the advisor collects as much information as they deliver, outperform broadcast-style technical recommendations for driving actual adoption.
The demand bridge works like this. An agronomist conducts a crop health check in a cotton-growing village in the Vidharbha belt, and identifies early-stage aphid infestation that matches a profile where a particular imidacloprid product performs well. That's not just a product recommendation opportunity. It's a demand signal for the dealers in that beat and a conversion opportunity for the reps visiting those dealers that week.
When the agronomist's field intelligence doesn't reach the sales rep before the next dealer visit, the opportunity is missed. The dealer may have stock, but the rep doesn't know which SKU to push or why. The farmer gets a generic recommendation from the dealer counter instead of a technically grounded one from someone who saw the crop.
Sales-agronomy misalignment is the most common growth blocker in mid-size agri-input companies. And it's structural. Agronomists report to a technical or marketing function. Reps report to the sales function. Neither is accountable for connecting demand signals to commercial action at the dealer and farmer level.
The fix is operational, not organizational. Weekly sync between area agronomists and area sales managers. Shared beat maps that overlay demo plot locations with dealer coverage zones. Shared KPIs that reward both functions for the same outcome: dealer offtake and farmer trial in the same geography. The next question is where your company actually sits in the maturity progression that determines whether any of this is possible yet.
Which Maturity Stage Is Your Company Actually In?
Agri-input commercial models mature in three recognizable stages. Most mid-size companies are stuck in Stage 2.
The Agri-Input Commercial Maturity Model defines three sequential stages: Stage 1 is Reactive Push (primary dispatch-led, no secondary visibility), Stage 2 is Channel Activation (dealer stocking tracked, but farmer demand disconnected from channel loading), and Stage 3 is Demand-Led Pull (farmer advisory intelligence actively drives dealer stocking and rep deployment, producing compounding share gains).
| Stage | Label | Primary Focus | What's Measured | Growth Profile |
|---|---|---|---|---|
| Stage 1 | Reactive Push | Primary sales volume | Dispatches from warehouse | Grows with market but doesn't compound |
| Stage 2 | Channel Activation | Dealer stocking + secondary sales | Offtake at dealer level | Share gains plateau at 20-30% in core geographies |
| Stage 3 | Demand-Led Pull | Farmer advisory + dealer pull-through | Farmer trial + repeat rate | Compounds across seasons, builds durable share |
Stage 1: Reactive Push The company measures what it controls: product dispatched from its own warehouse. Revenue is recognized when it leaves company custody and enters the distributor's. What happens after that is essentially invisible. Demo plots exist but are run as check-the-box activities. Agronomists produce visit reports that nobody in sales reads. Dealer relationships are transactional and credit-dependent.
Diagnosis: If your sales team can tell you primary sales volume but can't tell you dealer offtake velocity or farmer trial rate by zone, you're in Stage 1.
Stage 2: Channel Activation The company has secondary sales visibility at the dealer level, at least in priority geographies. Reps are measured on dealer visits and stocking targets. Some demo plots produce documented results that inform the next season's campaign. But the connection between farmer demand and dealer stocking is still weak. Agronomists are adjacent to the commercial cycle, not embedded in it.
Diagnosis: If your sales team tracks offtake by dealer but can't tell you farmer adoption rate by crop-geography segment, you're in Stage 2.
Stage 3: Demand-Led Pull Farmer advisory and agronomist intelligence are formally connected to area-level stocking and deployment decisions. Demo plots are planned based on the previous season's conversion data, not historical habit. Reps carry demand signals into dealer visits, not just stocking targets. Seasonal campaigns are calibrated by micro-geography using offtake, trial, and repeat data from the last two seasons.
This is the model that builds durable market share. But it requires both operational discipline and measurement infrastructure. The RevOps Metrics framework provides a useful parallel: just as B2B revenue operations tracks funnel conversion at each stage, the agri commercial engine needs to track demand conversion from farmer awareness to trial to repeat purchase, with measurement at each transition.
Growth Model Diagnostics
Use this checklist to locate where your commercial engine is leaking. Each gap maps to a specific growth layer.
Reach gaps:
- Can you name the top 200 dealers in your highest-potential geography by crop and by revenue potential? If not, your reach is defined by rep coverage patterns, not market opportunity.
- What percentage of your dealer universe has received a rep visit in the last 30 days? If it's below 70% of active dealers, your beat routes need rebalancing.
- Do you have dealers in high-potential command area zones who are not actively stocking your portfolio? That's a coverage gap, not a demand gap.
Demand gaps:
- What is your farmer awareness rate for your top three products in each crop segment? If you don't know, you're assuming reach creates demand, which it doesn't.
- How many demo plots did you run last kharif, and what percentage resulted in a documented farmer purchase in that same season? If less than 50%, your demo plot model is broken.
- Are agronomist field intelligence reports shared with area sales managers before the next beat visit cycle? If not, you're losing the demand signal at the most valuable point.
Conversion gaps:
- What is your average dealer offtake velocity at mid-season versus your stocking target from pre-season? If offtake is below 60% of stocking at mid-season, you have stuffing risk.
- What percentage of farmers who received an agronomist advisory recommendation purchased the recommended product from the local dealer in the same season? That number should be above 40% in a working demand-led model.
Retention gaps:
- How many farmers who trialed your product in kharif 2024 repurchased in kharif 2025? If you can't answer this, you're treating adoption as a one-time event rather than a compounding relationship.
- What is your net promoter equivalent among farmers in your top dealer zones? Word of mouth is the most cost-efficient demand creation tool in agri-input markets, and you can only invest in it if you're measuring it.
Linking Growth Model to Operational Systems
The growth model doesn't run on spreadsheets and end-of-season reviews. It runs on connected operational systems that give field managers decision-quality information during the season, not after it. The Agri Sales KPIs and Metrics framework documents the specific indicators that drive each layer. The Agri Field Sales Economics article shows how to evaluate whether the cost of running each beat is generating proportional revenue return.
And both of those depend on the channel design being fit for purpose. The Route-to-Market for Agri-Inputs article covers how to audit whether your current channel structure still matches your crop geography and competitive dynamics, because a growth model running on the wrong channel structure leaks value at every layer.
The sales pipeline framework translates well to agri-input commercial thinking: every stage from farmer awareness to repeat purchase needs to be defined, measured, and managed, not just the primary dispatch from the warehouse.
Conclusion
The agri-input sales growth model isn't a new concept. Most commercial leaders already understand the pieces: reach, demand, conversion, retention. The gap is in connecting them into a system that runs across seasons, shares data between functions, and adjusts based on what each season teaches.
Companies stuck at 20-30% share usually have three of the four layers working in isolation. Reach is reasonably good. Conversion through demo plots is decent in priority zones. But demand creation and farmer retention are not measured and not managed, so every season starts from roughly the same base.
The companies that compound share over three to five seasons are the ones that treat farmer demand data as the input to dealer stocking, not the output. That shift requires operational discipline, cross-functional alignment between sales and agronomy, and a measurement system that tracks all four layers. Not just the one the warehouse can see.
Quotable Nuggets
"Global pesticide use has more than doubled since 1990, yet most mid-size agri-input companies have been unable to grow their market share proportionally because commercial activity, dealer management, and farmer demand are run as separate programs rather than a connected system." (Framing based on FAO FAOSTAT Pesticides Use data, 2024)
"Demo plots that convert farmers to product adoption deliver multiples of their cost in first-season revenue from those farmers alone. Research in Tanzania found access to demonstration plots increased input purchase probability by 13 to 17 percentage points." (Sseguya et al., PLOS ONE, 2021)
"In markets where agro-dealers cluster and competition is thin, remote farmers face fewer product choices and pay higher prices. Distributor and dealer coverage is not just a commercial efficiency question; it is the primary determinant of whether farmers can access inputs at all." (Mather et al., Food Security, 2021)
Frequently Asked Questions about The Agri-Input Sales Growth Model
What is the agri-input sales growth model?
The agri-input sales growth model is a four-layer commercial framework that connects reach (dealer coverage), demand (farmer awareness and pull-through), conversion (dealer offtake and farmer trial), and retention (repeat purchase across seasons). Companies that manage all four layers as an integrated system consistently outperform those that treat each layer as a separate program.
Why do agri-input companies plateau at 20-30% market share?
Most companies in the 20-30% range have reasonably good dealer coverage and some demo plot activity but lack a formal connection between farmer demand signals and dealer stocking decisions. Agronomist intelligence doesn't reach sales reps in time to influence dealer visits. Post-season learning doesn't feed into next-season stocking models. The result is that each season restarts from roughly the same base rather than compounding on the previous one.
How does the agronomist function drive commercial growth?
The agronomist becomes commercially valuable when crop health intelligence gathered during field visits reaches the area sales manager before the next dealer beat cycle. An agronomist who identifies early-stage pest infestation in a cotton belt creates a demand signal for specific SKUs at specific dealers that week. Without that information flow, the demand signal is lost and the dealer gets a generic visit instead of a targeted one.
What is secondary sales data and why does it matter?
Secondary sales refers to product sold from the dealer's counter to farmers, as opposed to primary sales (product dispatched from the company's warehouse to distributors). Primary sales looks fine right until the moment it collapses, because channel stuffing and credit problems at the distributor level don't appear in warehouse dispatch data. Secondary sales data at the dealer level gives the sales head a real-time read on whether product is actually moving into farmer hands.
How long does it take to move from Stage 2 to Stage 3 of the maturity model?
Moving from Channel Activation to Demand-Led Pull typically takes two to three seasons to produce measurable share gains. The operational changes required (weekly sales-agronomy syncs, shared beat maps, farmer trial tracking) are not technically complex but require sustained management attention to embed as habit. Companies that try to jump stages by deploying CRM or SFA tools without first fixing the information flow between agronomy and sales find that the technology doesn't solve the underlying coordination problem.
What is the first diagnostic step if the commercial model isn't working?
Identify whether the problem is in reach, demand, conversion, or retention using the diagnostic checklist in this article. The symptoms look similar (flat share, slow offtake) but the interventions are completely different. Adding reps fixes a reach gap. Demo plots fix a demand gap. Agronomist-sales alignment fixes a conversion gap. Farmer relationship tracking fixes a retention gap. Deploying the wrong fix to the wrong layer costs a full season.
Learn More

Senior Implementation Consultant