Dealer Universe Mapping: How to Identify and Prioritize Every Agri-Dealer in Your Territory
Turn this article into takeaways for your work.


Each assistant summarizes the article only for you and suggests best practices for your work.
Ask a territory manager how many dealers are in their geography and most will give you a number between 25 and 40. Ask how many agri-input outlets actually operate in that territory and the real answer is often two to three times that. The gap between "dealers we visit" and "dealers that exist" is where competitors quietly build market share while your reps follow the same route they've driven for three seasons.
Dealer universe mapping is the practice of identifying every outlet in a territory that sells or could sell agri-inputs, before the season starts, and assigning each one a coverage priority. It turns territory coverage from a habit into a deliberate strategy. And it's the foundation for everything that follows in dealer network work: dealer segmentation and classification, new dealer acquisition, and the beat routes your field force runs every week.
What Dealer Universe Mapping Actually Means
Key Facts: Dealer Coverage and Territory Gaps
- In a census of 299 agro-dealers across eight districts of rural Tanzania, nearly 30% of farmers lived more than an hour's travel time from the nearest agro-dealer, despite a high total number of outlets, because dealers clustered in towns rather than dispersing across farming geography. (Mather et al., Food Security, 2021)
- Agro-dealers placed within farming communities through FAO's hub agro-dealer model reduced farmer travel costs and raised input adoption rates, confirming that the geography of dealer placement is as important as the total dealer count. (FAO and AFAP)
- The IFC's Last Mile Retailer program documents that unvisited agro-dealers default to recommending whoever shows up most recently, making rep visit frequency as decisive as product quality for brand presence at the counter. (IFC Last Mile Retailer Program)
The dealer universe is not your current active dealer list. It's every outlet in the territory that sells agri-inputs or is positioned to do so. In distribution channel terms, these dealers function as the last-tier intermediary between the manufacturer and the end consumer. That includes:
- Active stocking dealers: outlets currently carrying your product on a regular basis
- Competitor-primary dealers: outlets that carry agri-inputs but primarily stock a competing brand
- Multi-brand generalist dealers: outlets selling inputs alongside seeds, hardware, or general merchandise, without strong loyalty to any single brand
- Dormant potential outlets: village traders, fertilizer cooperatives, or general stores that have the farmer footfall and storage space to carry your product but haven't been approached
Most rep coverage plans are built on the first category only. But the commercial opportunity sits across all four.
Mapping the full universe gives territory managers visibility into two things that drive seasonal planning: where your coverage is genuinely strong, and where competitors are winning by default because no one's showing up. That visibility is what makes the difference between a territory plan built on evidence and one built on the routes your predecessor drew.
Where Do You Find the Data to Map Your Dealer Universe?
Building an accurate universe requires pulling from multiple sources. No single list is complete.
Distributor outlet lists. Your primary distributor holds billing records for every outlet they've invoiced in the last 12 to 24 months. This is your starting point. It captures active stocking dealers but misses outlets that buy from competing distributors or haven't yet entered the distribution network. Request the outlet list with village names, purchase frequency, and average ticket size so you can weight it in your mapping.
Government licensing registries. In most agri-input markets, pesticide and fertilizer dealers are required to hold a dealer license from the state or district agriculture department. These registries are publicly available and are consistently more complete than any distributor's billing list, because they include outlets that buy from multiple distributors or from competitor channels. A one-time request to the district agriculture office often produces a full list of licensed outlets by village. FAO's hub agro-dealer work in Sub-Saharan Africa shows agro-dealers placed within farming communities cut travel costs and raise input adoption rates, validating that geography of dealer placement is as important as the dealer list itself.
Crop-block and land-use maps. State agriculture departments and crop-insurance surveys publish village-level crop area data. Cross-referencing this with your dealer location map shows you which villages have significant crop area but no active dealer coverage. Those are your highest-priority white spaces.
Dealer and farmer referrals during field visits. When a rep visits an active dealer, the question "who else in this area sells inputs to farmers?" consistently surfaces two to four outlets per visit that don't appear on any formal list. Village traders, seed suppliers, cooperative society counters, and small-town agri-stores all get named in these conversations. This rep-observed intelligence, logged systematically in the CRM, is the only way to capture the informal channel.
On-route observation. Train your reps to log every storefront that sells agri-inputs they pass during farm visits and route journeys. A fertilizer store on the highway between two villages, a cooperative counter at the edge of a small town, a seed shop inside a market yard. These don't appear on licensing lists but they serve farmers every day. One structured observation cycle per beat route, done once per season, adds materially to the universe.
Dealer Universe Template: What to Capture for Each Outlet
| Field | What to Record |
|---|---|
| Outlet name | Trading name as known locally |
| Village / block | Administrative location, not just GPS |
| GPS coordinates | For map plotting and beat integration |
| Outlet type | Active/Competitor-primary/Multi-brand/Potential |
| Estimated seasonal volume | In kg or units for top category (fertilizer, pesticide, seed) |
| Current brand(s) stocked | Primary and secondary brands visible at counter |
| Farmer footfall (approximate) | Low / Medium / High, assessed by dealer size and village crop area |
| Proximity to crop area | Km from nearest irrigated or large-acreage block |
| Visit status | Active / Never visited / Lapsed |
| Coverage priority | A / B / C, assigned after gap analysis |
This table lives in your territory CRM or a shared spreadsheet until full CRM integration is available. What matters is that it's consistent across reps in the same territory and updated at the start of each season.
Classification by Tier and Coverage Potential
Once you've identified the full universe, you need a preliminary classification for each outlet to determine which deserve immediate coverage investment and which go on a secondary list.
This isn't the same as the formal dealer segmentation and classification exercise, which uses historical sales data and loyalty scoring. The universe-mapping classification is a first-pass filter based on four factors you can assess without a purchase history:
Village crop area. An outlet in a village with 500 irrigated acres of cotton or paddy has structurally higher volume potential than one in a village with 80 dry-crop acres. District crop surveys give you this data at the village level.
Estimated farmer footfall. A dealer who describes serving 200 farmers per season is a different opportunity from one who sees 30 walk-in customers. You can triangulate footfall from village population data, the dealer's physical store size, and their stated purchase volume from any single distributor.
Competitor hold. An outlet that's been the sole stockist for a major competitor for four seasons is not the same short-term priority as a multi-brand outlet that's never had a consistent brand partner. Weight competitor-hold outlets lower for immediate acquisition, higher for monitoring and eventual conversion.
Proximity to existing active dealers. An unvisited outlet in a village you already cover from another dealer is a different decision from one in a village with no coverage at all. Village uniqueness matters more than raw distance.
A preliminary A/B/C rating on these four factors, done before the season starts, gives the field force an immediate answer to "which new outlets should I be building relationships with this cycle?" without waiting for a full segmentation exercise.
Gap Analysis and White Spaces
The Three-Dimension Coverage Gap Analysis: compares active dealer coverage against the full universe on (1) village coverage gaps (villages above the crop acreage threshold with no active dealer), (2) competitor-hold analysis (villages where the company's product is not the primary recommendation), and (3) lapsed outlet review (outlets that ordered in the past 18-36 months but have gone quiet). Running all three dimensions before the season produces a prioritized white-space list for new dealer recruitment.
The gap analysis compares your active coverage against the full universe. Running all three dimensions before the season produces a prioritized white-space list for new dealer recruitment. Here's what to look at.
Village coverage gaps. List every village in the territory with a crop area above your minimum viable threshold (e.g., 300 acres of primary crop). Mark each one as: covered by active dealer, covered by competitor-primary dealer only, or not covered. Every uncovered village above threshold is a white space.
Competitor-hold analysis. In villages where your product isn't the primary recommendation, identify the competing brand and the outlet carrying it. Understand whether the dealer relationship is exclusive by practice or by formal agreement. Exclusive agreements in agri-input channels are rare at the dealer level; most competitor-primary dealers can be converted with the right commercial offer and agronomic support.
Lapsed outlet review. Check your distributor's billing history for outlets that placed orders 18 to 36 months ago but have gone quiet. Lapsed outlets have already been qualified, they know the product, and they've had a reason to stop. That reason might be a competitor offer, a rep change, or a credit dispute. Identifying it is faster than building a new relationship from scratch.
Gap Analysis Checklist
Use this before each season planning cycle:
- Total villages in territory with primary crop area above threshold identified
- Active dealer coverage mapped against village list
- Uncovered villages sorted by crop area (highest to lowest)
- Competitor-primary outlets in covered villages identified
- Lapsed outlets from prior two seasons listed
- White-space villages prioritized for new dealer recruitment (see new dealer acquisition)
- Preliminary A/B/C tier assigned to all universe outlets
- Coverage gaps shared with area manager and incorporated into beat-route design
Mapping to Beat Routes
A dealer universe map that never connects to the rep's weekly schedule is a planning document, not an operational tool. The integration step is where the work actually pays off.
Take every A-tier outlet and every unvisited B-tier outlet in your universe and check whether they fall within an existing beat route cycle. If an A-tier outlet is in a village the rep passes twice a month but never stops at, that's a route-design failure. Add it to the schedule.
For outlets in villages entirely outside the current beat structure, the question becomes one of field force sizing and deployment: does the white space justify a route extension or additional headcount, or does it get covered through distributor-managed sub-stockist development?
In practice, most territory managers find that 60% to 70% of white-space outlets can be folded into existing beat routes with a modest schedule adjustment. The remaining 30% typically cluster in remote sub-geographies that need a dedicated coverage decision.
The dealer visit playbook applies to every outlet on the route regardless of tier. What changes by tier is frequency and depth, not structure.
For the territory routing model specifically, the principles that apply to B2B lead routing translate directly to field-force territory design. The territory-based routing framework covers how to partition geography so coverage load is balanced and no pocket is chronically underserved.
Seasonal Refresh
A dealer universe map has a shelf life of roughly one crop season. Markets change:
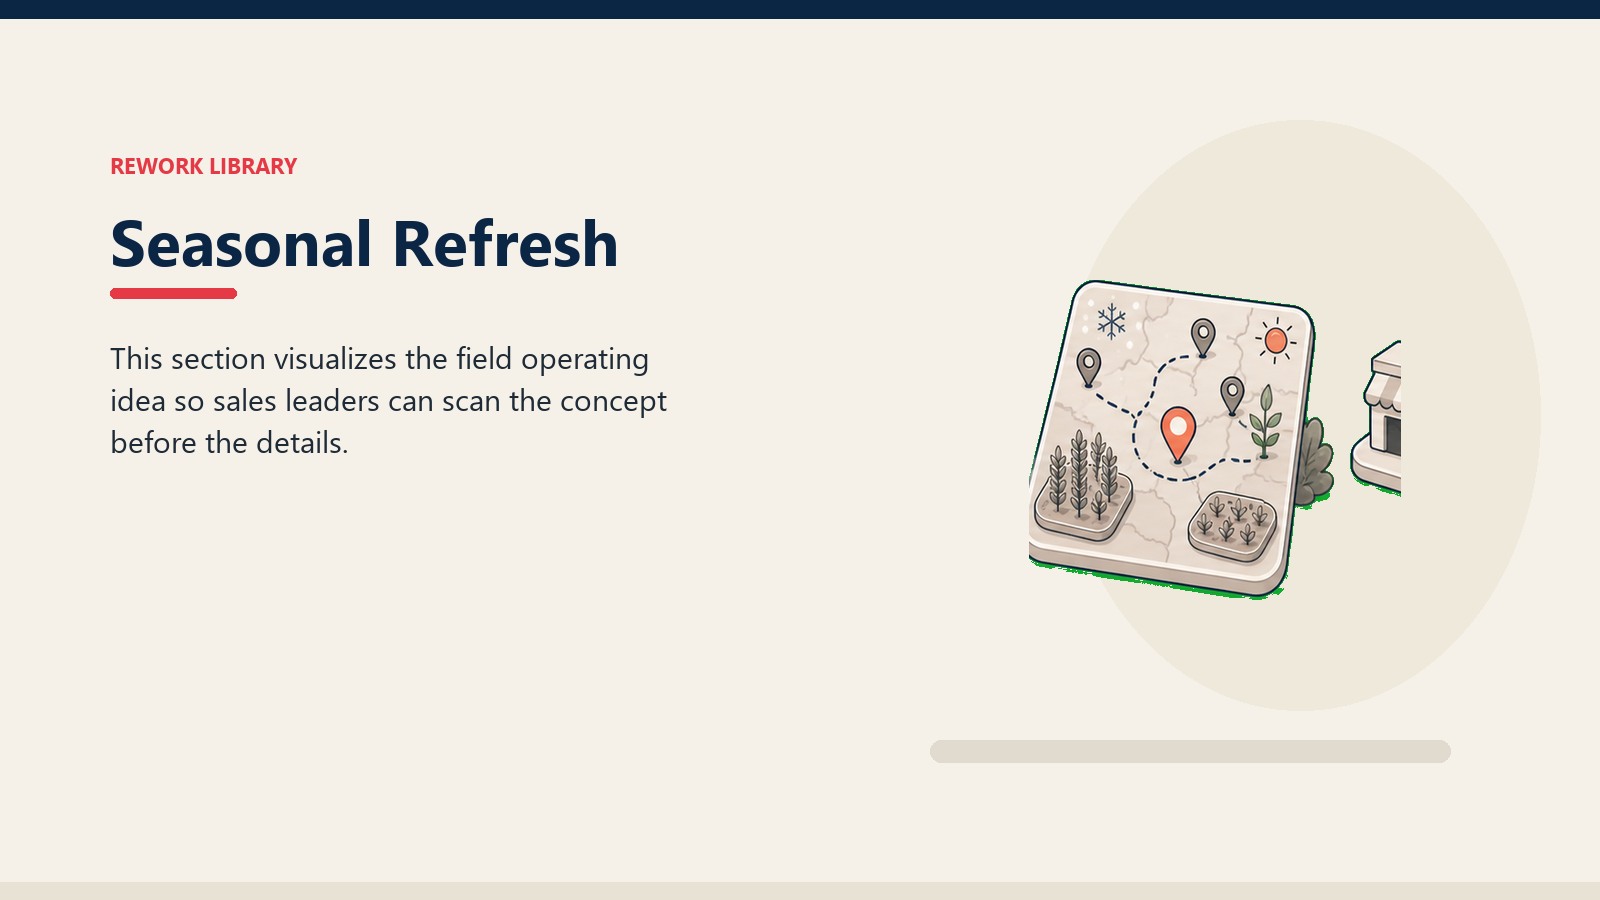
- New outlets open (especially after a good crop year, when traders convert to full agri-input dealers)
- Dealers exit (retirement, financial failure, regulatory non-compliance)
- Crop patterns shift (a shift from dryland groundnut to irrigated paddy changes the relevant outlets in a village)
- Competitor presence intensifies (a new brand launch typically adds two to four dealer relationships in your territory within a season)
Build the refresh into your pre-season planning calendar. Kharif planning starts in March and April in most of India; the universe review should complete by late February so the updated beat routes are ready before the soil-preparation and seed-purchase window opens. Rabi planning starts in August; the review should complete in July.
The refresh doesn't require repeating the full identification exercise every season. It's a delta update: confirm existing outlets are still active, log any new outlets observed during the prior season's field visits, and re-run the gap analysis against the updated map. The coverage and frequency optimization principles from FMCG distribution apply here: the goal isn't to visit every outlet, it's to visit the right outlets at the right frequency.
A seasonal refresh also catches dealer-tier migrations. An outlet that was a C-tier potential at the start of kharif may have placed three substantial orders by harvest and belongs on the B-tier list for rabi. That movement should happen in the system, not just in the rep's memory. How you assign those tiers in the first place is a separate methodology worth getting right before the next season starts.
Dealer Universe Mapping and Prospecting
Dealer universe mapping is, in commercial terms, a structured prospecting strategy applied to the channel layer. The same logic that governs B2B prospect identification applies to outlet identification: define the total addressable pool, qualify by fit criteria, prioritize by conversion potential, and assign to a coverage owner.
The difference in agri-inputs is that the stakes are seasonal and compressed. A B2B sales team has 12 months to convert a prospect. An agri-input rep has one crop cycle. Every unvisited outlet in the universe is a missed season, not just a missed meeting.
Conclusion: Coverage as Competitive Advantage
A mapped dealer universe turns territory coverage from a habit into a strategy. Reps who visit the same 20 dealers out of familiarity aren't building a territory; they're defending a legacy while competitors quietly build the rest of it around them. The IFC's Last Mile Retailer program documents the same pattern globally: unvisited agri-dealers default to whoever shows up, making coverage frequency as decisive as product quality for brand presence at the counter.
The return on one structured universe-mapping exercise before the season is measurable within two crop cycles: new outlets identified and converted, white-space villages covered, competitor-primary outlets brought under active relationship management. The work isn't glamorous. But it's the difference between a territory where your brand has the counter position it deserves and one where it defaults to whoever showed up last.
Map the universe first. Everything else in dealer network development follows from knowing who's there.
Quotable Nuggets
"Despite high total agro-dealer counts, nearly 30% of farmers in rural Tanzania lived more than an hour's travel time from the nearest agro-dealer. Dealers clustered in towns. The total number of dealers in a territory tells you almost nothing about whether farmers can actually reach them." (Mather et al., Food Security, 2021)
"Reps who visit the same 20 dealers out of familiarity aren't building a territory. They're defending a legacy while competitors quietly build the rest of it around them. The IFC's Last Mile Retailer program documents the pattern globally: unvisited dealers default to whoever shows up, making coverage frequency as decisive as product quality for brand presence at the counter." (Based on IFC Last Mile Retailer Program)
"A distributor outlet list captures outlets that buy from that specific distributor. It misses competitor-channel outlets, informal traders, cooperative counters, and new entrants. In most territories, the distributor list covers 50% to 70% of the real outlet universe. Government licensing registries and rep-observed outlets close the gap."
Frequently Asked Questions about Dealer Universe Mapping
How long does a territory dealer universe mapping exercise take?
For a territory with 100 to 200 potential outlets, expect two to three weeks of data collection and two days of analysis and route integration. The bulk of the time is field-based: confirming outlet locations, capturing missing outlets from rep observation, and verifying lapsed outlet status. The analysis itself, once data is consolidated, is a half-day exercise for an experienced area manager.
What if the distributor's outlet list already covers most of the territory?
Distributor lists capture outlets that buy from that specific distributor. They miss competitor-channel outlets, informal traders, cooperative counters, and new entrants who haven't yet connected to the formal distribution network. In most territories, the distributor list covers 50% to 70% of the real outlet universe. Government licensing registries and rep-observed outlets close the gap.
Should C-tier outlets be included in the beat route?
Not in the primary weekly cycle. C-tier outlets should be reviewed quarterly, either through a targeted field visit or through a telecalling check managed by the area office. Including them in the weekly beat dilutes coverage time on A and B-tier dealers without commensurate return. The exception is a C-tier outlet in a white-space village with no other coverage option, where any presence is better than none.
How do I handle outlets that carry both my brand and a competitor's?
Multi-brand outlets are a coverage priority, not a disqualification. They have the farmer relationship and the stocking habits to carry your product. The sales task is to grow your share of the dealer's wallet over successive seasons through better agronomic support, more consistent rep presence, and differentiated farmer-pull programs. Track share of wallet as a metric for these outlets specifically.
How does dealer clustering affect farmer access to inputs?
Dealer clustering, where most outlets concentrate in towns or market hubs rather than dispersing across the farming geography, is a structural coverage problem. Research from rural Tanzania found that despite a high total number of agro-dealers in a study region, nearly 30% of farmers lived more than an hour's travel time from the nearest outlet. Dealers in remote locations, facing less competition, stocked fewer product varieties and charged higher prices. A universe mapping exercise that captures geographic clustering as a variable identifies whether your active dealer network is truly serving the farming geography or just the accessible nodes within it.
Learn More

Senior Implementation Consultant
On this page
- What Dealer Universe Mapping Actually Means
- Where Do You Find the Data to Map Your Dealer Universe?
- Dealer Universe Template: What to Capture for Each Outlet
- Classification by Tier and Coverage Potential
- Gap Analysis and White Spaces
- Gap Analysis Checklist
- Mapping to Beat Routes
- Seasonal Refresh
- Dealer Universe Mapping and Prospecting
- Conclusion: Coverage as Competitive Advantage
- Learn More