Demand Generation via Demo Plots: How Agrochemical Field Teams Turn Trial Acres into Purchase Orders
Turn this article into takeaways for your work.


Each assistant summarizes the article only for you and suggests best practices for your work.
The rep had planted twenty demo plots across his territory. Hybrid seed trials, four varieties laid out in neat strips, with a control row of the farmer's current practice at the edge. He'd done the agronomic work properly. But when harvest came, he wasn't there. He was busy covering another part of the territory.
His competitor's rep was there. She'd planned her harvest visits eight weeks earlier, invited twelve neighboring farmers to watch the yield comparison, and brought the dealer along. She didn't have better product. She had a better system. Three of the watching farmers placed orders with the dealer before they drove home.
The first rep complained that his plots "didn't convert." But conversion doesn't happen at planting. It happens at harvest, if someone's designed for it.
Why Demo Plots Generate Demand
Farmers are evidence-based decision-makers. That's not a soft observation. It's the fundamental reason demo plots outperform brochures, price promotions, and even agronomist recommendations when those recommendations aren't backed by visible local proof.
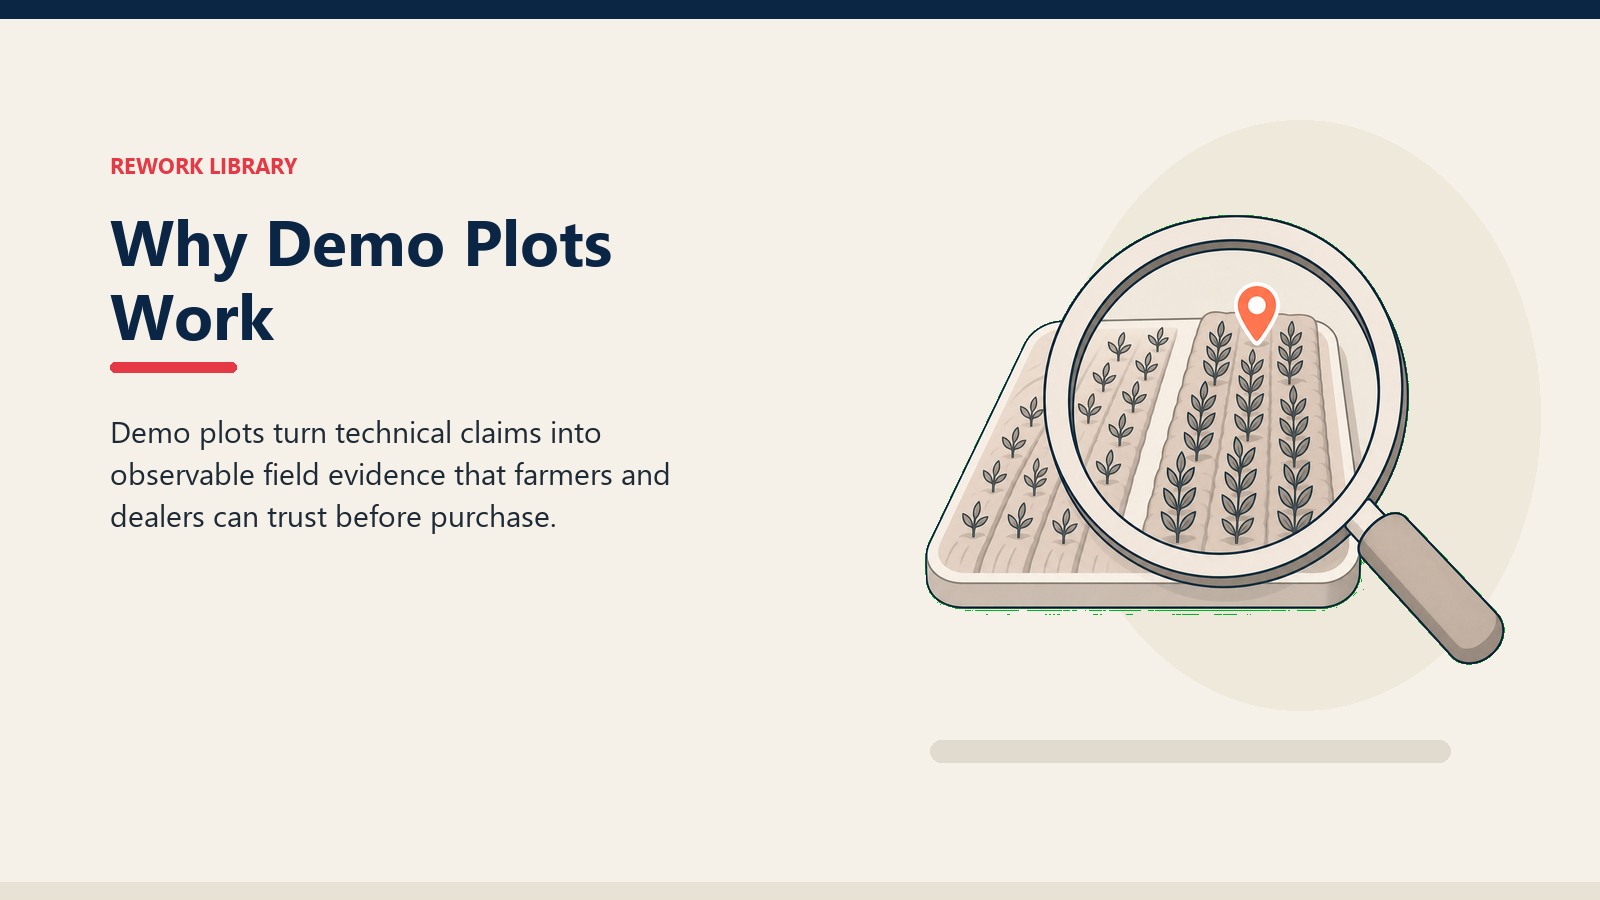
The psychology is straightforward: a farmer who sees the treated strip outyield the control on a neighbor's field, on his own soil type, in his own rainfall zone, trusts that result in a way no trial data from a distant research station can match. The specificity of local evidence collapses the distance between "this works somewhere" and "this will work here." A demonstration farm, as Wikipedia defines it, exists primarily to demonstrate agricultural techniques in a setting where farmers can observe real-world results, which is precisely why a well-placed trial acre generates more credibility than a slide deck ever could.
The demand-generation mechanism works through three stages: exposure (a farmer sees the plot), credibility (the result confirms that the product works locally), and pull (the farmer asks the dealer for the product). Each stage requires active management. Exposure doesn't happen unless you bring farmers to the plot at the right crop stage. Credibility doesn't land unless the comparison is visible and explained. Pull doesn't convert unless the dealer is stocked and the rep follows up.
This is why demo plots are a sales pipeline asset, not a science experiment. They need placement criteria, activation moments, conversion conversations, and measurement. A study of over 800 smallholder households in Tanzania published in PLoS ONE found that access to demonstration plots increased input purchasing by 13 to 17 percentage points, with the effect strongest when inputs were available within 5 km of the plot, confirming that the commercial outcome depends on both the visible trial and the dealer's stocking position.
Key Facts: Demo Plot Demand Generation
- Access to a demo plot increased the probability that smallholder farmers purchased improved inputs by 13 percentage points. Combining demo plot access with small input sample packs pushed that figure to 17 percentage points. The effect was strongest when inputs were available within 5 km of the plot (Sseguya et al., PLOS ONE, 2021, n=800+ households, Tanzania; doi:10.1371/journal.pone.0243896).
- Farmer field days in Odisha, India averaged 41 farmers per event, about 59% of rice-farming households per village. Field days increased technology adoption by 12 percentage points (from 30% to 42%) and single-package seed purchases rose 59%. Crucially, benefits did not spill over to non-attendees, which means getting the right farmers to the harvest activation event is as important as running the event itself (Emerick et al., Review of Economics and Statistics, 2021, Vol. 103(4), pp. 680-693).
- A panel study tracking Ethiopian farmers from 1999 to 2009 found that neighbor-to-neighbor learning had a more durable long-run effect on technology adoption than learning from extension agents. Demo plots that place visible evidence on a respected progressive farmer's field tap this peer-learning channel in ways that off-farm trial data cannot (Krishnan and Patnam, American Journal of Agricultural Economics, 2014, Vol. 96(1)).
How Do You Choose the Right Plot Location?
Not every plot location is equal. Placement determines whether the plot generates commercial exposure or sits unobserved at the edge of someone's land.
Host farmer selection is the first and most consequential decision. The best host farmers share three characteristics: they're respected by their neighbors (progressive farmer status, local credibility), they're willing to let other farmers visit the plot at key crop stages, and their land is accessible enough for group visits without major logistics overhead. A plot on a respected progressive farmer's most visible field will generate ten times the observation traffic of a technically identical plot on an isolated smallholder's field.
Use a placement scorecard to evaluate candidate locations before committing:
| Criteria | Score 1 | Score 2 | Score 3 |
|---|---|---|---|
| Host farmer local credibility | Low (new farmer, limited network) | Moderate (known in village) | High (progressive farmer, cooperative member) |
| Field visibility from main road or path | Not visible | Partially visible | Directly visible |
| Proximity to other farmers' fields | More than 2 km from cluster | 1-2 km | Less than 1 km |
| Accessibility for group visits | Vehicle access difficult | Vehicle access possible | Easy access, space for group |
| Crop management quality | Inconsistent | Average | Consistently good |
| Dealer proximity | More than 10 km | 5-10 km | Less than 5 km |
Plots scoring below 12 should not be used as primary commercial demo sites. They can serve as agronomic observation points, but don't invest activation resources there.
Crop and variety selection should match the dominant commercial opportunity in the territory, not what's easiest to manage agronomically. If the target is a fungicide for wheat rust, the demo goes on wheat. If there's a new insecticide for cotton bollworm, cotton is the plot crop. The alignment between plot crop and the rep's sales focus determines whether the harvest conversation leads naturally into a purchase.
Geography and cluster logic matters as much as the individual site. The most productive demo-plot programs concentrate trials in clusters. Five plots within a 3 km radius of a high-density farmer village will generate more shared observation than twenty scattered plots across a large territory. Cluster placement allows one field-day event to activate multiple plots simultaneously and lets dealer catchment areas align with farmer observation zones. CropLife International's Good Agricultural Practices guidance emphasizes that local demonstration farms paired with advisory services help farmers test inputs under their own conditions, making cluster-based placement the approach most aligned with proven stewardship and demand-generation principles.
Plot Design for Commercial Impact
The design inside the field matters because farmers are visually comparing, not reading data tables. The setup needs to make the comparison obvious at 10 meters.
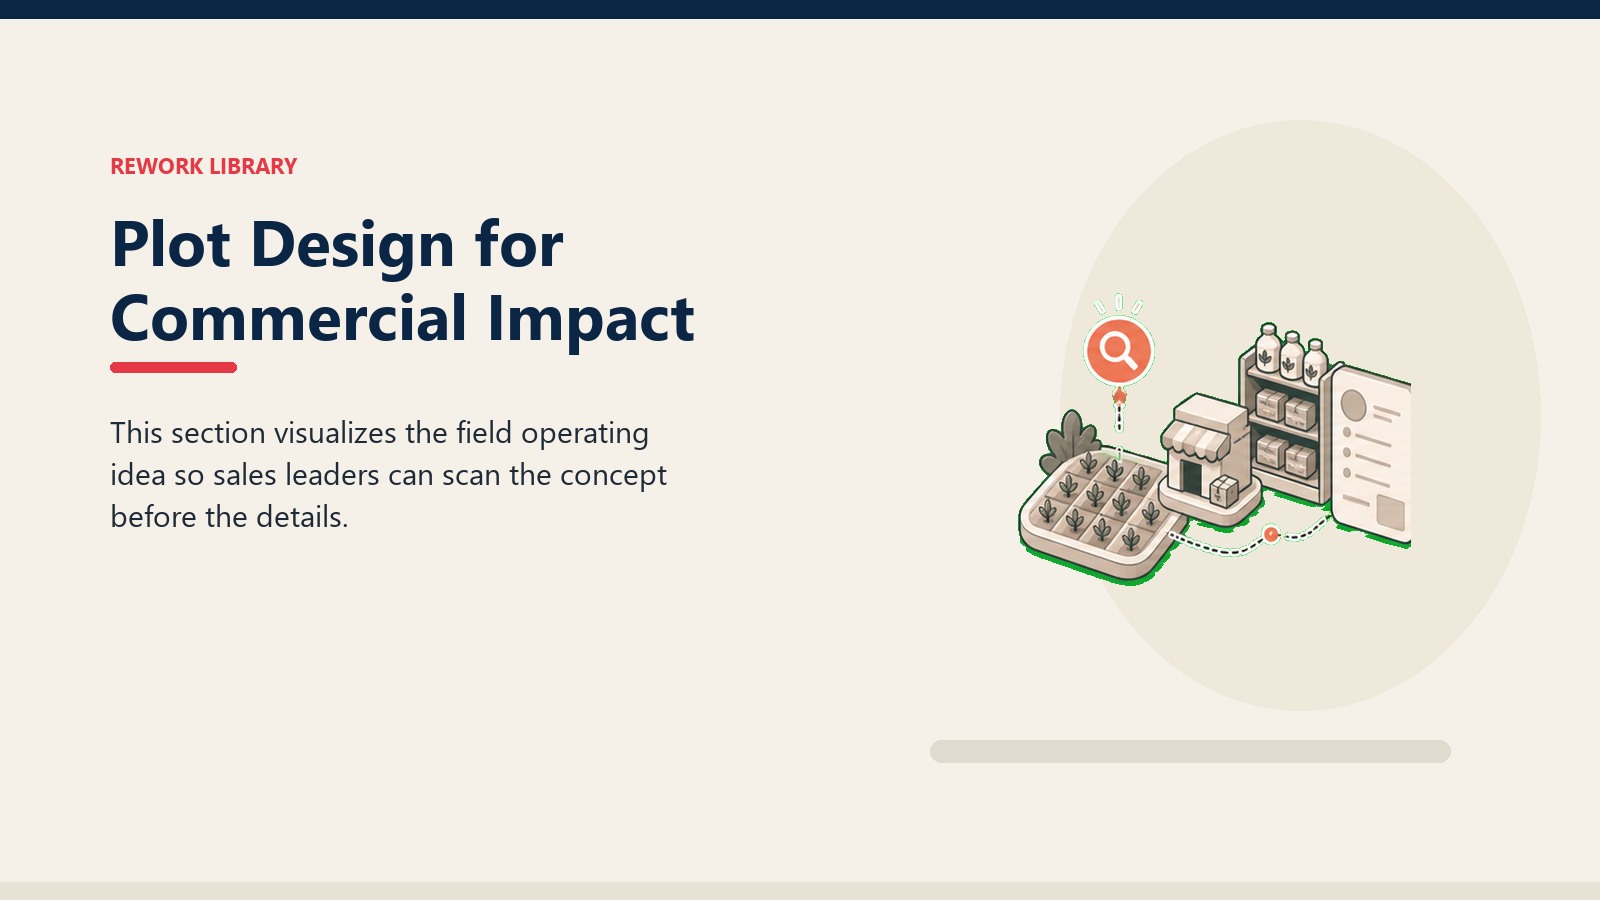
Strip layout is the standard format. The treated strip should occupy at least 60% of the plot width so it's the dominant visual impression. The control strip (farmer's current practice) runs alongside it, clearly marked. Some programs add a third strip with a competitor product, which is useful where competitive switching is the primary commercial objective, but it adds management complexity. Start with two strips if the team is building the demo-plot program for the first time.
Measurement checkpoints by crop stage turn an agronomic observation into a commercial conversation:
| Crop Stage | What to Measure | Commercial Hook |
|---|---|---|
| Germination / Early Establishment | Germination rate, plant population | "Look at the uniformity in the treated row vs. control" |
| Vegetative Growth | Crop height, canopy color, leaf area | "The crop is using inputs more efficiently here" |
| Flowering / Fruiting | Flower count, fruit set, early pest/disease scores | "We're seeing less disease pressure on the treated side already" |
| Pre-harvest | Yield estimate (visual ear/head count), pest/disease severity | "This is the conversion moment, bring observers here" |
| Harvest | Actual yield, quality grade, grain weight | "The number farmers remember when they decide next season" |
Schedule field visits for stages 3 and 4 specifically. Stage 3 is where pest/disease differences become visible and where early-adopter farmers start asking questions. Stage 4 is where the visual yield gap is clearest and where conversion conversations happen.
Signage and markers should identify the treated and control strips clearly, with the company name and product name visible. Where WhatsApp is used for field updates, a simple label with a plot code allows the rep to send photos tagged to the specific plot and farmer group.
Linking Plots to the Seasonal Calendar
Demo plot timing has to align with the territory's sowing window and with the rep's visit frequency plan. A plot planted after peak sowing in the area misses the window when farmers are making input decisions for the season. A plot planted at the right time but observed only once misses the crop stages where the evidence is strongest.
Map the demo plot calendar against the crop calendar before the season opens. For a typical kharif season in a wheat-rice area, for example, the plot placement window is narrow: seed selection decisions happen 3-4 weeks before sowing, and the sowing window itself runs 2-3 weeks. Miss it and the plot contributes to the next season at best.
Competitor activity is the other timing variable. If a competitor typically runs a demo-plot activation program in the territory during mid-season, plan your own harvest field day before theirs. The farmer who sees your results and has a conversion conversation with your rep before the competitor's event is already tilted toward a decision.
See Season Campaign Planning for the full territory-level calendar framework and Farmer Segmentation and Targeting for how to prioritize host farmer selection within the campaign structure.
Activating the Plot as a Sales Tool
The plot doesn't generate demand on its own. The rep activates it by bringing observation traffic to the right crop stages and by creating structured conversion moments around what farmers see.
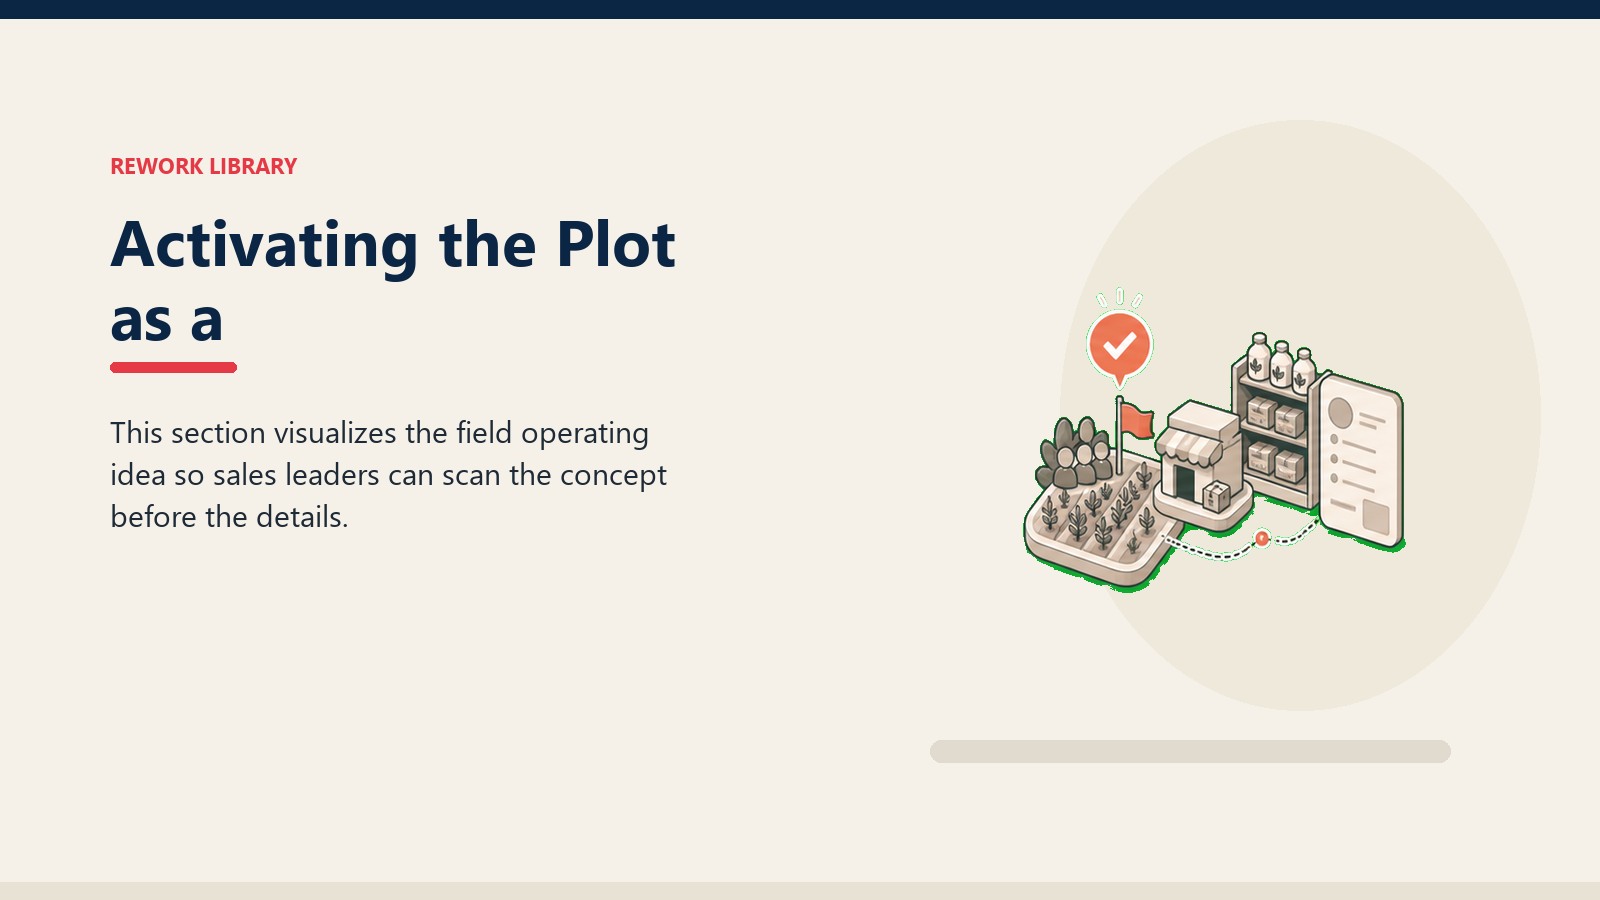
Farmer group visits are the primary activation format. Invite six to fifteen farmers from the same village or cluster for a 45-minute crop walk at the pre-harvest or harvest stage. The format is informal but structured: a short agronomic explanation, a walk through both strips, a Q&A that the rep facilitates (not dominates), and a natural conversation about where the dealer stocks the product. Keep the product pitch minimal. Let the crop do the talking. The rep's job is to help farmers articulate what they're seeing.
WhatsApp photo updates extend the plot's reach beyond the group visit. Take photos at each checkpoint stage and send them to the host farmer's network with a brief caption explaining the visual. "This is the wheat at 40 days: treated side on the left, control on the right" is enough. The host farmer often shares these organically with his own network, which extends the observation radius without additional rep time. See Field Reporting and Demo Tracking for how to log and track this digital activation.
Dealer co-activation is what connects field observation to purchase. The dealer who's present at the harvest visit and who has stock ready is positioned to take orders on the day. Coordinate with the dealer at least two weeks before the harvest field day to confirm stock position and to align on the scheme or price incentive that applies to farmers ordering that season. See Farmer Meetings and Field Days for how to structure multi-farmer events.
This pull-through dynamic is similar to what pharmaceutical field teams call a medical education event: scientific evidence presented in a credible context generates prescriptions that a product pitch alone wouldn't. The principle applies directly. See Medical Education Events as Lead Source for the structural comparison.
Quotable Nuggets
"A demo plot without a follow-up plan is a branded science experiment. It generates knowledge without generating demand." Rework Agri-Inputs Growth Library
"Field days increased technology adoption by 12 percentage points (from 30% to 42% of farmers) and single-package seed purchases rose 59%. Benefits did not spill over to non-attendees." Emerick et al., Review of Economics and Statistics, 2021. The implication: getting the right farmers to the harvest activation event matters as much as running the event itself.
"Demo plot access increased the probability of purchasing improved inputs by 13 to 17 percentage points, with the effect strongest when inputs were available within 5 km of the plot." Sseguya et al., PLOS ONE, 2021, Tanzania, n=800+ households. The commercial conclusion: dealer stock position is part of the demo-plot program, not a separate concern.
The Demo-Plot Pipeline Framework: Treat every demo plot as a five-stage commercial pipeline asset: (1) Placement: select host farmer and location using the placement scorecard; (2) Observation: schedule farmer group visits at pre-harvest and harvest stages specifically; (3) Activation: facilitate the three conversations (yield gap, cost-return, next-step close); (4) Dealer capture: confirm stock position and take orders on the day; (5) Measurement: track observer-to-inquiry-to-order conversion rates. Plots that skip stages 3 through 5 produce knowledge, not orders.
Converting Observer Farmers to Buyers
Three conversations move a farmer who's watched a demo plot from interested observer to confirmed buyer. They don't happen in sequence. They can happen in the same 30-minute field walk. But each one needs to land.
Conversation 1: The yield gap acknowledgment. "What did you notice about the difference between the two strips?" Let the farmer articulate the observation. Don't lead with "our product gave 18% higher yield." Ask what he saw. Farmers who express the conclusion themselves believe it more strongly than farmers who're told it. The rep's job here is to confirm and quantify: "You're right. We measured it at harvest, and the treated strip came in at 28 maunds versus 23 on the control. That's on your neighbor's soil, same water, same weather."
Conversation 2: The cost-return frame. "Does that difference cover the input cost?" This is where the rep walks through the math simply. Cost of the seed or chemical treatment per acre, expected yield increase based on what they just saw, and current farmgate price. If the numbers work on that farmer's scale, he knows it in 5 minutes. Don't skip this conversation. Farmers who see yield improvement but haven't done the margin math in their head don't always convert because the benefit feels uncertain against the cost.
Conversation 3: The next-step close. "Would you want to try a plot on your own farm next season, or are you ready to use it on a larger area?" The first option is for risk-averse farmers who need a personal trial before scaling. The second is for farmers who've already decided. Both are valid next steps. The rep captures the name and the commitment, and hands it to the dealer for follow-up within the week.
For the prospecting framework that applies to identifying which observer farmers are worth prioritizing, see Prospecting Strategy.
Measuring Plot ROI
A demo-plot program that doesn't measure conversion rates can't improve. Most agri-input field teams track plot count. The ones that build competitive advantage track plot-level demand outcomes.
The demo-to-purchase conversion funnel:
| Stage | Metric | How to Track |
|---|---|---|
| Plots established | Total plots planted by rep, by territory | Monthly plot registration in field reporting tool |
| Observer farmers reached | Farmers who visited the plot or received WhatsApp updates | Attendance log per plot activation event |
| Inquiry conversations | Farmers who asked about product, pricing, or availability | Rep call notes; dealer walk-in records post-event |
| Trial commitments | Farmers who committed to a personal trial or small purchase | Rep visit notes, order request to dealer |
| Confirmed orders | Purchase orders placed with dealer referencing demo plot | Dealer secondary sales tracking |
Cost per acquisition from the demo-plot program is the output metric that justifies the investment. Divide total program cost (rep time, plot materials, event costs) by confirmed orders generated. Compare it against orders generated through trade promotion spend. In most agri-input markets, a well-managed demo-plot program produces lower cost per acquisition than trade promotions, because it generates demand from the farmer side rather than pushing stock through the dealer channel.
Territory managers should review plot-level conversion data by rep every month during the active season. Reps with low observer traffic need coaching on group visit activation. Reps with high observer traffic but low inquiry conversion need coaching on the yield gap and cost-return conversations. The Promotions and Trade Scheme Execution framework provides a useful parallel for structuring the commercial layer of demo activation programs.
See Demo Plot Management and Conversion for the full plot tracking and management system.
Conclusion: Demo Plots Work When They're Managed as a Sales Pipeline
The rep who planted twenty plots and watched a competitor close the harvest was right that demo plots are valuable. He was wrong about what makes them valuable.
A demo plot without a follow-up plan is a branded science experiment. It generates knowledge without generating demand. The product might be excellent. The results might be clear. But if no farmer group ever walked through those strips with a rep who facilitated the right three conversations, and if no dealer was positioned to take orders when farmer interest peaked, the plot produced no commercial outcome.
The teams that consistently convert demo plots into purchase orders treat every plot as a pipeline asset from day one. They select host farmers who'll generate observation traffic. They design for visual comparison. They schedule activation events at the right crop stages. They bring the dealer along. They follow up within 48 hours on every observer who expressed interest. And they measure conversion at each stage of the funnel.
That's the difference between a program that generates sales and a program that generates photos for the quarterly report.
Frequently Asked Questions about Demand Generation via Demo Plots
How many demo plots should a rep manage in a season?
It depends on territory size and plot activation capacity. A rep who can properly activate six to eight plots, meaning scheduling group visits, managing WhatsApp updates, and following up on every observer conversation, will generate more orders than a rep who plants fifteen plots with minimal activation. Plot count is not the metric. Activated, tracked, conversion-focused plots are the metric.
What crops are best for demo plots?
The crop should match the rep's primary commercial opportunity for the season. If the target product is a fungicide for a specific pest on wheat, the demo goes on wheat. If it's a hybrid seed with a yield advantage in cotton, the demo is on cotton. Agronomic convenience is the wrong selection criterion. Commercial alignment is the right one.
How should reps handle plots where the results are disappointing?
Unfavorable results happen: weather events, poor agronomic management by the host farmer, or baseline soil variability can all affect outcome. The rep should document the agronomic reason honestly, close the plot without a commercial activation event, and plan a replacement plot in a more controlled location next season. Trying to run a conversion event off a weak result damages credibility far more than a quiet close.
When should the dealer be involved in demo plot activation?
From the planning stage. The dealer should know the plot locations, the planned harvest dates, and the expected group visit timing at the start of the season. By the time the harvest activation event happens, the dealer has stock positioned and is ready to take orders. Last-minute dealer coordination consistently fails because stock may not be available and the dealer isn't mentally prepared to close.
What does the research say about demo plot benefits spilling over to non-attending farmers?
Less than you'd hope. The Emerick et al. (2021) Odisha study found that the adoption gains from farmer field days did not spill over to non-attendees in the same village during the same season. Neighboring farmers who didn't attend did not adopt at higher rates than control villages. This is a critical program design implication: you can't count on awareness diffusing organically within the season. If you want 60 farmers in a village to adopt, you need 60 farmers (or close to it) to actually walk the demo plot. In subsequent seasons, spillover effects from visible on-farm results can be stronger. But in the activation season, in-person attendance drives the commercial outcome.
Learn More

Senior Implementation Consultant
On this page
- Why Demo Plots Generate Demand
- How Do You Choose the Right Plot Location?
- Plot Design for Commercial Impact
- Linking Plots to the Seasonal Calendar
- Activating the Plot as a Sales Tool
- Quotable Nuggets
- Converting Observer Farmers to Buyers
- Measuring Plot ROI
- Conclusion: Demo Plots Work When They're Managed as a Sales Pipeline
- Learn More