Customer Health Monitoring: Building Early Warning Systems
Turn this article into takeaways for your work.
Each assistant summarizes the article only for you and suggests best practices for your work.
A VP of Customer Success was frustrated. Every month, 2-3 customers would cancel unexpectedly. The team would scramble, but it was too late, customers had already made their decision weeks earlier.
When asked how they knew which customers were at risk, the VP said: "We track them in spreadsheets. CSMs update them when they notice something wrong."
The problems were obvious. CSMs only noticed issues when customers complained, purely reactive. Spreadsheets required manual updates, which meant inconsistent and lagging data. There was no systematic way to identify at-risk accounts, just gut feel. And high-value accounts kept slipping through the cracks.
They implemented a customer health monitoring system with automated data collection from product, support, and CRM. It calculated health scores in real-time, provided a dashboard for portfolio view, sent alerts when scores dropped, and included intervention playbooks by risk level.
After 90 days, the results were compelling. They identified at-risk accounts 4-6 weeks earlier, giving the team time to intervene. Churn dropped by 38%, proof that proactive intervention works. They found 15 expansion opportunities by spotting accounts with high health and growth signals. And CSMs spent 50% less time updating spreadsheets and more time with customers.
The lesson? You can't fix what you can't see. Systematic health monitoring is essential for retention.
Customer Health Concept
What Is Customer Health
Customer health is the overall state and likelihood of a customer achieving their goals with your product, staying long-term, and expanding their relationship with you.
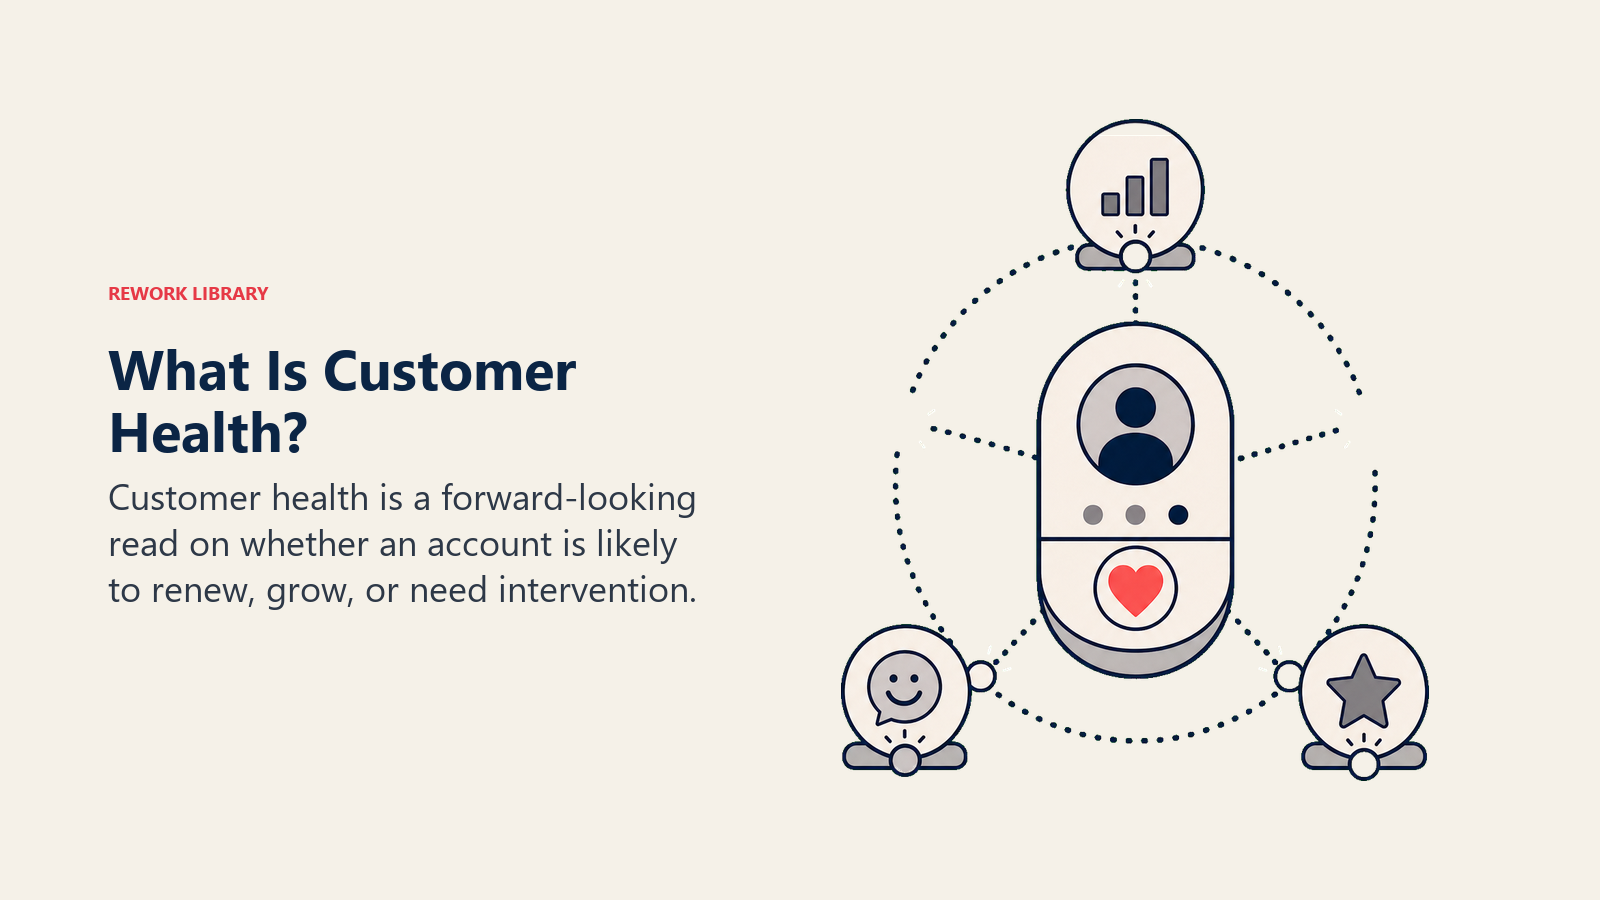
It encompasses several dimensions: product usage and engagement, value realization and outcomes, relationship quality, financial health and stability, sentiment and satisfaction, and growth trajectory.
Why does health matter? It predicts retention and churn risk, identifies expansion opportunities, helps prioritize CSM focus and resources, enables proactive intervention, and provides early warning of problems.
Health vs Satisfaction vs Loyalty
Customer satisfaction measures how happy customers are with your product and experience. It's measured through surveys like CSAT and NPS, captures what customers say (attitudinal), and can be high even if they're barely using the product.
Customer loyalty measures how likely customers are to stay and recommend you. It's measured through NPS and intent to renew, captures what customers intend to do, and can also be high even when usage is declining.
Customer health measures the likelihood of achieving goals and staying long-term. It's measured through behavioral data, what customers actually do, and is most predictive of actual outcomes.
Here's the relationship: high satisfaction and loyalty usually mean a customer is healthy. But customers can be satisfied and loyal while still being unhealthy if they have low usage. Health is the most predictive of actual retention, but you should use all three for a complete picture.
Take Customer A as an example. They gave you an NPS of 9, making them a promoter who's very satisfied. But their usage has declined 30% over 3 months, putting their health at risk.
Why? They like the product (satisfied), but their team isn't using it (declining usage), which means they'll likely cancel at renewal. Health predicts the outcome better than satisfaction.
The action? Proactive intervention despite high satisfaction scores.
Leading vs Lagging Health Indicators
Lagging indicators tell you what already happened. They include churn (customer already left), renewal rate (after the decision was made), NPS scores (reflecting past experience), and revenue retention.
Leading indicators predict what's coming. They include usage trends (declining activity), feature adoption (breadth and depth), support ticket volume and type, health score changes, and engagement with CSMs.
Leading indicators matter because they enable proactive intervention before it's too late. They give you weeks or months notice to fix issues, resulting in better outcomes, an 80% save rate compared to 20% when you're just reacting.
Here's the difference in practice. With a lagging indicator, the customer submits a cancellation and it's too late. With a leading indicator, usage drops 40% over 2 months, giving you 60 days notice. The CSM intervenes and identifies the issue (team turnover), provides re-onboarding for new team members, usage recovers, and retention is saved.
Account-Level vs User-Level Health
Account-level health shows the overall health of your entire customer relationship. It aggregates user-level data and is used for retention and expansion decisions, it's the CSM's responsibility.
User-level health shows the health of individual users within an account. It identifies engaged versus at-risk users and is used for adoption and engagement strategies, helping you determine individual intervention needs.
Both are important because they reveal different risks. Account health can mask user issues. For example, an account might look overall healthy with 60% of users active, but if your key executive sponsor isn't logging in, you have a real risk. You need user-level visibility to catch this.
Similarly, user health can mask account issues. Some users might be very engaged, but if overall license utilization is only 30%, you're looking at waste. You need the account-level view to spot this pattern.
The solution is to track both. Use account health for retention decisions and user health for adoption strategies. Alert when key users are at risk, and roll up user health to contribute to the account score.
Health Monitoring Framework
Data Sources and Inputs
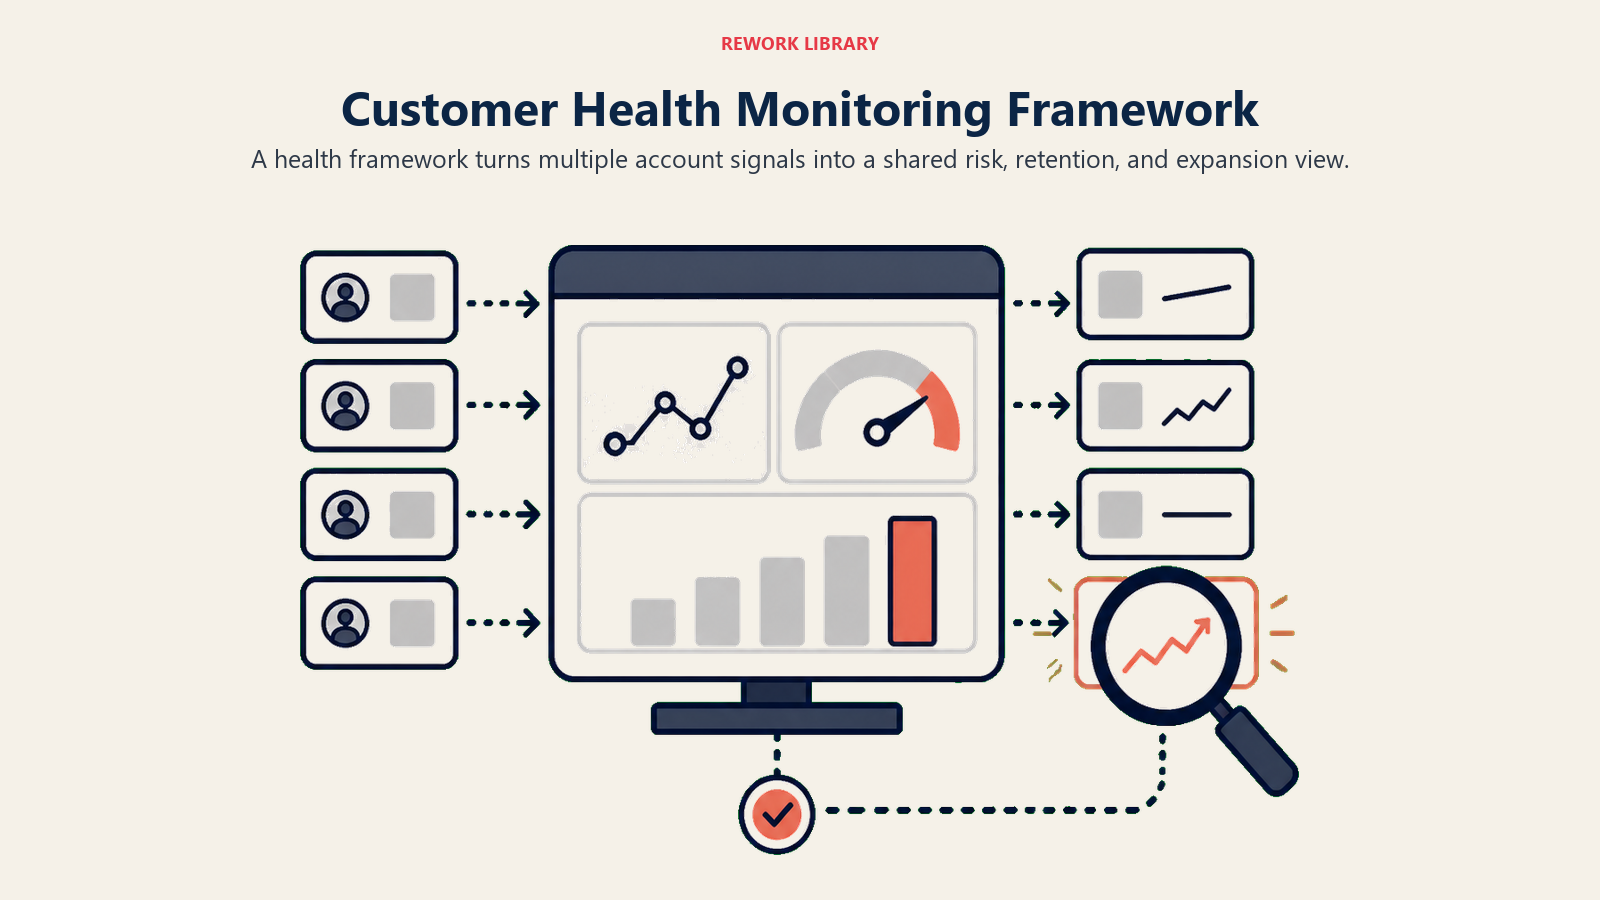
A comprehensive health monitoring system pulls data from six main sources.
Product Usage Data tracks login frequency and recency, feature usage (breadth and depth), session duration and activity, workflows completed, and data created and stored. This comes from your product analytics platform, usage tracking database, and event logs.
Engagement Data captures CSM touchpoints and interactions, quarterly business review attendance, training and webinar participation, community activity, and email engagement (opens and clicks). You'll find this in your CRM system, customer success platform, marketing automation, and community platform.
Support Data includes ticket volume and frequency, issue severity and type, time to resolution, customer satisfaction scores, and escalations. This flows from your support ticketing system and help desk platform.
Sentiment Data covers NPS scores, CSAT scores, survey responses, executive feedback, and CSM sentiment assessments. These come from survey tools, CRM notes, and CSM qualitative input.
Relationship Data documents whether you've identified an executive sponsor, whether there's a champion present, frequency of touchpoints, relationship strength ratings, and contract and renewal dates. You'll track this in your CRM system and customer success platform.
Financial Data tracks ARR and contract value, payment history (on-time versus late), expansion and contraction history, and budget approval and planning. This data lives in your billing system, finance data, and CRM.
Health Dimensions and Categories
Health scores typically include six dimensions, each weighted based on how predictive it is of retention.
The Usage Dimension (30-40% of score) looks at active users as a percentage of licenses, login frequency, feature adoption depth, and usage trends (growing versus declining).
The Engagement Dimension (15-25%) measures CSM touchpoints, QBR participation, training attendance, and community involvement.
The Value Dimension (15-25%) tracks outcomes achieved, ROI demonstrated, business impact, and use case expansion.
The Sentiment Dimension (10-20%) captures NPS score, support satisfaction, feedback sentiment, and executive satisfaction.
The Relationship Dimension (10-15%) evaluates executive sponsorship, champion presence, relationship depth, and account penetration.
The Financial Dimension (5-10%) considers payment history, contract status, expansion history, and spend trajectory.
Scoring and Weighting Methodology
Example Health Score Calculation:
| Dimension | Weight | Score (0-100) | Weighted Score |
|---|---|---|---|
| Usage | 35% | 75 | 26.25 |
| Engagement | 20% | 80 | 16.00 |
| Value | 20% | 70 | 14.00 |
| Sentiment | 15% | 85 | 12.75 |
| Relationship | 10% | 60 | 6.00 |
| Total | 100% | , | 75.00 |
Here's how to weight dimensions properly. Start by analyzing historical data to see which dimensions correlate most with retention and which predict churn earliest. Then assign the highest weights to the most predictive dimensions, usage typically gets 30-40% since it's most predictive, and balance the other dimensions. Finally, validate and adjust by testing your score against actual outcomes, adjusting weights based on predictive accuracy, and refining quarterly based on learnings.
Let's look at how dimension scoring works in practice.
For a Usage Score, you might allocate 40 points to active users (so 70% active would give you 28 points), 30 points to login frequency (daily login gets 30, weekly gets 20, and so on), and 30 points to feature depth (60% of features adopted gives you 18 points). That totals 76 points out of 100.
For an Engagement Score, you could assign 40 points to QBR attendance (attended gets 40, skipped gets 0), 30 points to CSM response rate (100% response gets 30 points), and 30 points to training participation (2+ sessions gets 30 points). That totals 100 points out of 100.
Segmentation and Thresholds
Health Score Ranges:
Healthy (75-100) means high usage and engagement, a strong relationship, secure retention, and expansion opportunities. Your action here is to maintain the relationship, explore growth, and recruit advocates.
Moderate (50-74) indicates acceptable usage but room for improvement, some engagement gaps, and retention that's likely but not guaranteed. Focus on proactive improvement initiatives.
At Risk (25-49) signals low or declining usage, weak engagement, and retention at risk. This requires immediate intervention and escalation.
Critical (0-24) means very low usage or dormant activity, no engagement, and a likely churn. Escalate to executives and create a save plan.
Keep in mind that different segments may have different "healthy" thresholds. Enterprise accounts might be considered healthy at 70+ (given their complexity and longer adoption cycles) and at risk below 50. SMB accounts might need 80+ to be healthy (simpler products, faster adoption) and are at risk below 60. Set segment-specific thresholds based on your data.
Trending and Momentum
Health score direction often matters more than the absolute value.
Take improving health as an example. A score moving from 60 to 65 to 70 shows an upward trend. Even if it's currently moderate, the trajectory is positive, so mark the status green, they're getting better.
Declining health tells a different story. A score dropping from 80 to 75 to 70 is still "healthy" by threshold, but the downward trend is concerning. Mark this yellow, it needs attention.
Stable health is a score that stays flat, like 70 to 71 to 70. There's no improvement or decline, so the status depends on the absolute value.
Track momentum at multiple intervals: 30-day change shows short-term trends, 90-day change shows medium-term trends, and 180-day change captures long-term trends.
Set alerts for rapid changes: a 10+ point drop in 30 days signals rapid decline, a 15+ point drop in 90 days indicates sustained decline, and crossing a threshold (healthy to at risk) always requires action.
Health Data Sources
Product Usage Analytics
The key metrics here include Daily/Weekly/Monthly Active Users, login frequency per user, session duration, feature usage (which features and how often), workflows completed, and data volume created.
You can collect this data through a product analytics platform like Amplitude or Mixpanel, custom event tracking, database queries, or API calls.
For integration, set up an automated data pipeline with daily or real-time sync, aggregate data in your data warehouse, and push it to your health scoring system.
Engagement and Activity Data
Track CSM touchpoint frequency, QBR attendance and participation, email opens and clicks, webinar and training attendance, community activity (posts and replies), and help center searches.
Collect this data from CRM activity logs, marketing automation tools, webinar platforms, community platform APIs, and help center analytics.
For integration, use your CRM as the central hub, pull in data through API integrations from other systems, and have CSMs manually log calls and meetings.
Support Tickets and Issues
The key metrics are ticket volume (count per month), ticket severity (P1 versus P2 versus P3), issue types (bug, question, feature request), time to resolution, reopen rate, and support CSAT scores.
Collect this from your support ticketing system like Zendesk or Intercom through API integration and automated tagging and categorization.
Here's what it means for health. High ticket volume suggests potential friction, that's a red flag. P1 tickets indicate serious issues, another red flag. Feature requests show engagement, which is neutral or positive. And fast resolution plus high CSAT scores mean good support, which is neutral or positive overall.
Sentiment and Feedback
Track NPS scores, CSAT scores, survey responses, qualitative feedback, and CSM sentiment ratings.
Collect this through survey tools like Delighted or Wootric, post-support surveys, QBR feedback, and CSM qualitative assessments.
Integrate by connecting your survey tool API to your health platform, having CSMs manually input qualitative ratings, and using sentiment analysis if you have text feedback.
For scoring, NPS 9-10 gets 100 points, NPS 7-8 gets 70 points, and NPS 0-6 gets 30 points. Weight recent scores more heavily than older ones.
Relationship and Touchpoints
The key metrics here are whether you've identified an executive sponsor, whether there's a champion present, CSM touchpoint frequency, meeting attendance rate, relationship strength (as rated by the CSM), and account penetration (number of departments using the product).
Collect this from CRM contact data, CSM assessments, activity logging, and org chart mapping.
Score it like this: executive sponsor adds 20 points, an active champion adds 20 points, monthly touchpoints add 20 points, multi-department usage adds 20 points, and a strong relationship rating adds 20 points.
Financial and Commercial Data
Track contract value (ARR), payment status (current, late, or past due), renewal date proximity, expansion history, and contraction history.
Pull this from your billing and finance system, CRM opportunity data, and contract management system.
Here's what it means for health. Late payments suggest financial distress, a yellow flag. Recent expansion shows healthy growth, green flag. Recent contraction indicates possible issues, yellow flag. And an approaching renewal is time-sensitive, so set an alert.
Building Health Monitoring Systems
Technology and Tooling Requirements
A health monitoring system needs four core components.
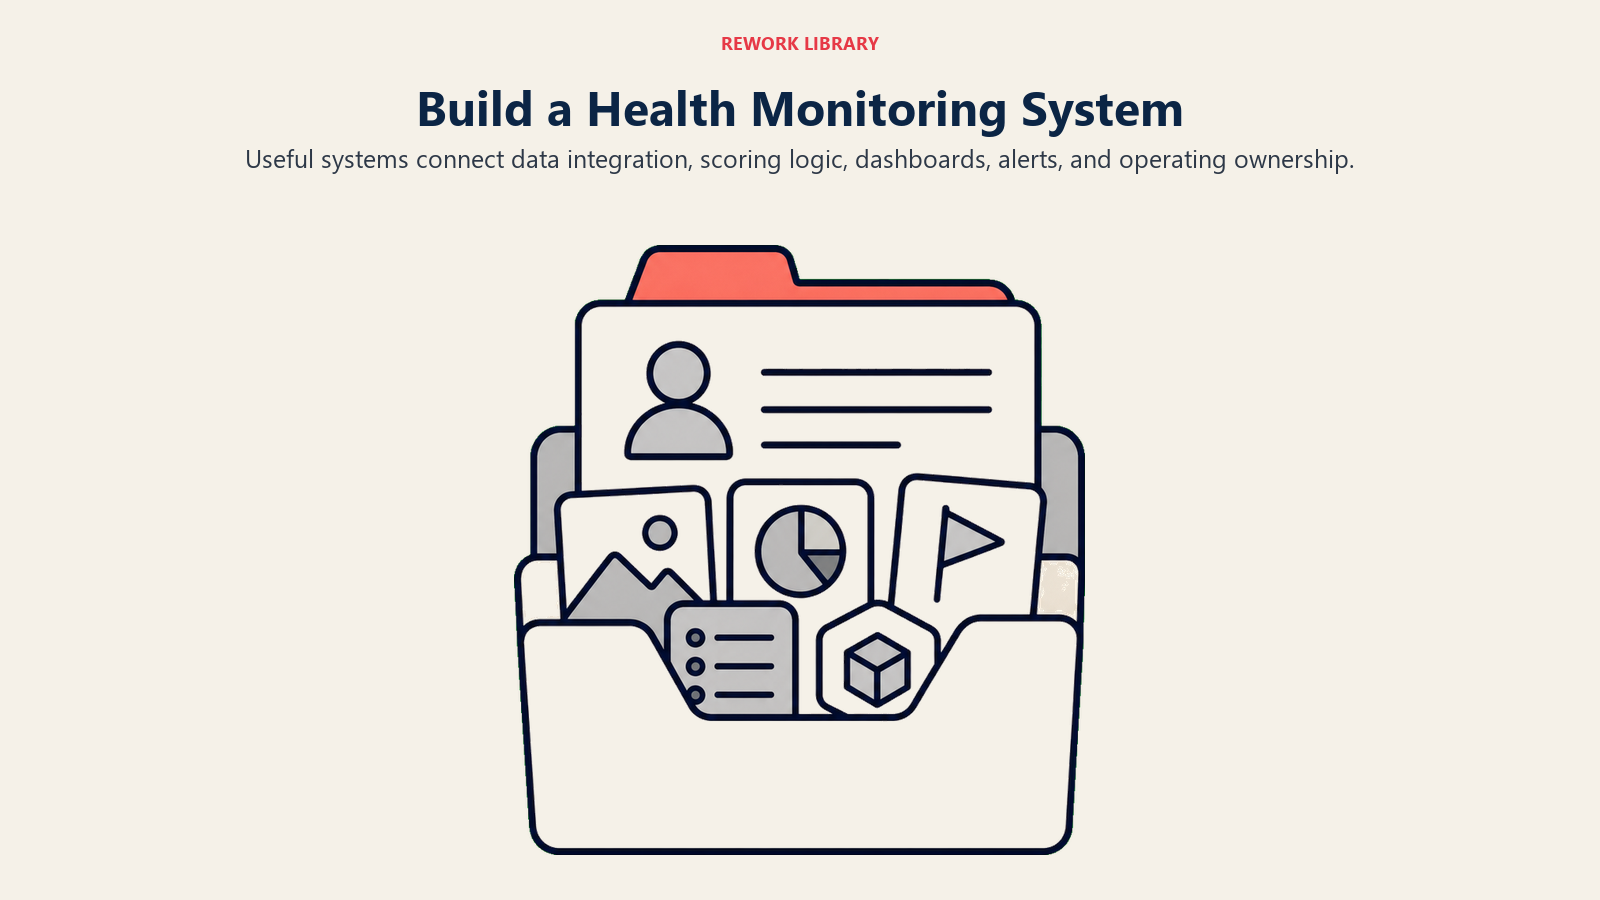
First, you need a data integration platform that pulls data from all sources, normalizes and aggregates it, and processes it either in real-time or in batches. You can choose a customer success platform like Gainsight, Totango, or ChurnZero, use a data warehouse like Snowflake, BigQuery, or Redshift, or build custom integrations using APIs and webhooks.
Second, you need a scoring engine that applies your scoring logic, calculates dimension scores, weights and aggregates them, and tracks trends and changes.
Third, you need a visualization layer with dashboards for different audiences, drill-down capabilities, filtering and sorting, and export and reporting features.
Fourth, you need an alerting system that monitors thresholds, routes notifications, tracks alert responses, and handles escalation workflows.
When it comes to build versus buy, there are tradeoffs. Buying a customer success platform gives you fast implementation and proven functionality, but it costs more, offers less flexibility, and may not fit all your needs. Building a custom system gives you full control, can be tailored to your needs, and has lower ongoing costs, but it takes time to build, creates a maintenance burden, and requires engineering resources.
Most teams go hybrid: use a CS platform for core functionality, add custom integrations where needed, and tap into a data warehouse for complex analytics.
Data Integration and Pipeline
Integration Architecture:
Product DB → ETL Pipeline → Data Warehouse → Health Scoring Engine → Dashboard
CRM → API Integration → Data Warehouse → Health Scoring Engine → Dashboard
Support → API Integration → Data Warehouse → Health Scoring Engine → Dashboard
Survey Tool → API Integration → Data Warehouse → Health Scoring Engine → Dashboard
Your data pipeline has three main steps. First, extract data by pulling it from source systems on a schedule (hourly, daily, or real-time), handling API rate limits, and implementing error handling and retry logic.
Second, transform the data by normalizing formats, calculating derived metrics, aggregating to the account level, and joining data from multiple sources.
Third, load it by storing in your data warehouse, updating health scores, archiving historical data, and triggering alerts if thresholds are crossed.
Different data types need different frequencies. Pull usage data daily or in real-time, CRM data daily, support data daily, survey data as it's received, and financial data monthly.
Don't forget data quality checks. Validate data completeness, check for anomalies, monitor pipeline health, and alert on integration failures.
Calculation and Scoring Engine
The scoring logic follows four steps.
Step 1 calculates dimension scores. Usage is based on active users, frequency, and depth. Engagement is based on touchpoints, QBRs, and training. Value is based on outcomes, ROI, and use cases. Sentiment is based on NPS, CSAT, and feedback. Relationship is based on sponsor, champion, and penetration. Financial is based on payments, expansion, and contract status.
Step 2 applies weights by multiplying each dimension score by its weight, summing the weighted scores, and producing an overall health score from 0-100.
Step 3 determines status by comparing the score to your thresholds, assigning a status (Healthy, Moderate, At Risk, or Critical), and calculating the trend (improving, stable, or declining).
Step 4 generates insights by identifying key drivers (why is the score what it is?), flagging specific issues (like low usage or no executive sponsor), and recommending actions (suggested interventions).
Recalculate scores daily as new data arrives, track historical scores over time, and use version control to track changes to your scoring logic.
Dashboard and Visualization
You need three types of dashboards.
The Executive View shows a portfolio summary with overall health distribution, trends over time (improving or declining), at-risk account count, expansion opportunity count, and key metrics like retention rate and NPS.
The CSM View displays their assigned account list with scores, sortable by score, trend, or renewal date. It includes drill-down to account details, action items and alerts, and comparison to segment benchmarks.
The Account Detail View shows the overall health score and trend, a breakdown of dimension scores, key metrics over time, recent activities and touchpoints, alerts and recommended actions, and user-level health within the account.
Follow these visualization best practices: use color-coded status (green, yellow, red), add trend indicators (arrows, sparklines), keep visuals clear and simple to avoid overwhelming users, and make sure everything is mobile-friendly since CSMs are often on the go.
Alerting and Notifications
Set up three tiers of alerts based on urgency.
Critical Alerts require immediate action when the health score drops below 25, drops 20+ points in 30 days, a key executive sponsor goes dormant, a P1 support ticket opens, or a payment is past due. Route these to both the CSM and manager immediately.
High Priority Alerts need action within 24 hours when the health score drops into "At Risk" range, drops 10+ points in 30 days, usage declines 40%+ in 60 days, or there's no QBR attendance approaching renewal. Send these to the CSM in a daily digest.
Moderate Alerts need action within a week when there's a declining health score trend over 3 months, license utilization drops below 50%, there's been no CSM touchpoint in 60 days, or there's low feature adoption 3 months after onboarding. Send these to the CSM in a weekly digest.
For alert management, let CSMs acknowledge alerts to track response, add notes about what action they took, snooze alerts if they're temporarily not relevant, and close them when resolved.
Track alert effectiveness by monitoring the path from alert to action to outcome. Measure save rate by alert type, refine thresholds based on accuracy, and reduce false positives to avoid alert fatigue.
Health Dashboards
Executive Portfolio View
Purpose: Give leadership visibility into overall customer health
Key Metrics:
- Total customers by health status
- Health score distribution
- Trend over time (last 6 months)
- At-risk ARR
- Expansion-ready ARR
- Retention forecast
Layout:
Top Section: Summary Cards
- Total Customers: 487
- Healthy (75+): 312 (64%)
- At Risk (<50): 45 (9%)
- At-Risk ARR: $2.3M
Middle Section: Trends
- Health score distribution chart (histogram)
- Health trend over time (line chart)
- At-risk account count trend
Bottom Section: Focus Areas
- Top 10 at-risk accounts (by ARR)
- Recently declined (score drop >15 in 30 days)
- Approaching renewal (next 90 days)
Update Frequency: Daily
CSM Account View
Purpose: Give CSMs actionable view of their portfolio
Key Features:
- Account list with scores and status
- Sortable columns (score, trend, renewal date, ARR)
- Filterable (by status, segment, renewal date)
- Action items and alerts
- Click through to account details
Account List Columns:
- Account Name
- Health Score
- Trend (30-day change)
- Status (color-coded)
- ARR
- Renewal Date
- Last Touchpoint
- Alerts (count)
Sorting Options:
- Lowest score first (focus on at-risk)
- Biggest negative trend (declining health)
- Soonest renewal (time-sensitive)
- Highest ARR (prioritize value)
Filters:
- Status (At Risk, Moderate, Healthy)
- Segment (Enterprise, Mid-Market, SMB)
- Renewal window (Next 30/60/90 days)
- Has open alerts
Update Frequency: Real-time or daily
Customer-Facing Health Reports
Purpose: Share health insights with customers (transparency)
What to Include:
- Usage metrics (active users, feature adoption)
- Engagement metrics (training, QBR participation)
- Comparison to benchmarks (similar companies)
- Progress over time (celebrating wins)
- Recommendations (areas for improvement)
What to Exclude:
- Actual health "score" or grade (feels judgmental)
- Negative framing (don't shame them)
- Internal terminology (churn risk, etc.)
Format:
- QBR slide deck
- Monthly email digest
- Self-service dashboard (if available)
Example Customer Report:
"Your team's adoption grew 18% this quarter! You now have 78 active users (up from 66), and feature adoption increased to 6 of 8 core features. Companies with similar adoption levels report 2.3x productivity gains.
Recommendations to unlock more value: 1. Adopt reporting feature (teams see 40% time savings) 2. Enable integrations (increases usage by 60%) 3. Expand to marketing team (similar to [Customer X])"
Tone: Positive, constructive, helpful (not judgmental)
Drill-Down and Analysis Capabilities
Account Detail Drill-Down:
From Portfolio View:
- Click account → See full account details
Account Detail Page:
- Overall health score and trend
- Dimension scores breakdown
- Key metrics over time (usage, engagement)
- User-level health (list of users with scores)
- Recent activities (touchpoints, support tickets)
- Alerts and recommended actions
- Timeline (health score history)
User-Level Drill-Down:
From Account View:
- Click user → See individual user details
User Detail Page:
- User info (name, role, email, last login)
- Usage metrics (login frequency, features used)
- Engagement (training, community, emails)
- Support tickets
- Alerts
Cohort Analysis:
- Compare health across segments
- Industry patterns
- Company size patterns
- Use case patterns
Trend Analysis:
- Health scores over time
- Cohort improvements
- Seasonal patterns
- Impact of initiatives (before/after)
Real-Time vs Batch Updates
Real-Time Updates:
Advantages:
- Immediate visibility
- Fast response to issues
- Current data always
Use Cases:
- Critical alerts (P1 tickets, payment issues)
- Executive dashboards (board meetings)
- High-value accounts (extra monitoring)
Requirements:
- Real-time data pipeline (streaming)
- Infrastructure cost (more expensive)
- Engineering complexity
Batch Updates:
Advantages:
- Simpler architecture
- Lower cost
- Sufficient for most needs
Use Cases:
- Daily health score updates
- Weekly trend analysis
- Monthly reporting
Requirements:
- Scheduled jobs (nightly, hourly)
- Data warehouse
- Standard ETL pipeline
Hybrid Approach:
- Real-time: Critical alerts and high-value accounts
- Batch: Most health scores and dashboards
- Balance cost, complexity, and value
Using Health Data Operationally
CSM Prioritization and Focus
CSMs can't give equal attention to all accounts, so use health data to prioritize.
Break your portfolio into five tiers.
Tier 1: Critical Action Needed (10-15% of accounts) includes accounts with a health score below 40 or rapid decline, high ARR at risk, or renewal within 60 days. CSMs should have weekly touchpoints, implement a save plan, and escalate as needed.
Tier 2: Proactive Intervention (20-30% of accounts) includes accounts with a health score between 40-70 or moderate decline, and those approaching renewal in 60-120 days. CSMs should have bi-weekly touchpoints and run improvement initiatives.
Tier 3: Maintain and Grow (40-50% of accounts) includes accounts with a health score between 70-85 that are stable or improving. CSMs should have monthly touchpoints and discuss expansion opportunities.
Tier 4: Advocates and Champions (10-20% of accounts) includes accounts with a health score of 85+ and high engagement. CSMs should have quarterly touchpoints, recruit references, and provide VIP treatment.
Tier 5: Automated Nurture (remaining accounts) includes healthy and stable accounts with lower ARR. Use automated campaigns and self-service resources instead of regular CSM touchpoints.
A typical daily workflow looks like this: check the dashboard for alerts and at-risk accounts, focus on Tier 1 and 2 accounts, touch base with Tier 3 accounts on rotation, recruit Tier 4 advocates, and monitor Tier 5 via automation.
Account Review and Planning
Quarterly Account Review Process:
Preparation (Using Health Data):
- Pull account health report
- Review trends over past quarter
- Identify wins (improvements)
- Identify concerns (declines or gaps)
- Prepare recommendations
Review Meeting with Customer:
- Share health insights (in customer-friendly format)
- Celebrate wins and progress
- Address concerns collaboratively
- Set goals for next quarter
- Identify expansion opportunities
Post-Meeting:
- Update success plan
- Set follow-up actions
- Track in CRM
- Adjust health score if new info learned
Example Health-Informed QBR:
"Your adoption grew from 55% to 72% this quarter, great progress! Let's look at what's working and where we can improve.
Wins: - 12 new active users added - Feature X adoption reached 80% - Integration with [System] implemented
Opportunities: - Only 3 of your managers are using reporting feature - Training attendance dropped in month 3
Next Quarter Goals: - Get all 8 managers using reports - 2 team training sessions - Explore Feature Y (similar companies see 40% efficiency gain)"
Risk Mitigation Interventions
When a health score drops, follow this four-step process.
Step 1: Identify Root Cause. Which dimension declined, usage, engagement, or sentiment? What specifically changed, are active users down, is a specific user dormant, or is there a support issue? When did it start? Are there any external factors like company changes or market conditions?
Step 2: Select Intervention. If usage declined, try a re-onboarding session, run a feature adoption campaign, identify and remove friction, or escalate to executives if it's serious. If engagement declined, schedule a QBR or check-in, invite them to training or an event, or reestablish the executive relationship. If sentiment declined, address specific feedback, resolve support issues, or make a CSM escalation call.
Step 3: Execute and Monitor. Implement your intervention, track the health score weekly, measure impact (is it working?), and adjust if needed.
Step 4: Document and Learn. Ask what worked, what didn't, update your playbooks, and share learnings with the team.
Opportunity Identification
Look for expansion signals in your health data.
Accounts with high and growing health typically have a score of 80+ and improving, increasing active users, growing feature adoption, and high engagement.
Watch for specific indicators like license utilization above 85% (they need more seats), use of advanced features (they're ready for a premium tier), multiple departments using the product (cross-sell opportunity), API and integration usage (technical sophistication), and high support volume for "how to do X" questions (interest in expansion use cases).
Score opportunities by combining health score with expansion signals, then prioritize your outreach and tailor the conversation to the signals you're seeing.
Here's an example. An account has a health score of 88, license utilization at 92%, recent feature requests for a premium feature, and 15 new active users added in 90 days. The CSM reaches out with an expansion proposal, highlights the premium feature they asked about, offers additional licenses for team growth, and positions it as an investment in their success.
Conversion rates vary by health. Accounts with health scores of 80+ convert at 40-50% in expansion conversations. Accounts with health between 60-79 convert at 15-25%. Accounts below 60 convert at less than 10%.
Focus your expansion efforts on healthy, growing accounts.
Executive Reporting and Governance
Monthly Executive Report:
Portfolio Health Summary:
- Total customers and health distribution
- Month-over-month change
- At-risk ARR and count
- Retention forecast
Key Trends:
- Health score movement (improving or declining)
- Cohort analysis (recent customers healthier?)
- Segment patterns (which segments need focus?)
Focus Areas:
- Top 10 at-risk accounts (by ARR)
- Intervention success rates
- Expansion pipeline from healthy accounts
Actions Taken:
- Accounts rescued this month
- Interventions in progress
- Resource needs or issues
Recommendations:
- Product improvements needed (systemic issues)
- Process changes (what's not working)
- Resource allocation (where to invest)
Cadence: Monthly to exec team, Quarterly to board
Health Monitoring Challenges
Data Quality and Completeness
You'll run into three common data issues.
Incomplete data happens when not all systems are integrated, manual data entry is missing, or data updates are delayed.
Inaccurate data comes from incorrect tagging or categorization, stale data that hasn't been refreshed, or duplicate records.
Inconsistent data results from different definitions across systems, date format mismatches, and different ways of handling null values.
Here's how to solve them. For data validation, use automated checks for completeness, alert on missing critical data, and run regular audits. For data governance, create clear data definitions, establish standard tagging conventions, and track data quality metrics. For integration monitoring, track pipeline health, alert on integration failures, and implement automatic retry logic. For manual data entry, make it easy with simple forms, integrate it into workflows (like CSM activities in the CRM), and require critical fields like executive sponsor.
Scoring Model Accuracy
The challenge here is when your health score doesn't predict outcomes well.
You'll see symptoms like healthy accounts churning (false negatives), at-risk accounts renewing (false positives), and low confidence in scores overall.
The causes are usually wrong dimensions being weighted, thresholds that aren't calibrated, missing important signals, or overweighting less important data.
Fix it through validation analysis: correlate health scores with actual churn, identify false positives and negatives, and calculate predictive accuracy. Then refine the model by adjusting dimension weights, adding missing dimensions, removing noise from low-signal data, and recalibrating thresholds. Make continuous improvement a habit with quarterly model reviews, testing changes on historical data, A/B testing scoring variations, and documenting changes and their impact.
As an example, one company's original model had 70% predictive accuracy. They increased the usage weight and added an executive sponsor dimension. The revised model jumped to 84% predictive accuracy.
Alert Fatigue and Noise
The challenge is simple: too many alerts, and CSMs start ignoring them.
Symptoms include alerts not being acted upon, CSMs disabling notifications, and important alerts getting missed in the noise.
This happens when thresholds are too sensitive (generating too many alerts), alerts aren't prioritized (everything seems urgent), there are too many false positives (alerts that don't matter), or they're too frequent (alerting for minor changes).
Fix it through alert prioritization: use tiered alerts (critical, high, moderate), route them appropriately (immediate versus daily digest), and make the priority clear in notifications. Tune your thresholds by raising them if you're getting too many false positives, focusing on meaningful changes instead of noise, and testing on historical data. Consolidate alerts by grouping related ones (one notification per account, not five), using daily or weekly digests for non-critical items, and adding snooze functionality for alerts that are temporarily not relevant.
Track alert effectiveness by asking which alerts lead to action, which predict actual issues, and which get ignored. Remove or refine the ineffective ones.
Balancing Automation with Judgment
The challenge is over-reliance on scores, which misses important context.
The risk is blindly following scores and missing nuanced situations, ignoring CSM judgment when they know the customer best, or developing a false sense of security when a healthy score masks actual risk.
Here's the balance. Use health scores for prioritization (where to focus), early warning (flagging potential issues), trend identification (spotting patterns), and forecasting (portfolio level predictions). Use CSM judgment for context (why is the score what it is?), relationship quality (hard to quantify), strategic value (not just ARR), and intervention selection (what will actually work).
The combined approach works like this: scores guide where CSMs focus their attention, CSMs provide context and judgment to interpret the scores, CSMs can override scores with justification, and you document those overrides to learn from them.
Here's an example. An account has a health score of 85 (healthy), but the CSM assesses them as at risk. Why? A new competitor just launched (external threat), the executive champion left the company (relationship risk), and the score hasn't reflected this yet (it's a lagging indicator). The CSM manually flags the account as at-risk, intervenes proactively, and updates the health model to include champion departure as a signal going forward.
Continuous Model Improvement
Health monitoring is never "done." Customer behavior changes, products evolve, market dynamics shift, and models need ongoing refinement.
Build an improvement process with three levels of review.
Do a monthly review of alert effectiveness, false positive and negative rates, data quality issues, and CSM feedback.
Do a quarterly review that includes scoring model validation, correlation with outcomes, dimension weight adjustments, and threshold recalibration.
Do an annual review where you consider a full model overhaul if needed, add new dimensions, retire outdated signals, and benchmark against outcomes.
Create feedback loops by gathering CSM feedback on scores and alerts, tracking intervention outcomes, learning from churn post-mortems, and celebrating early saves when the model worked.
Advanced Health Monitoring
Machine Learning and AI
Machine learning goes beyond rule-based scoring. Traditional approaches say "if usage is less than X and engagement is less than Y, then the account is at-risk." ML learns patterns from historical data and predicts outcomes.
There are four main ML applications for health monitoring.
Churn prediction trains a model on historical churn data, identifies patterns that predict churn, scores accounts by churn probability, and is often more accurate than rule-based systems.
Expansion prediction predicts which accounts are likely to expand, identifies signals of expansion readiness, and helps prioritize expansion outreach.
Anomaly detection identifies unusual patterns like sudden usage drops, alerts on deviations from normal behavior, and catches issues earlier.
Recommendation engines suggest interventions based on similar accounts, essentially saying "accounts like this responded well to X."
You'll need sufficient historical data (2+ years), data science expertise, ML infrastructure, and ongoing model training and refinement to make this work.
Predictive Health Scoring
Traditional health describes the current state. Predictive health forecasts the future state.
Here's the difference. With traditional health, an account might have a current health score of 70 with a status of Moderate. With predictive health, that same account shows a current health of 70, but the predicted health in 90 days is 55 and the trend is declining. This lets you intervene now, before they actually reach at-risk status.
How does it work? You analyze historical health score trajectories, identify leading indicators of decline, predict future health based on current trends, and alert on predicted declines.
The value is clear: earlier intervention before the score actually drops, being proactive instead of reactive, and better outcomes because you have more time to fix issues.
Cohort Comparison and Benchmarking
Compare each account to similar accounts for better context.
Use segment benchmarks like industry average health score, company size benchmarks, use case patterns, and product plan or tier. Also compare across cohorts: onboarding cohort (how does this cohort perform?), tenure cohort (1-year customers versus 3-year), and ACV tier (enterprise versus mid-market).
This helps you contextualize scores (is 70 good or bad for this segment?), identify outliers (accounts doing much better or worse than peers), and set realistic targets based on segment norms.
Here's an example. Account A has a health score of 65 and the segment average is 58, they're above average for their segment and doing well. Account B also has a health score of 65, but the segment average is 78, they're below average and need attention.
Same score, different context, different action.
Correlation with Outcomes
Validate Health Score Predictive Power:
Retention Correlation:
- Analyze retention rate by health score range
- Calculate retention probability by score
- Identify threshold where retention drops
Example:
| Health Score | Retention Rate | Sample Size |
|---|---|---|
| 90-100 | 98% | 47 |
| 80-89 | 94% | 123 |
| 70-79 | 87% | 156 |
| 60-69 | 78% | 94 |
| 50-59 | 64% | 67 |
| <50 | 42% | 38 |
Insight: Clear correlation, score predicts retention well, threshold is 60
Expansion Correlation:
- Analyze expansion rate by health score
- Identify expansion-ready threshold
Value Correlation:
- Do high-health accounts report better outcomes?
- Do they have higher satisfaction?
Use Correlations To:
- Validate scoring model (does it predict outcomes?)
- Set thresholds (where does risk increase?)
- Prioritize improvements (focus on high-impact dimensions)
- Communicate value (show leadership score matters)
Model Validation and Refinement
Ongoing Validation:
Monthly:
- Review recent churn (were they flagged?)
- Check false positives (healthy accounts that churned)
- Check false negatives (at-risk accounts that renewed)
Quarterly:
- Calculate predictive accuracy
- Analyze dimension contributions
- Test weight adjustments
- Update thresholds
Annual:
- Full model validation
- Consider new dimensions
- Remove outdated signals
- Benchmark against best practices
Refinement Process:
Step 1: Identify Issues
- Low predictive accuracy
- Specific segment not predicted well
- New data sources available
Step 2: Hypothesize Improvements
- Adjust dimension weights
- Add new dimension
- Change thresholds
Step 3: Test on Historical Data
- Apply new model to past data
- Calculate accuracy
- Compare to current model
Step 4: Implement if Better
- Roll out improved model
- Document changes
- Monitor impact
Step 5: Learn and Iterate
- Track outcomes
- Refine further
- Share learnings with team
The Bottom Line
You can't fix what you can't see. Systematic health monitoring is essential for proactive customer success and retention.
Teams that implement comprehensive health monitoring see a 30-40% reduction in churn because early intervention works. They get 4-6 weeks earlier warning of at-risk accounts, identify 2-3x more expansion opportunities, allocate resources efficiently by focusing on what matters, and make data-driven decisions instead of relying on gut feel.
Teams without health monitoring, on the other hand, get surprised by churn they didn't see coming. They're stuck in reactive firefighting mode when it's too late to save accounts. They waste CSM effort by giving equal time to all accounts regardless of need. They miss opportunities because they don't know who's ready to expand. And they can't forecast effectively because they have no predictive data.
A comprehensive health monitoring framework includes five key components: multi-dimensional scoring based on usage, engagement, sentiment, and relationship; automated data integration with real-time or daily updates; actionable dashboards showing portfolio and account views; intelligent alerting that's prioritized and actionable; and continuous improvement through validation and refinement.
Build your early warning system. Monitor health systematically. Intervene proactively. Watch your retention improve.
Ready to build your health monitoring system? Start with retention fundamentals, implement health score models, and deploy early warning systems.
Learn more:

Senior Operations & Growth Strategist
On this page
- Customer Health Concept
- What Is Customer Health
- Health vs Satisfaction vs Loyalty
- Leading vs Lagging Health Indicators
- Account-Level vs User-Level Health
- Health Monitoring Framework
- Data Sources and Inputs
- Health Dimensions and Categories
- Scoring and Weighting Methodology
- Segmentation and Thresholds
- Trending and Momentum
- Health Data Sources
- Product Usage Analytics
- Engagement and Activity Data
- Support Tickets and Issues
- Sentiment and Feedback
- Relationship and Touchpoints
- Financial and Commercial Data
- Building Health Monitoring Systems
- Technology and Tooling Requirements
- Data Integration and Pipeline
- Calculation and Scoring Engine
- Dashboard and Visualization
- Alerting and Notifications
- Health Dashboards
- Executive Portfolio View
- CSM Account View
- Customer-Facing Health Reports
- Drill-Down and Analysis Capabilities
- Real-Time vs Batch Updates
- Using Health Data Operationally
- CSM Prioritization and Focus
- Account Review and Planning
- Risk Mitigation Interventions
- Opportunity Identification
- Executive Reporting and Governance
- Health Monitoring Challenges
- Data Quality and Completeness
- Scoring Model Accuracy
- Alert Fatigue and Noise
- Balancing Automation with Judgment
- Continuous Model Improvement
- Advanced Health Monitoring
- Machine Learning and AI
- Predictive Health Scoring
- Cohort Comparison and Benchmarking
- Correlation with Outcomes
- Model Validation and Refinement
- The Bottom Line