Farmer Segmentation and Targeting: How Agri-Input Reps Focus on the Farmers Who Drive Adoption
Turn this article into takeaways for your work.


Each assistant summarizes the article only for you and suggests best practices for your work.
A territory with 2,000 farmers and a rep with five working days per week creates a simple math problem that doesn't have a comfortable answer. Even with eight farmer contacts per day, which is a stretch when visits include a crop walk and a genuine advisory conversation, the rep can reach around 200 farmers in a month. That's 10% of the territory.
The question isn't how to visit more farmers. It's how to visit the right farmers: those whose adoption behavior ripples outward to influence 10, 20, or 50 of their neighbors. Get that selection right and the 10% you visit generates demand that the other 90% sees and acts on. Get it wrong and you're running demo plots in front of farmers who've never changed a purchasing decision in their lives, while the village's actual opinion leaders are buying your competitor's product from a dealer down the road.
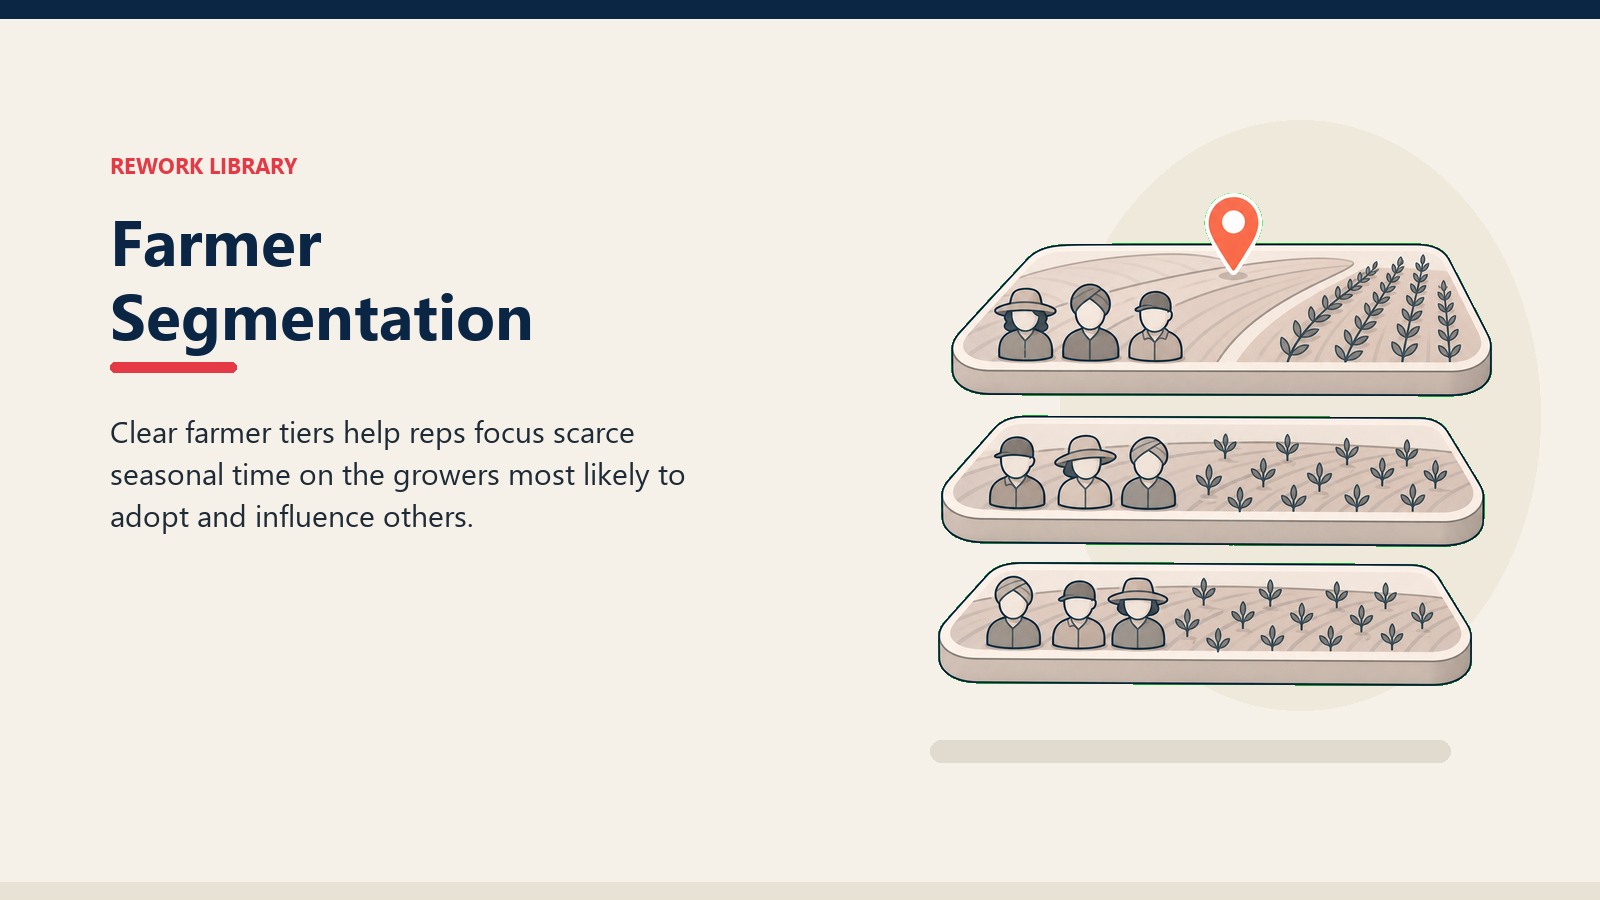
Farmer segmentation is the operational response to that math problem. It's how territory managers and agronomists structure their limited field time around the farmers who generate the highest adoption impact per visit.
Why Farmer Segmentation Differs from Dealer Segmentation
The logic of farmer segmentation runs through social networks, not just commercial transactions. Dealers are commercial partners whose tier position determines how much rep time and support investment they receive. Farmers are end consumers whose purchase decisions are shaped by their agronomic confidence, their peer relationships, and their access to timely advisory support.
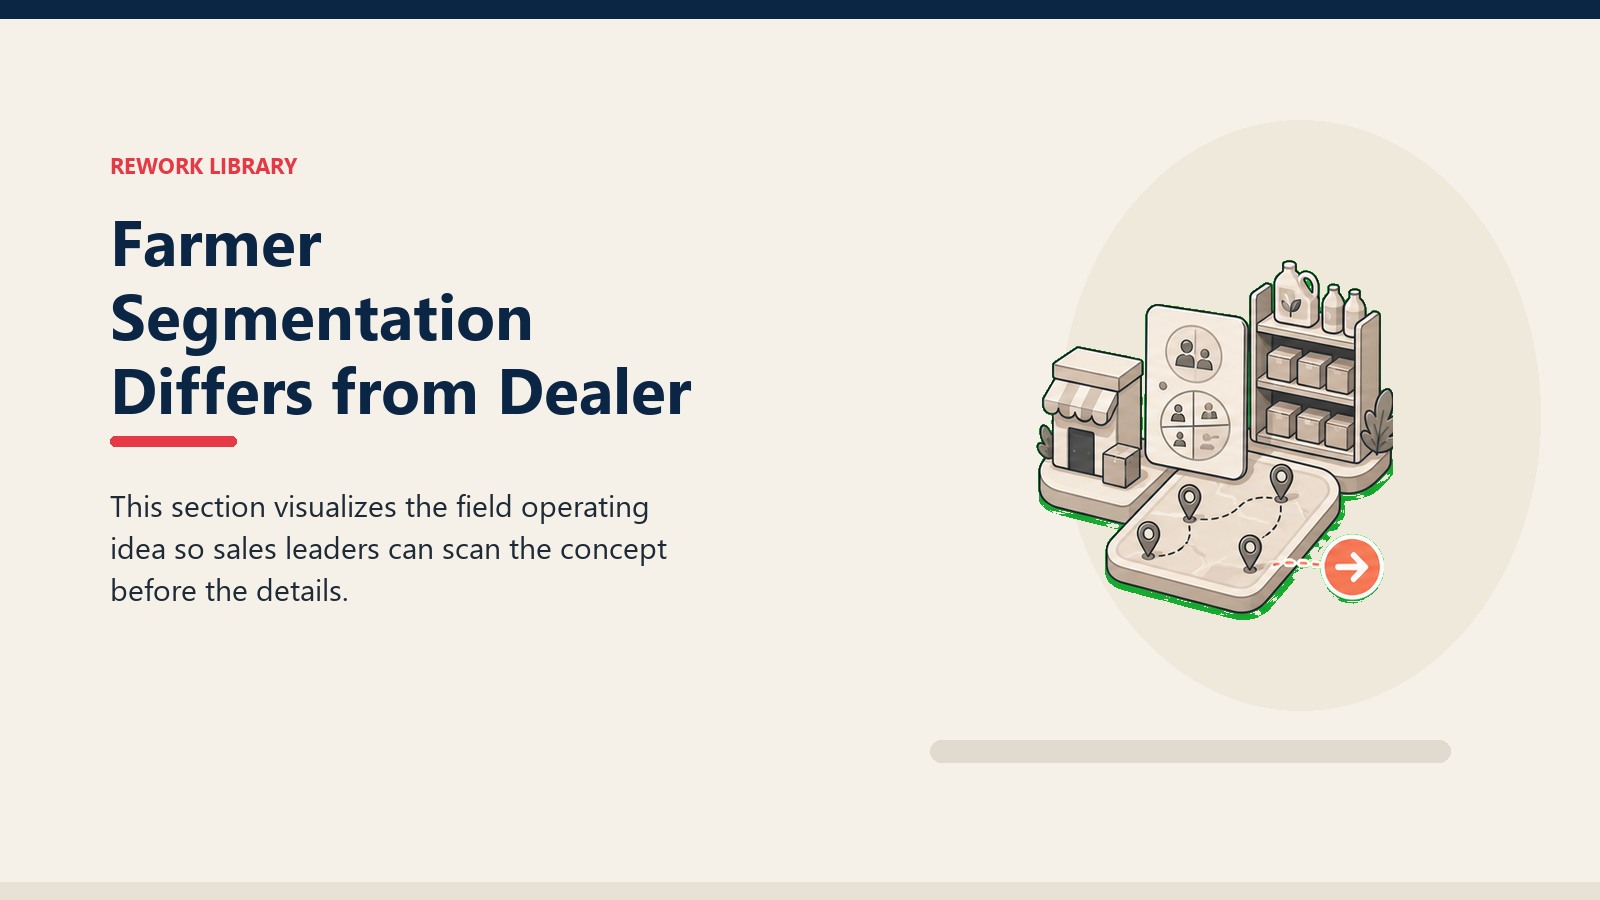
The difference that matters most commercially is the ripple effect. When you win a B-tier dealer to A-tier behavior, you get more offtake from that outlet. When you win a high-influence progressive farmer to your brand, you get potential adoption across her entire social cluster, which might be 30 farmers in the same village or across the three villages where her family has relationships.
That ripple effect means that one well-chosen farmer target, supported with genuine agronomic advisory and a visible demo plot, can generate more dealer pull-through than ten visits to randomly selected farmers. The multiplier is asymmetric, and targeting has to account for it. Research on social networks and extension services in PLoS One found that peer interaction and trust within farmer networks significantly improved technology adoption efficiency, while direct extension visits showed diminishing returns when not reinforced by social network spread. That's exactly why influence-network targeting amplifies advisory investments rather than replacing them.
Key Facts: Farmer Targeting and Influence Networks
- In a randomized controlled trial in Malawi, lead farmers trained in a new cultivation practice were 25.8 percentage points more likely to adopt in Year 1 compared to control farmers. In Year 2, adoption among non-lead neighboring farmers rose by 3.6 percentage points (a 95% relative increase from a base of 3.8%), showing that peer spillover, though smaller than direct training, compounds across seasons (J-PAL / Poverty Action Lab, Malawi lead farmer RCT).
- Neighbor learning effects have a more durable long-run impact on technology adoption than learning from extension agents, whose effect tends to diminish over time. A panel study tracking farmers in Ethiopia from 1999 to 2009 found that neighbor-to-neighbor knowledge transfer persisted and compounded while extension impact did not (Krishnan and Patnam, American Journal of Agricultural Economics, 2014, Vol. 96(1), pp. 308-327).
- Access to a demo plot increased the probability of purchasing improved inputs by 13 to 17 percentage points in a study of 800+ smallholder households in Tanzania, with the effect strongest when inputs were available within 5 km of the plot (Sseguya et al., PLOS ONE, 2021, doi:10.1371/journal.pone.0243896).
What Dimensions Should You Use to Segment Farmers?
Farmer segmentation works across five dimensions. No single dimension is sufficient on its own; the combination is what lets you identify farmers who are both likely to adopt and positioned to influence.
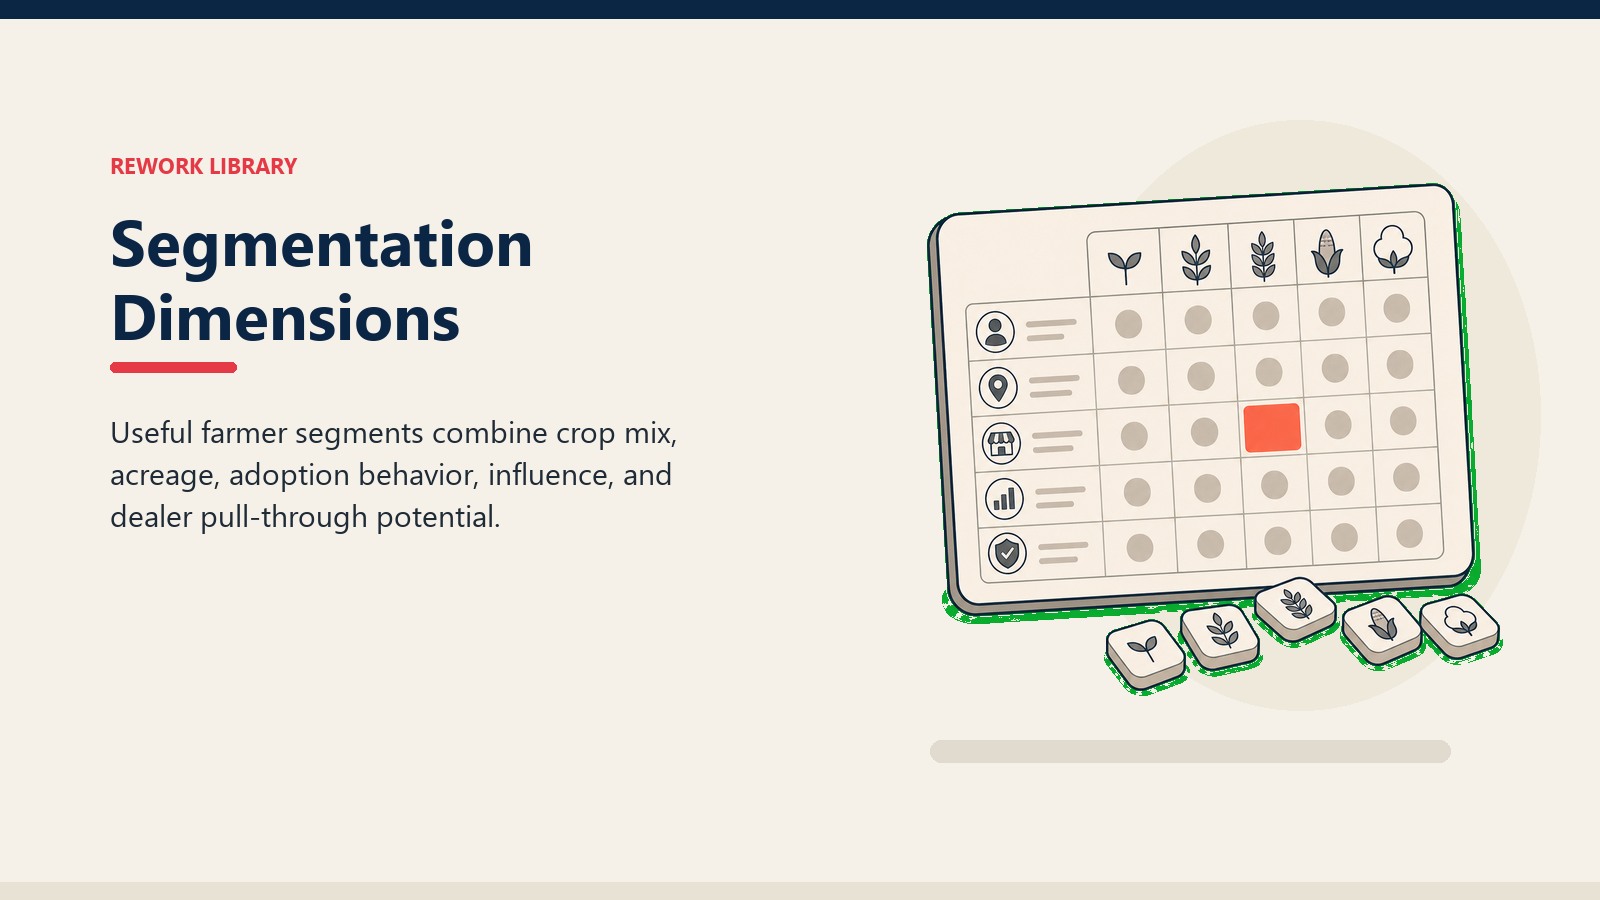
1. Landholding size and crop area. Larger landholdings command more attention from neighbors because the visible results of any input decision appear at scale. A 15-acre cotton farmer who tries your fungicide and sees a 20% yield improvement is visible to every farmer who drives past his field. A 0.5-acre subsistence farmer who sees the same percentage improvement is invisible. Target farmers with enough land to create a visible proof point, not necessarily the very largest holdings, but above the visibility threshold for their village.
2. Crop mix and rotation pattern. Align targeting to your product's crop fit. A seed company targeting farmers for a new paddy variety needs to identify farmers who grow irrigated paddy, not those whose crop mix is dryland groundnut and millet. This sounds obvious but gets misapplied constantly when rep coverage runs on geographic habit rather than agronomic fit. A crop map by farmer, updated at the start of each season, prevents targeting mismatch.
3. Progressive versus traditional agronomic practice. Progressive farmers actively seek new inputs, attend field days, read extension materials, and ask dealers for product information. Traditional farmers replicate what they've grown for 20 years without modification. Both groups are commercial targets eventually, but progressive farmers convert within a season; traditional farmers convert once progressive neighbors demonstrate results across two or three crop cycles. Sequence targeting accordingly. FAO's review of smallholder adoption research found that promotional campaigns paired with access to capital are the two highest-leverage factors in converting interest into adoption, which maps directly to prioritizing farmers who already have progressive practice plus credit access.
4. Access to credit and institutional finance. A farmer who wants to adopt a premium input but doesn't have access to seasonal credit will defer the decision, regardless of how persuaded they are by the agronomic case. Identify farmers who access formal credit (bank Kisan Credit Cards, microfinance, input-company credit programs) or have sufficient own-funds for upfront input purchase. Without that financial access, adoption intent doesn't convert to sales.
5. Social influence in the village. This is the dimension that amplifies all the others. A farmer with strong kinship and agricultural peer networks in their village or across villages is an influence node. Identifying them is the highest-impact targeting decision the rep makes each season.
Quotable Nuggets
"The rep who visits the right 20% of farmers, at the right crop stages, with the right agronomic conversation, doesn't just sell more product in that season. She builds a self-sustaining adoption network that sells the next season without her being present for every transaction." Rework Agri-Inputs Growth Library
"Neighbor learning effects have a more durable long-run impact on technology adoption than learning from extension agents." Krishnan and Patnam, American Journal of Agricultural Economics, 2014. This is why progressive farmer targeting compounds over multiple seasons in ways that purely rep-led coverage does not.
"Promotional campaigns paired with access to capital are the two highest-leverage factors in converting interest into adoption among smallholder farmers." FAO Investment Centre review of smallholder technology adoption research (fao.org/investment-centre).
The Five-Dimension Farmer Scoring Model: The five targeting criteria used in this framework: (1) Landholding size and crop-area visibility; (2) Crop mix and agronomic fit; (3) Progressive vs. traditional practice orientation; (4) Credit and capital access; (5) Social influence radius across villages. These map directly to a weighted scoring system. Assign points to each dimension, set tier thresholds (Tier 1: 80%+ of maximum score; Tier 2: 50-79%; Tier 3 and 4: below 50%), and use the composite score to allocate demo-plot budget and agronomist visit time. The same logic governs B2B lead scoring; the seasonal compression of the agri-input decision cycle is the main structural difference.
Progressive Farmer Identification
Progressive farmers don't self-identify by filling out a survey. You find them through four channels, used in combination.
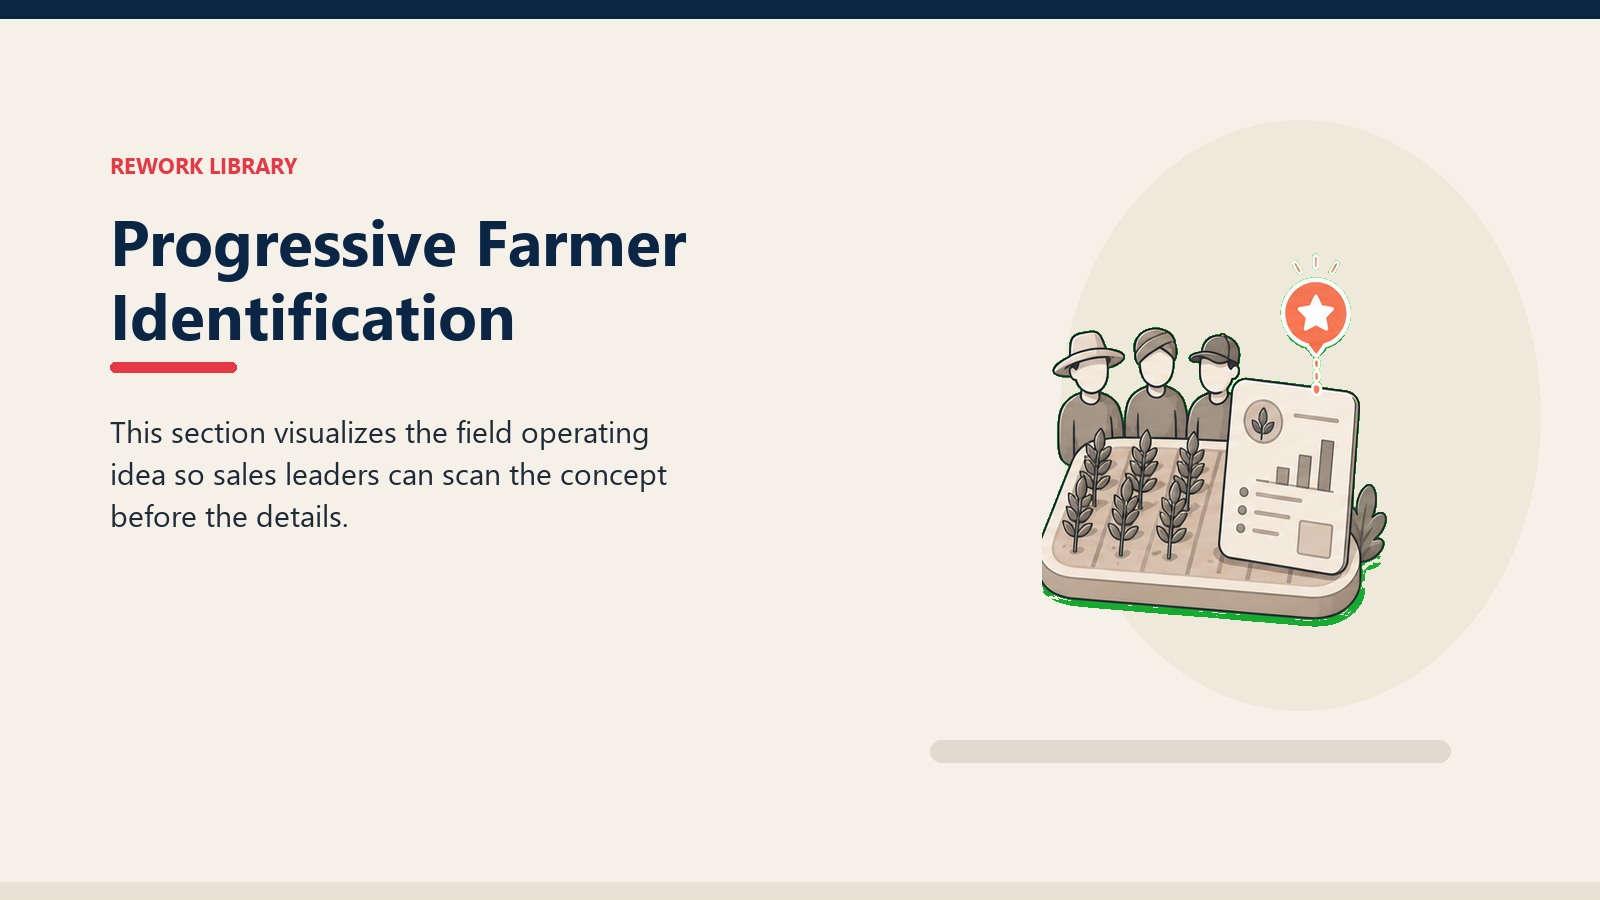
Village-level interviews. When a rep enters a new village, the most efficient identification method is a structured conversation with the sarpanch (village head), the local agricultural extension officer, or a trusted existing dealer. The question is simple: "Who in this village do farmers consult when they want to try something new? Who do they watch to see if it works before they change their own practice?" Names surface quickly. Four to six farmers typically account for most of the influential opinion-setting in a village of 200 to 400 farming households.
Dealer referrals. Dealers know which farmers ask the most questions about new products, which ones request trial packs before buying at volume, and which ones come back after a season and report results. Structured dealer conversations during the rep visit cycle, specifically asking for this information, produce a consistently reliable referral list. A dealer who's been in a village for 15 years can identify the progressive farmers in her catchment in a 5-minute conversation.
Crop-inspection visits. During farm walks, a rep can observe agronomic practice directly. Fields that are better managed than the surrounding plots (better plant spacing, correct irrigation management, visible fertilizer band-placement rather than broadcast), or that show evidence of prior input experimentation (trial plots visible, multiple varieties present), signal a progressive operator. The visit that starts as a product advisory call becomes a segmentation data point.
Historical product trial data. If your company has run demo plots or field trials in the territory in prior seasons, the farmers who participated are already identified as early adopters. CRM data from prior seasons, if it captures farmer-level interactions, is a starting-point list for progressive farmer identification that requires verification and updating rather than building from scratch.
Influence-Network Mapping
Identifying a progressive farmer is the first step. Understanding the reach of her influence is what lets you prioritize between progressive farmers when you have more candidates than you have demo-plot slots or agronomist visit capacity.
Influence in a farming village runs through three channels: family networks, geographic proximity, and technical credibility. A farmer who is both a senior family member in an extended clan, whose fields neighbors walk past daily, and who has a reputation for consistent above-average yields has overlapping influence channels that compound her reach.
Map influence clusters by asking the dealer and the progressive farmer herself two questions: "Who do your neighboring farmers come to before they make a major input decision?" and "When you changed a practice recently, which other farmers asked you about it and eventually tried the same thing?" The answers create a network diagram: the target farmer at the center, with a cluster of influenced farmers in the surrounding nodes.
For a territory with limited agronomist visit capacity, prioritize farmers whose influence network is largest and whose social ties cross village boundaries. A farmer whose influence extends into two adjacent villages is worth more than one whose influence is contained within a single hamlet.
Document influence clusters in the CRM as farmer groups, not just individual records. When a demo plot is allocated near Farmer A in Village X, the expected pull-through calculation should include the cluster of 15 to 25 farmers who will walk that field and ask questions at the dealer counter. That's the ROI unit for demo-plot investment, not the single farmer where the plot sits.
Farmer Tiering Matrix
| Tier | Criteria | Rep/Agronomist Action |
|---|---|---|
| Tier 1: Progressive Influencer | Large landholding (relative to village), cross-village influence network, early adopter history, formal credit access, multi-crop operator | Priority demo-plot placement; monthly agronomist advisory visits; invitation to farmer field days as presenter; personal rep relationship managed at territory manager level |
| Tier 2: Progressive Buyer | Progressive practice, adequate landholding for visibility, local influence only, strong purchase history | Demo-plot near their fields; quarterly agronomist visit; farmer field day attendance encouraged; standard rep relationship |
| Tier 3: Adoptable Traditional | Traditional practice but financially sound and open to advice; buys established categories regularly | Peer influence from Tier 1 before direct targeting; one agronomist visit per season at crop-critical moment; dealer advisory as primary touchpoint |
| Tier 4: Late Majority | Minimal landholding, traditional practice, peer-dependent decision, credit-constrained | No direct agronomist resource; relies on dealer advisory and visible crop results from Tier 1 and 2 farmers; eventual pull-through targeted |
Most territories have Tier 1 farmers in the range of 3% to 8% of the farmer population. That's the group that deserves direct agronomist engagement and demo-plot proximity. Tier 2 is typically 15% to 25%. Together, active management of 20% to 30% of the farmer population, using influence network logic, generates pull-through that reaches the remaining 70% to 80% through peer channels.
How Does Crop Stage Timing Change Your Targeting Priorities?
Visiting a farmer to discuss a seed variety after she's already purchased seed for the season is commercially worthless. The timing dimension of farmer targeting is as important as the selection dimension.
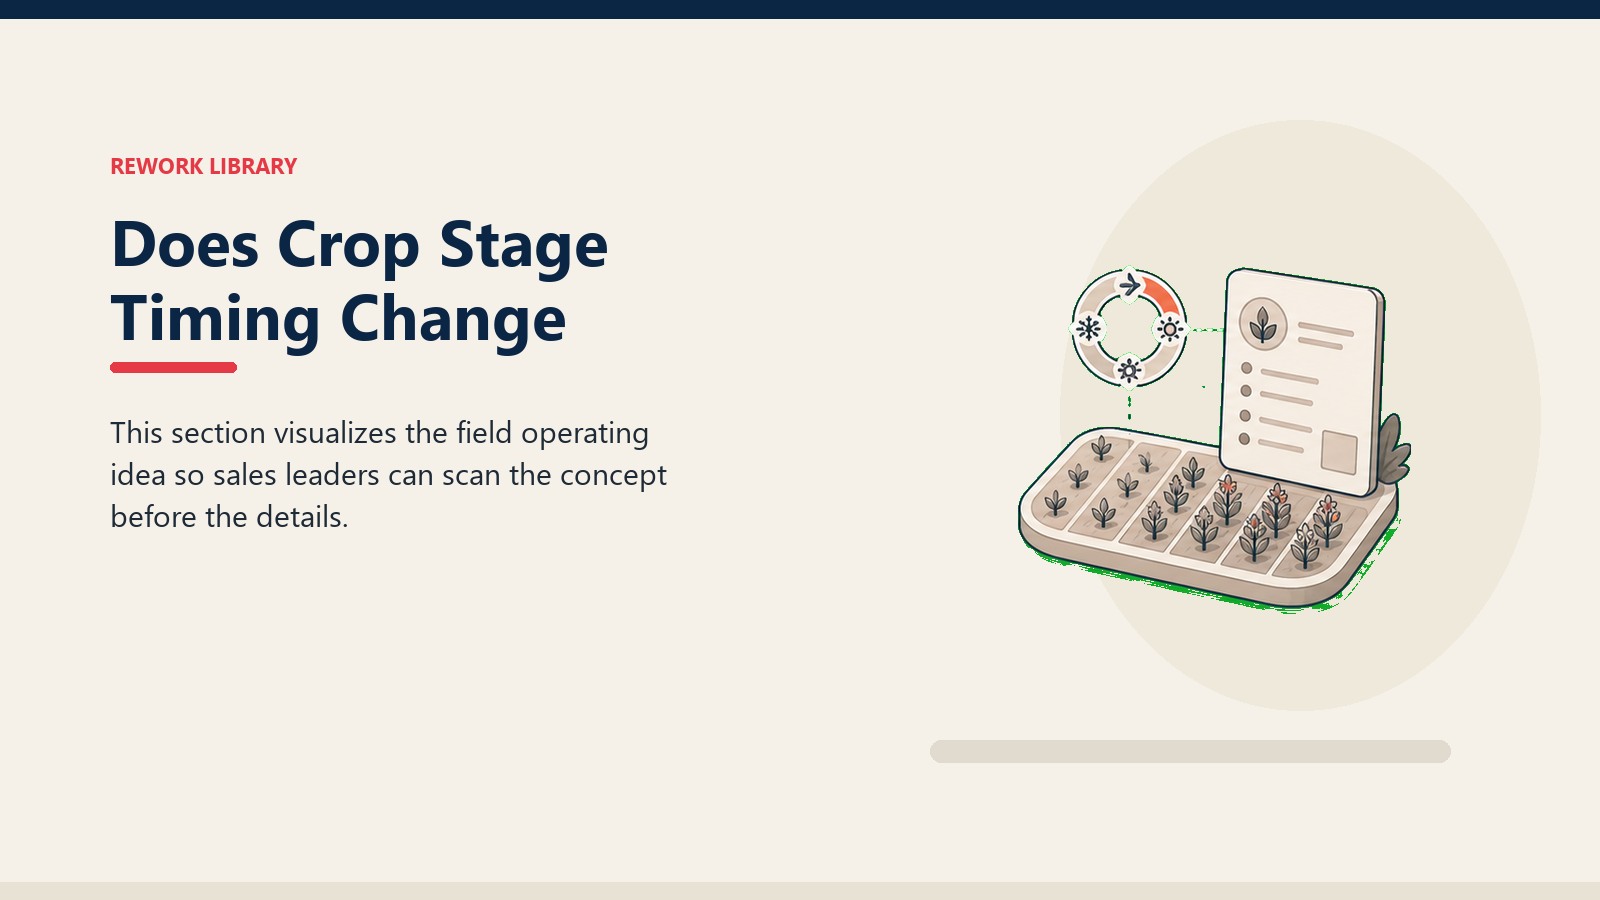
Map your key product categories to the crop calendar and identify the decision window: the period when the farmer is actively making purchase decisions and open to advisory input. For most agri-input categories, this window is two to four weeks wide.
Seeds: Purchase decision typically happens four to eight weeks before sowing date, when seed availability at dealers is highest and the farmer has time to compare varieties. An agronomist visit or farmer meeting six to eight weeks before sowing is the high-value window.
Basal fertilizers: Purchase decision happens within two weeks of land preparation, which in kharif markets typically falls in May and June ahead of monsoon onset. Rep and agronomist visits to Tier 1 farmers should be concentrated in April and May to shape basal nutrition decisions.
Crop-protection products: Purchase decision is triggered by pest or disease pressure observation and is often compressed into 48 to 72 hours. This category requires a different engagement model: proactive scouting visits during crop growth stages where pressure is historically highest, so the farmer has the recommendation ready when she needs it.
Micronutrients and plant growth regulators: Purchase is most likely if the farmer has seen the crop-quality improvement in a trial. Position micronutrient discussions after the farmer has observed a visible deficiency symptom or after the rep can point to a visible response in a nearby demo plot.
A seasonal call plan that puts agronomist visits at the right crop stage for Tier 1 and Tier 2 farmers in each product category is the operational output of this targeting logic. The visit schedule isn't fixed by day of week or distance; it's fixed by crop calendar and product-decision timing.
Building a Seasonal Call Plan Around Farmer Tiers
The seasonal call plan translates the tiering matrix and the crop-calendar targeting into a visit schedule that an agronomist and a field rep can actually execute.
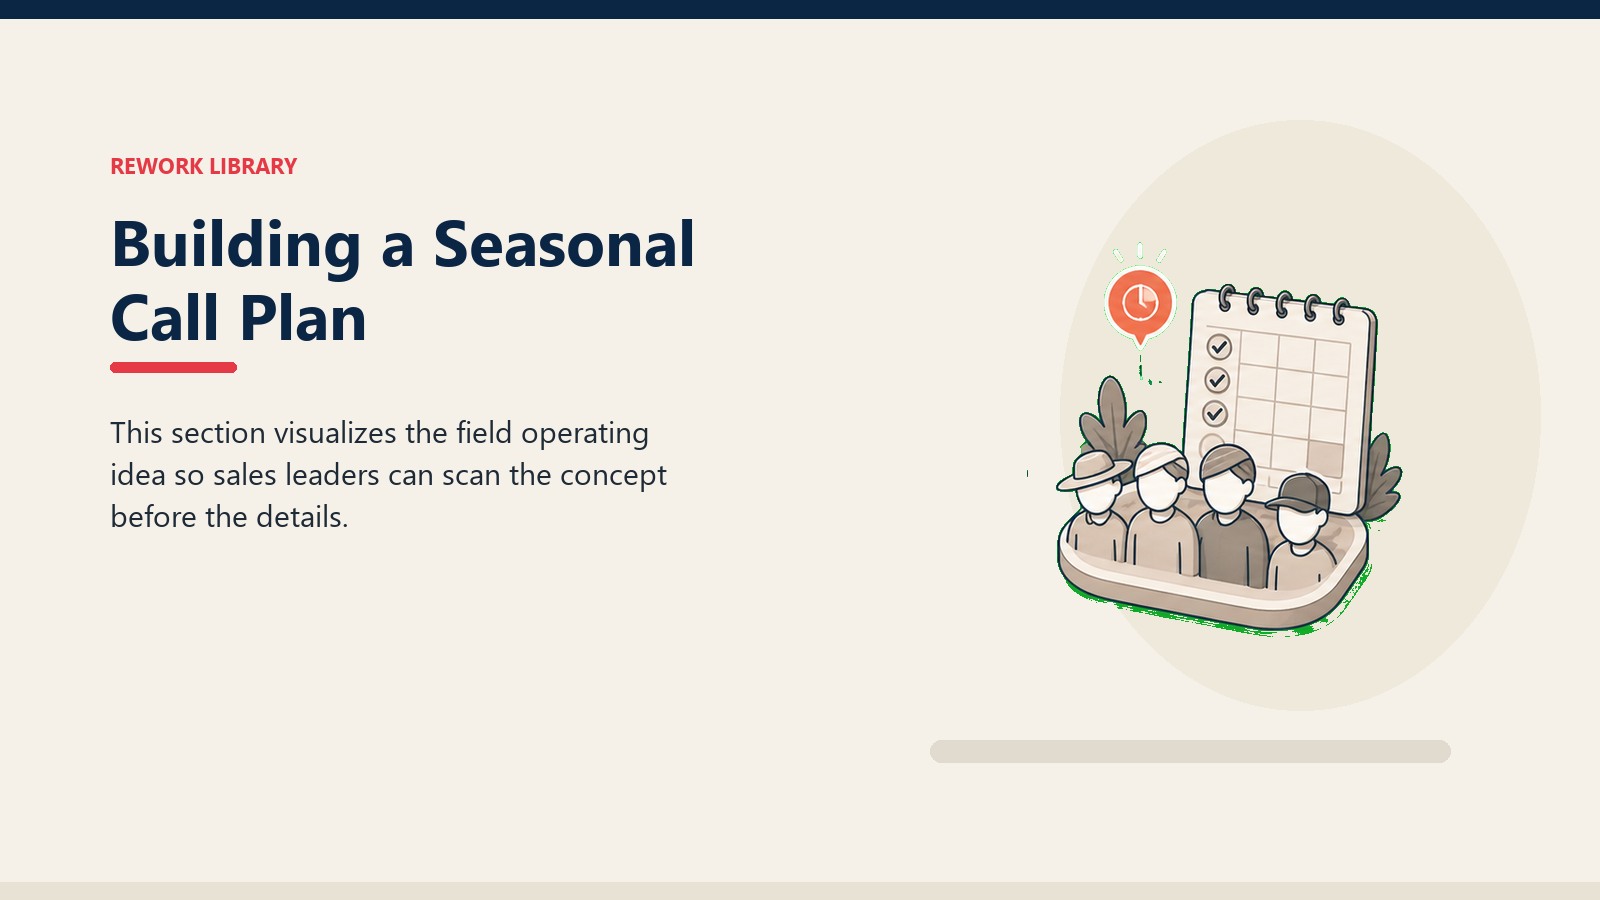
| Month (Kharif Example) | Crop Stage | Tier 1 Farmer Action | Tier 2 Farmer Action | Dealer Connection |
|---|---|---|---|---|
| April-May | Pre-sowing land prep | Agronomist advisory visit on basal nutrition | Invite to field day | Confirm dealer stock of basal fertilizers |
| June | Sowing | Seed performance discussion; confirm demo-plot setup | Dealer referral for seed advisory | Confirm seed range at counter |
| July | Early crop growth | Micronutrient scouting visit | Share Tier 1 crop progress update via dealer | Flag crop-protection inventory requirements |
| August | Mid-season | Crop-protection scouting, fungicide/insecticide timing advisory | Co-attend farmer advisory meeting | Support dealer advisory on pest alerts |
| September-October | Late season / harvest | Yield assessment, next-season pre-booking | Yield comparison discussion | Confirm farmer feedback reaches dealer |
| November (Rabi prep) | Pre-rabi | Rabi seed and nutrition planning | Farmer meeting: rabi inputs | Confirm rabi stocking commitment with dealer |
Beat routes for Tier 1 and Tier 2 farmers don't run on a fixed day of the week; they run on the crop calendar. An agronomist who visits a Tier 1 farmer weekly during the pre-sowing period and then drops to monthly during mid-season is allocating correctly for crop-stage criticality. A fixed-weekly visit regardless of crop stage is activity, not strategy.
Linking Farmer Targets to Dealer Pull-Through
Farmer targeting has no commercial value if it doesn't connect to dealer offtake. The link is pull-through: farmers who've been advised by your agronomist, attended your field days, or walked your demo plots go to the dealer counter asking for your product by name. That named demand is the commercial return on farmer-targeting investment.
Track the conversion from farmer advisory to dealer purchase at the outlet level. After a farmer meeting in a Tier 1 farmer's village, the nearby dealer should see an uptick in inquiries and purchases for the relevant product within two to four weeks. If that uptick doesn't appear, something in the advisory-to-purchase chain is broken: either the farmer didn't find the product at the dealer counter (a stocking problem), the dealer wasn't prepared to recommend it (a support problem), or the advisory didn't connect with the farmer's actual crop need (a targeting problem).
Measure this linkage explicitly. The farmer field visit and advisory selling framework covers how to structure the advisory conversation itself. The farmer meetings and field days program provides the group event format that amplifies individual advisory impact. But both of those investments only pay off if they're followed by dealer conversations that capture the demand those activities generate.
The connection works in reverse too. Dealers who receive regular rep visits and who trust the advisory quality of your agronomist are more likely to proactively recommend your brand to farmers who come in with a crop problem. That organic dealer recommendation, triggered by confidence in your technical support rather than by a promotional incentive, is the pull-through model at its most sustainable.
Precision Targeting and the ICP Connection
Farmer segmentation is the field-level application of ideal customer profile thinking. The ICP in B2B sales defines which prospect fits your solution best, converts fastest, and generates the highest lifetime value. The farmer-tier matrix defines which farmer adopts fastest, influences most, and generates the most sustainable pull-through across seasons.
The scoring mechanics are identical. Assign weighted criteria (landholding, crop fit, influence radius, credit access, progressive practice), set tier thresholds, and use the resulting tier assignment to drive resource allocation. The lead scoring systems framework maps directly to farmer scoring: define the criteria, weight them by commercial relevance, and use the composite score to allocate agronomist time and demo-plot budget the way a B2B team allocates sales development rep time and marketing budget.
The seasonal nature of agri-inputs compresses the timeline. A B2B prospect can stay in nurture for six months. A farmer who doesn't get the right advisory conversation before the sowing window closes has missed the season entirely. That compression is why customer segmentation principles need to be front-loaded into the pre-season planning cycle rather than applied reactively.
Conclusion: Precision Targeting Compounds Into Market Share
Farmer segmentation doesn't produce results in a single crop cycle. The return accumulates as progressive farmers' visible success influences their neighbors, as Tier 1 farmers become visible advocates at dealer counters and farmer meetings, and as the brand builds a reputation in each village for being the one that works and whose rep actually shows up before the problem gets worse.
The rep who visits the right 20% of farmers, at the right crop stages, with the right agronomic conversation, doesn't just sell more product in that season. She builds a self-sustaining adoption network that sells the next season without her being present for every transaction.
That compounding return is why the targeting decision is the most consequential one a territory manager makes before the season starts. Choose well, and the advantage works in your favor all year.
Frequently Asked Questions about Farmer Segmentation and Targeting
How do I identify progressive farmers in a new territory with no prior data?
Start with three sources in parallel: the local dealer's referrals (ask specifically who farmers consult before changing a practice), the agricultural extension officer's records of farmers who've participated in government demonstration programs, and your own observation during initial farm walks. In a new territory, the first season's data collection is itself a segmentation exercise. Log farmer-level CRM records from every interaction, even early ones, and use those records to build your tier classification by the start of the second season.
What's the right ratio of Tier 1 to Tier 2 farmers for demo-plot allocation?
Put 60% to 70% of your demo-plot budget in Tier 1 farmer villages, 30% to 40% in Tier 2 farmer villages. Tier 1 farmers generate cross-village influence that amplifies the demo-plot investment beyond the immediate location. Tier 2 farmers generate local pull-through at the nearest dealer. Both matter; the weighting reflects the difference in reach.
How does farmer segmentation interact with the beat-route structure?
The farmer-tier call plan sits inside the beat-route structure but doesn't follow the same fixed schedule. Tier 1 and 2 farmers receive visits at crop-critical moments defined by the crop calendar, not on a fixed weekly cycle. The beat route ensures the rep is physically in the right geography; the tier plan determines which farms get the agronomist visit within that geography that day.
Can I apply farmer segmentation to smallholder markets where most farmers have under 2 acres?
Yes, with adjusted criteria. In fragmented smallholder markets, landholding size is less discriminating because most farmers operate at similar scale. Weight social influence and progressive practice more heavily instead. In these markets, influence networks tend to be stronger because farmers rely more heavily on peer information when they can't afford to experiment independently. A 1.5-acre farmer who's respected in her village and whose cousin farms in three neighboring villages can have more influence than a 10-acre operator who's an outlier in that geography.
How long does it take for progressive farmer influence to generate pull-through at the dealer counter?
Faster than most field teams expect, but not immediately. The J-PAL lead farmer RCT in Malawi found Year 1 spillover adoption of 3.6 percentage points among non-trained neighbors: meaningful but not dramatic in a single season. The compounding effect shows up in Year 2 and beyond, which is why progressive farmer investment has to be treated as a multi-season commitment rather than a single-cycle activation. At the dealer level, measurable uptick in product inquiries typically appears within four to six weeks of a well-attended demo-plot event or harvest field day near a Tier 1 farmer's field. Track dealer inquiry volume by village in the weeks after every activation event to build a territory-level evidence base for this timeline.
Learn More

Senior Implementation Consultant
On this page
- Why Farmer Segmentation Differs from Dealer Segmentation
- What Dimensions Should You Use to Segment Farmers?
- Quotable Nuggets
- Progressive Farmer Identification
- Influence-Network Mapping
- Farmer Tiering Matrix
- How Does Crop Stage Timing Change Your Targeting Priorities?
- Building a Seasonal Call Plan Around Farmer Tiers
- Linking Farmer Targets to Dealer Pull-Through
- Precision Targeting and the ICP Connection
- Conclusion: Precision Targeting Compounds Into Market Share
- Learn More