Pipeline Coverage Ratio: How Much Pipeline Do You Need?
Pipeline coverage ratio compares open pipeline to the revenue target for a period.
If the team has $3M in pipeline against a $1M target, coverage is 3x. That sounds simple, but the operating interpretation is not.
Three times coverage in early-stage, stale, low-fit pipeline is not the same as three times coverage in qualified late-stage opportunities.
McKinsey's B2B growth research is relevant because growth planning depends on commercial productivity and reliable pipeline. Gartner's forecast confidence research also shows why pipeline metrics need quality context before they are used in planning.
Key operating facts
- Pipeline coverage ratio is useful only when interpreted by close period, stage quality, source, segment, sales cycle, and historical conversion.
- There is no universal "right" coverage ratio. A team with high win rate and short cycles needs less coverage than a team with long cycles and weak conversion.
- Coverage should be paired with pipeline inspection, forecast confidence, and stage aging before it informs hiring or spending decisions.
- Aggregate coverage can hide risk. Segment-level and period-level coverage are usually more useful than one company-wide number.
Formula
Pipeline coverage ratio = open pipeline for the period / revenue target for the period
RevOps should segment the ratio by:
- Stage
- Segment
- Source
- Sales motion
- Rep or team
- Close period
- New business vs expansion
How to interpret it
| Signal | Meaning |
|---|---|
| High coverage, low win rate | Pipeline quality may be weak |
| Low coverage, high win rate | Demand or pipeline creation may be insufficient |
| High coverage, high stage aging | Pipeline may be inflated |
| Good coverage in wrong segment | Plan risk is hidden by aggregate view |
Pair coverage with Pipeline Velocity and Forecast Accuracy.
Coverage quality model
Coverage should be scored by quality, not only amount.
Turn this article into takeaways for your work.
Each assistant summarizes the article only for you and suggests best practices for your work.
| Quality factor | Question |
|---|---|
| Stage mix | Is coverage concentrated in stages that historically convert? |
| Close period | Is the pipeline expected to close in the target period? |
| Source quality | Do sources convert to closed-won at expected rates? |
| Segment fit | Does coverage match the plan by segment or market? |
| Stage aging | Are opportunities moving or sitting stale? |
| Forecast category | How much coverage is commit, best case, or early pipeline? |
This model protects planning from false confidence. A team can show strong coverage while most opportunities are early, old, or outside the period. RevOps should make those caveats visible before leaders treat coverage as plan confidence.
Coverage formula
Basic formula:
Pipeline coverage = open pipeline expected for the period / revenue target for the period
But RevOps should define:
- Which opportunities count
- Which stages count
- Which close dates count
- Whether renewals are included
- Whether expansion is included
- Whether amount is weighted
- Whether stale deals are excluded
Without those rules, teams will calculate different coverage numbers.
Coverage by stage
Stage quality matters.
| Coverage type | Interpretation |
|---|---|
| Early-stage coverage | Future potential, lower confidence |
| Mid-stage coverage | Active opportunity base |
| Late-stage coverage | Near-term forecast relevance |
| Commit coverage | Closest to forecast confidence |
A 4x coverage number with most pipeline in early stage may still be risky for the current quarter.
Coverage by segment
Coverage should be segmented.
For example:
- Enterprise may need lower count but higher deal value.
- SMB may need higher volume and faster conversion.
- Partner channel may need longer cycle assumptions.
- Expansion coverage may depend on renewal timing.
Aggregate coverage can hide plan risk.
Coverage and win rate
Coverage targets should come from win rate and sales cycle history.
If win rate is 25 percent, a simple model may suggest 4x coverage. But that only works if the pipeline is comparable to historical pipeline. If pipeline quality drops, 4x may not be enough. If stage criteria tighten, lower coverage may still be healthier.
RevOps should pair coverage with win rate, stage aging, and source quality.
Coverage and timing
Pipeline must be in the right period.
Pipeline closing next quarter does not solve this quarter's target. Pipeline with close dates clustered at quarter end may carry risk. Pipeline with repeated date pushes may be overstated.
Track coverage by close period and close-date movement.
Dashboard design
A useful coverage dashboard shows:
- Total coverage
- Coverage by stage
- Coverage by segment
- Coverage by source
- Coverage by close period
- Stage aging
- Win rate
- Forecast category
- Stale pipeline caveats
Do not show one coverage number without quality context.
Common mistakes
Using generic 3x target. History and motion matter.
Counting all open pipeline. Weak stages inflate coverage.
Ignoring close period. Future pipeline hides current risk.
Ignoring segment mix. Coverage in the wrong segment does not solve the plan.
Ignoring expansion and renewal. Customer revenue may need separate coverage logic.
Readiness checklist
Before using coverage in planning:
- Formula is documented.
- Included stages are defined.
- Stale pipeline is visible.
- Segment cuts are shown.
- Win rate context is included.
- Finance understands assumptions.
- Sales owns pipeline creation actions.
Coverage is useful when it tells leaders whether the plan has enough real pipeline, not just enough nominal value.
Example coverage analysis
Suppose the team has 4x coverage.
RevOps should ask:
- How much is late-stage?
- How much is stale?
- How much is in the target segment?
- How much came from reliable sources?
- How much has close dates in the period?
- How much has strong win-rate history?
If only 1x is late-stage and current, the headline number is misleading.
Coverage targets
Coverage targets should be based on:
- Historical win rate
- Stage conversion
- Sales cycle
- Segment
- Deal size
- Source quality
- Rep ramp
- Seasonality
A universal 3x or 4x target can be directionally useful, but RevOps should build internal targets from historical data.
Coverage by period
Track:
- Current-quarter coverage
- Next-quarter coverage
- Rolling 90-day coverage
- Coverage by month
- Coverage by close-date confidence
This helps leaders see whether pipeline creation is early enough.
Coverage and sales capacity
Low coverage may not only be a demand issue. It may be a capacity issue.
If rep ramp is slow, territory coverage is uneven, or pipeline creation capacity is low, coverage can fall even when demand programs are working. Pair coverage with Sales Capacity Planning.
Coverage and pipeline inspection
Coverage must be inspected.
Pipeline inspection should remove or flag:
- Stale deals
- Deals with no next step
- Deals outside target period
- Deals in wrong stage
- Duplicate opportunities
- Weak source or fit
Otherwise coverage becomes inflated.
Finance partnership
Finance should understand coverage assumptions.
If the plan assumes 4x coverage and 25 percent win rate, RevOps should show whether the current pipeline matches the historical mix. If pipeline quality changes, planning assumptions should change too.
Common scenarios
High coverage and low forecast confidence usually means quality is weak.
Low coverage and high win rate may mean the team needs more demand or sales capacity.
Coverage concentrated in one segment may hide risk in another.
Expansion coverage should be separated from new business when renewal timing affects close probability.
What the scenario teaches
Pipeline coverage is a planning signal, not a comfort number. It should trigger questions about quality, timing, source, segment, capacity, and forecast confidence.
Pipeline coverage maturity model
Pipeline coverage improves as the company moves from simple volume reporting to quality-adjusted planning.
| Stage | Behavior |
|---|---|
| Basic | One coverage number for the whole company |
| Segmented | Coverage by segment, source, owner, and period |
| Quality-aware | Stage age, stale deals, and source quality visible |
| Planning-linked | Coverage targets tied to win rate and capacity |
| Predictive | Coverage trends used to adjust hiring, demand, and forecast risk |
The basic number is still useful, but it should not be the final answer. A single number can start the conversation. It should not end it.
Example target model
Suppose a team has a $1M quarterly new-business target, a 25 percent win rate, and a 90-day sales cycle. A simple model suggests the team needs about $4M of qualified pipeline early enough in the quarter to support the target.
Now change the assumptions:
- If win rate falls to 20 percent, the team needs about $5M.
- If sales cycle lengthens, the team needs pipeline earlier.
- If half the pipeline is stale, nominal coverage is overstated.
- If most pipeline sits in one segment, another segment may miss plan.
- If new reps own much of the pipeline, productivity risk rises.
This is why RevOps should not copy generic coverage targets. Internal history matters.
Weighted and unweighted coverage
Teams often ask whether coverage should be weighted.
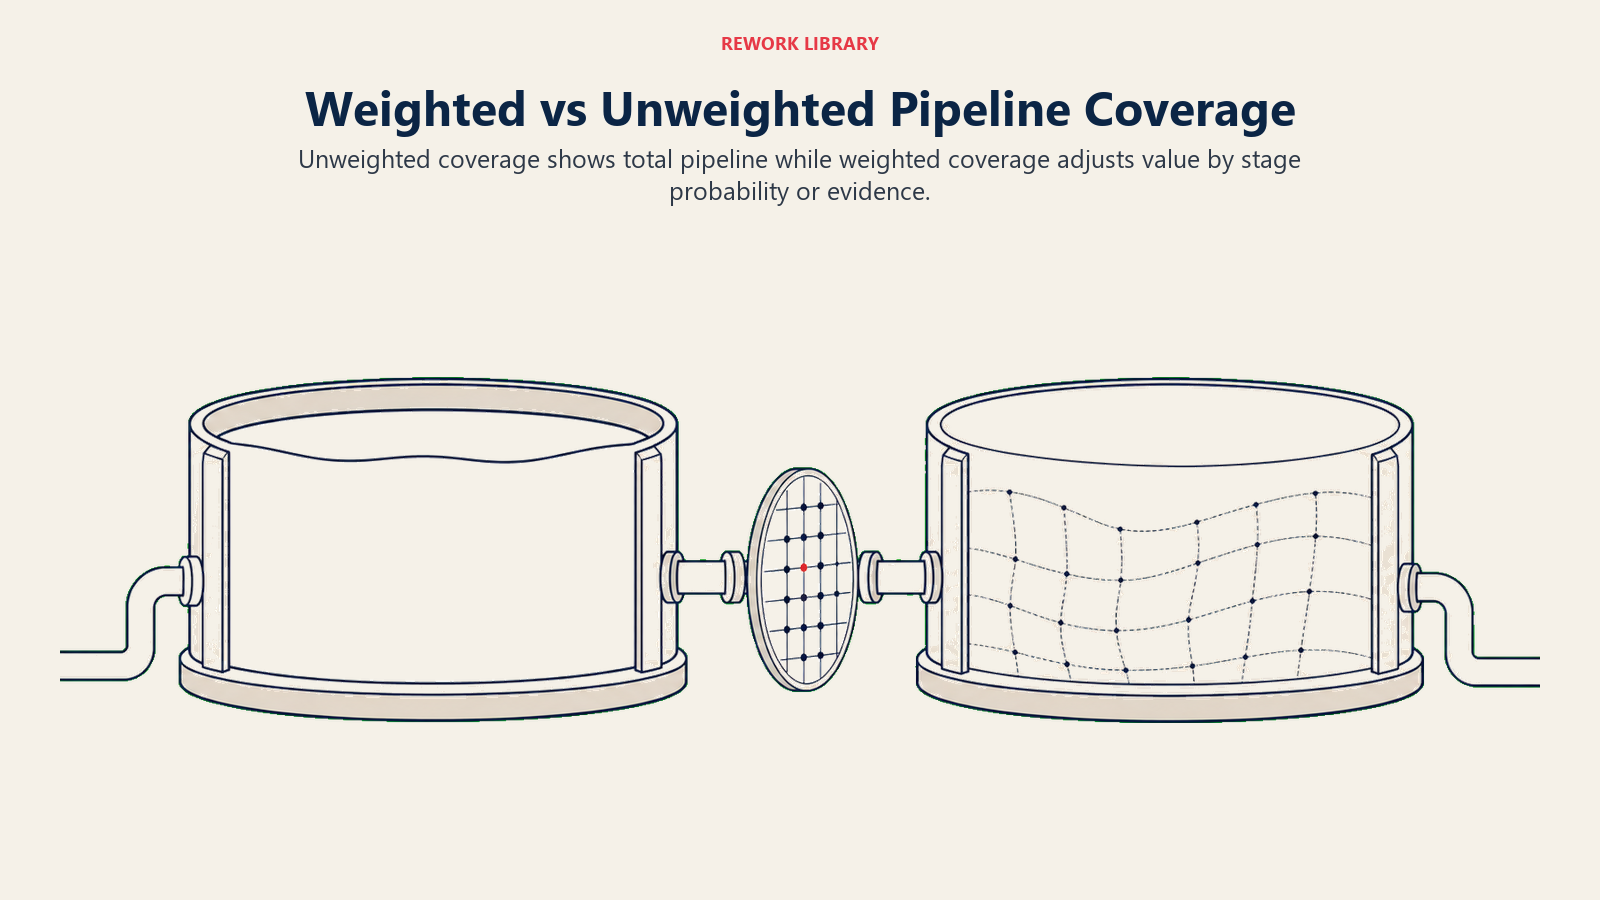
Unweighted coverage shows total open value. It is useful for understanding gross pipeline supply. Weighted coverage applies probability by stage or forecast category. It is useful for planning, but it can hide weak assumptions if stage probabilities are outdated.
Use both:
| View | Use |
|---|---|
| Unweighted coverage | Shows gross pipeline available |
| Stage-weighted coverage | Shows expected value by stage assumptions |
| Category-weighted coverage | Shows forecast confidence by commit and best case |
| Quality-adjusted coverage | Excludes stale, invalid, or low-fit deals |
RevOps should document the formulas. If finance, sales, and marketing calculate coverage differently, the planning conversation will break down.
Coverage by source
Source quality can change coverage interpretation.
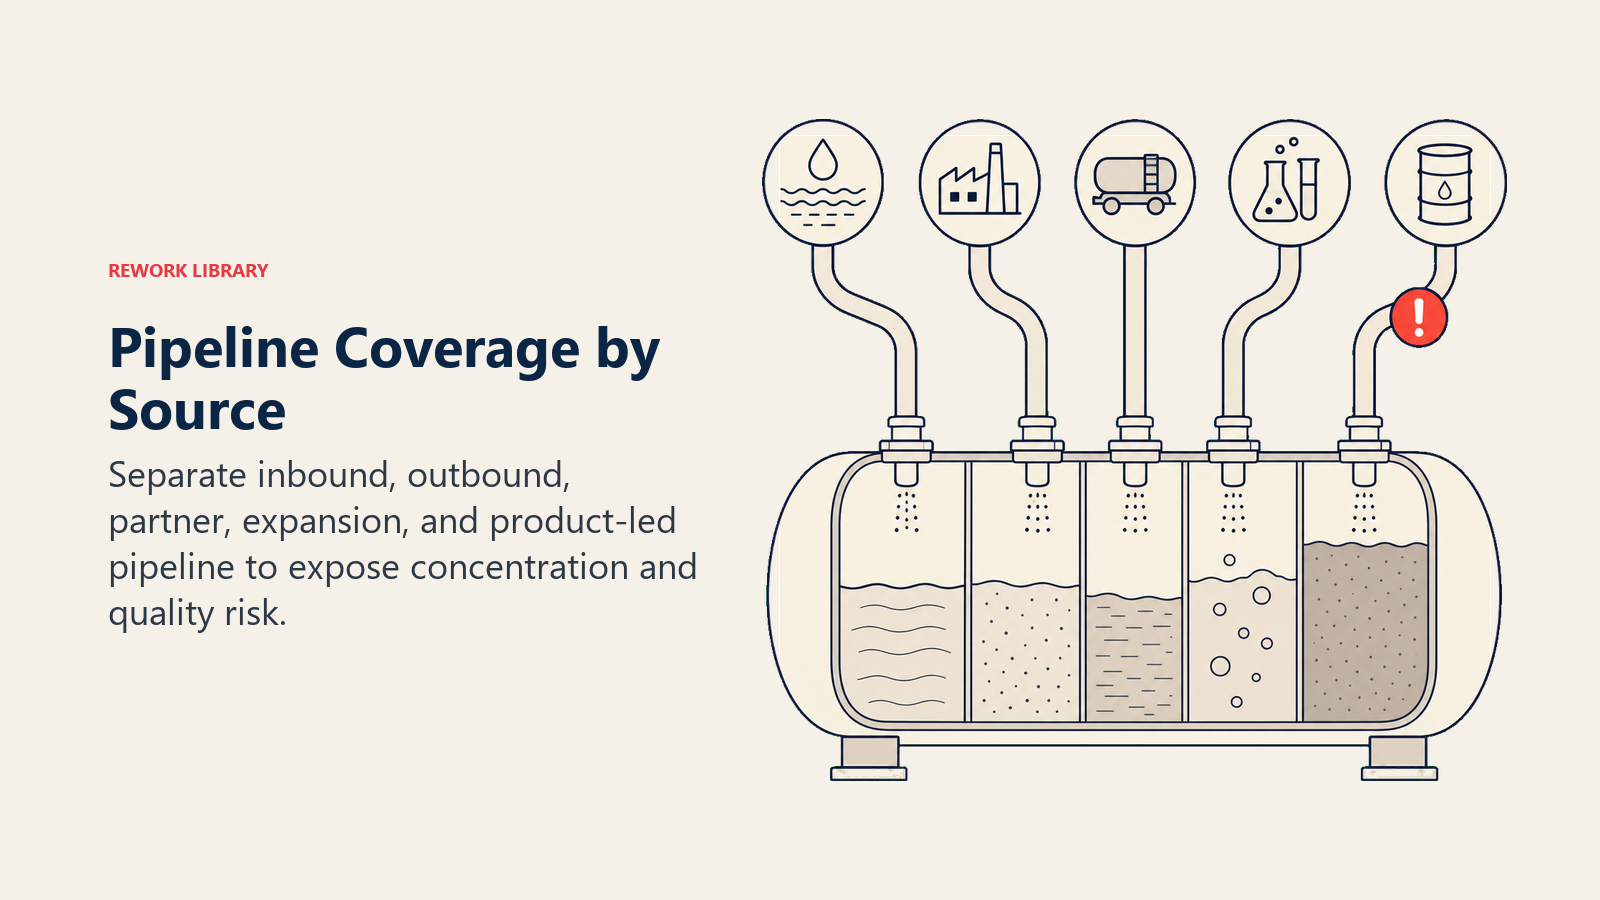
Inbound demo requests may convert differently from outbound-sourced opportunities. Partner pipeline may have slower sales cycles and less direct control. Event pipeline may be large but uneven. Expansion pipeline may depend more on adoption and customer health than classic lead source.
Coverage by source helps answer:
- Which sources create pipeline that closes?
- Which sources inflate early-stage coverage?
- Which sources produce late-stage pipeline?
- Which sources need different cycle assumptions?
- Which sources are strong in one segment but weak in another?
This connects coverage to demand planning instead of leaving it as a sales-only metric.
Coverage and marketing
Marketing should not be judged only by total pipeline created.
If marketing creates pipeline that never progresses, coverage rises but plan confidence does not. If marketing creates fewer but higher-converting opportunities, coverage may look lower while revenue quality improves. RevOps should help sales and marketing review coverage with conversion, stage progression, and source quality.
Useful joint questions:
- Are we creating enough pipeline for the next period?
- Is pipeline created early enough to close?
- Which campaigns create late-stage conversion?
- Which segments are under-covered?
- Which sources have high stage aging?
- Which sources need qualification changes?
This keeps coverage connected to revenue outcomes.
Coverage and rep capacity
Coverage can also reveal seller workload risk.
Too little pipeline per rep means sellers may not have enough opportunity to hit quota. Too much low-quality pipeline per rep can also be a problem, because sellers waste time on weak opportunities and manager inspection becomes noisy.
RevOps should review:
- Pipeline per rep
- Qualified pipeline per rep
- Late-stage pipeline per rep
- Pipeline by ramped vs ramping rep
- Pipeline created per rep
- Stage aging by rep
This ties coverage to Sales Capacity Planning. Hiring more reps will not solve the plan if pipeline creation does not scale. Creating more pipeline will not solve the plan if the team lacks capacity to work it well.
Coverage review cadence
Use different cadences for different decisions.
Weekly coverage review should focus on current period risk, close-date movement, stale pipeline, and urgent creation gaps. Monthly review should inspect source, segment, win rate, and stage quality. Quarterly planning should reset coverage targets based on historical performance, capacity, and market assumptions.
Coverage should appear in revenue cadence, demand planning, and finance planning. The same metric may answer different questions in each meeting.
Coverage quality checklist
Before presenting coverage to leadership, RevOps should check:
- Are closed-lost deals excluded?
- Are stale opportunities flagged?
- Are close dates in the right period?
- Are stages credible?
- Are duplicate opportunities removed?
- Are renewals and expansions separated when needed?
- Are source and segment views available?
- Are win-rate assumptions current?
- Are ramping reps separated from ramped reps?
If those checks are missing, the coverage number may create false comfort.
Actions from coverage analysis
Coverage analysis should lead to action.
Low current-quarter coverage may require pipeline creation, executive support, deal acceleration, or forecast adjustment. High stale coverage may require cleanup and manager coaching. Weak coverage in one segment may require marketing, SDR, partner, or territory changes. Strong early-stage coverage with weak late-stage coverage may indicate qualification or progression problems.
The output should be a clear operating action, not only a dashboard note.
Coverage examples
Example: enterprise coverage is 2.5x against a historical need of 2.2x, but commercial coverage is 1.4x against a historical need of 3.5x. The company-level number may look acceptable while commercial is at risk.
Example: current-quarter coverage is 5x, but 40 percent of the value has no next step and 30 percent is past the normal stage-age threshold. RevOps should present quality-adjusted coverage, not only total value.
Example: next-quarter coverage is weak, but current-quarter coverage is healthy. The action is not to panic about this quarter. It is to accelerate pipeline creation before next quarter becomes a forecast problem.
Keep the next-period view visible every week.
Coverage should create a planning conversation, not a single traffic-light status. When the number changes, leaders should ask which segment, source, stage, or close period changed first. That is where the action usually lives.
Coverage decision rules
Pipeline coverage should lead to a decision, not only a ratio.
| Coverage pattern | Likely interpretation | First decision |
|---|---|---|
| Low coverage and normal win rate | Not enough pipeline inventory | Increase qualified pipeline creation or reduce target risk |
| High coverage and low win rate | Pipeline quality problem | Tighten qualification, source mix, or stage criteria |
| High coverage and high stage aging | Timing problem | Inspect stale deals and close-date discipline |
| Good total coverage but weak current-quarter coverage | Period timing problem | Pull demand forward, reset forecast, or change close-period assumptions |
| Good coverage in one segment and weak coverage in another | Segment mix problem | Shift capacity, campaigns, or target expectations |
| Good coverage but weak forecast confidence | Evidence problem | Improve commit criteria and manager inspection |
This table prevents one common mistake: treating every coverage gap as a marketing problem. Coverage can be weak because demand is low, but it can also be weak because sales cycle assumptions are wrong, stage criteria are loose, or capacity is in the wrong segment.
Coverage review packet
A monthly coverage review should include more than the headline ratio.
Show:
- Coverage by period.
- Coverage by stage.
- Coverage by segment and source.
- Coverage by rep or team capacity.
- New pipeline created vs target.
- Stale pipeline and stage aging.
- Win rate and sales cycle assumptions.
- Forecast category split.
- Actions from last review.
The packet should make one question easy to answer: does the company have enough real, timely, qualified pipeline to support the plan?
Frequently Asked Questions about Pipeline Coverage Ratio
What is a good pipeline coverage ratio?
It depends on win rate, sales cycle, segment, and stage quality. Use internal history before adopting generic targets.
Who owns pipeline coverage?
Sales owns pipeline creation and quality. RevOps owns the reporting model and stage hygiene. Finance uses coverage for planning.
Learn more

Senior Operations & Growth Strategist
On this page
- Formula
- How to interpret it
- Coverage quality model
- Coverage formula
- Coverage by stage
- Coverage by segment
- Coverage and win rate
- Coverage and timing
- Dashboard design
- Common mistakes
- Readiness checklist
- Example coverage analysis
- Coverage targets
- Coverage by period
- Coverage and sales capacity
- Coverage and pipeline inspection
- Finance partnership
- Common scenarios
- What the scenario teaches
- Pipeline coverage maturity model
- Example target model
- Weighted and unweighted coverage
- Coverage by source
- Coverage and marketing
- Coverage and rep capacity
- Coverage review cadence
- Coverage quality checklist
- Actions from coverage analysis
- Coverage examples
- Coverage decision rules
- Coverage review packet
- Learn more