Pipeline Velocity: Measuring and Accelerating Deal Flow Through Stages
Turn this article into takeaways for your work.
Each assistant summarizes the article only for you and suggests best practices for your work.
Here's something most revenue leaders get wrong: they look at pipeline size and think they understand their revenue trajectory. They don't.
A $10M pipeline sounds impressive until you realize deals are taking 180 days to close instead of 90. At that velocity, your pipeline isn't generating the revenue you think it is. You're sitting on stalled capital, and the problem compounds quarter after quarter.
Pipeline velocity tells you the truth. It shows how fast revenue actually flows through your sales operation, not how much sits in stages collecting dust.
If you're building predictable revenue forecasting, you need to understand this. Pipeline velocity isn't another vanity metric. It's the operational indicator that determines whether your pipeline translates into actual bookings or just looks good in board decks.
What is Pipeline Velocity?
Pipeline velocity measures the speed at which opportunities move through your sales pipeline and convert into revenue. It's a composite metric that captures not just how many deals you have, but how quickly they're moving, how big they are, and how likely they are to close.
Think of it as revenue throughput. High velocity means your pipeline is converting efficiently to closed-won deals. Low velocity means revenue is stuck, stalled, or leaking out through losses.
Pipeline velocity forces you to look at all the factors that impact revenue generation simultaneously, not just individual metrics in isolation.
The Pipeline Velocity Formula
The velocity formula shows how opportunity volume, deal size, win rate, and cycle length combine into revenue speed.
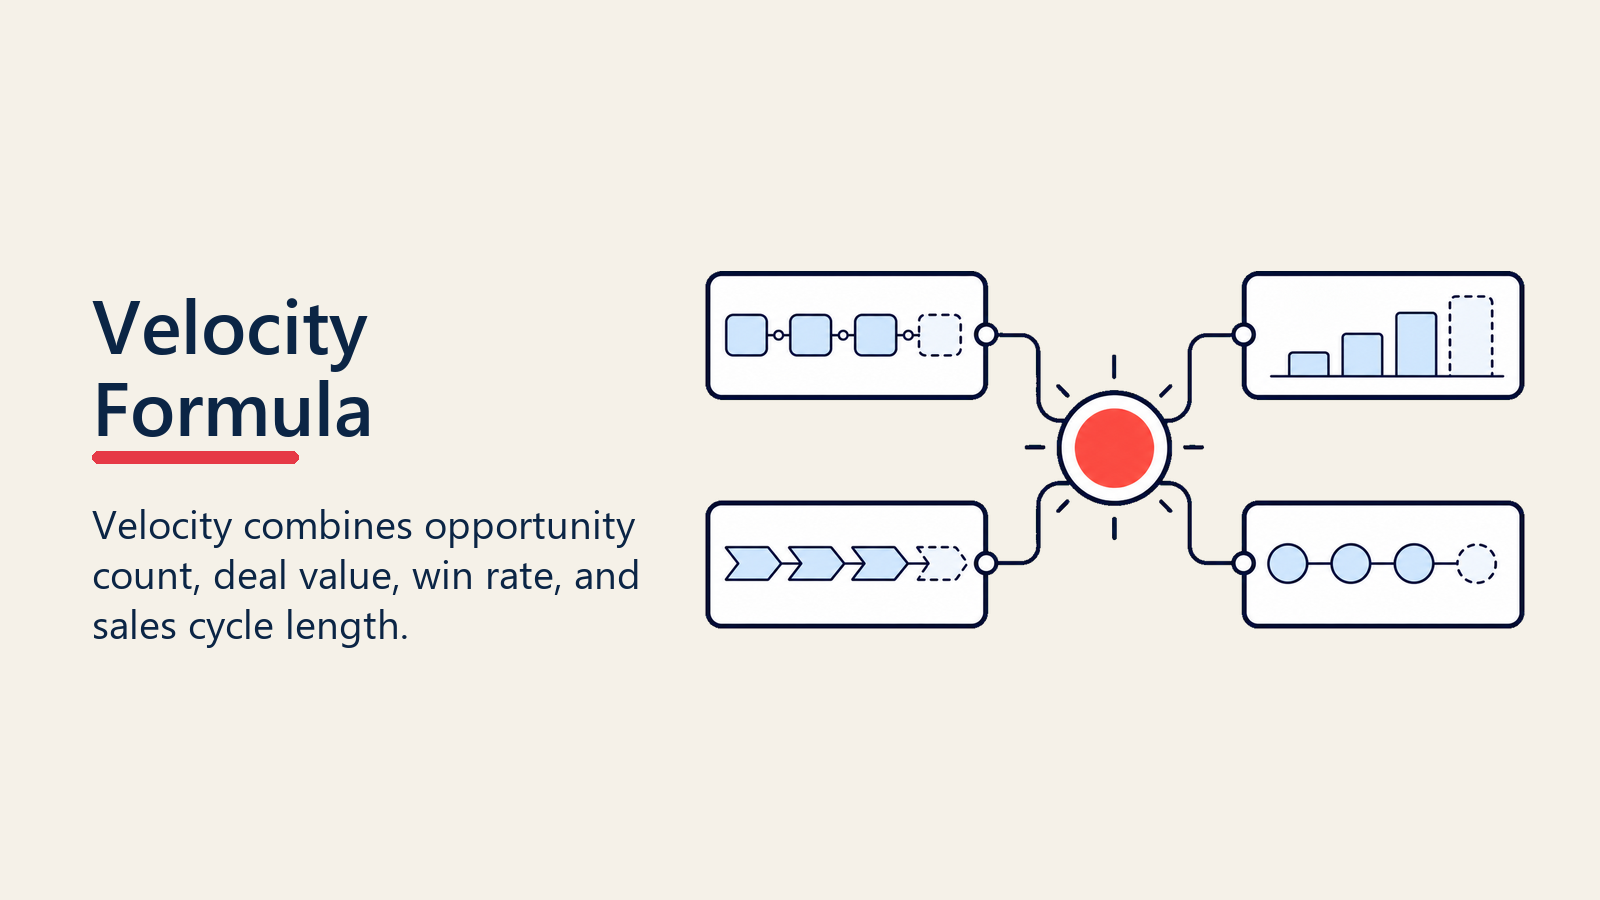
Pipeline velocity is calculated using four core components:
Pipeline Velocity = (Number of Opportunities × Average Deal Value × Win Rate %) / Sales Cycle Length (Days)
Let's break down what this formula actually tells you:
Number of Opportunities: The volume of active deals in your pipeline. More opportunities increase velocity, assuming other factors stay constant.
Average Deal Value: The typical size of your deals. Larger deals generate more revenue per opportunity, accelerating velocity.
Win Rate Percentage: Your close rate, the percentage of opportunities that convert to closed-won. Higher win rates mean less wasted effort and faster revenue generation.
Sales Cycle Length: The average time from opportunity creation to close (won or lost). Shorter cycles mean revenue arrives faster, directly increasing velocity.
Example Calculation
Let's say you have:
- 50 opportunities in pipeline
- $25,000 average deal size
- 30% win rate
- 60-day sales cycle
Pipeline Velocity = (50 × $25,000 × 0.30) / 60 days = $6,250 per day
That's your daily revenue generation rate. Multiply by 30 to get monthly velocity ($187,500) or by 90 to get quarterly velocity ($562,500).
The power of this metric is that it shows you exactly which levers to pull to accelerate revenue generation.
The Four Velocity Components: What They Tell You
Each velocity component points to a different lever for improving pipeline output.
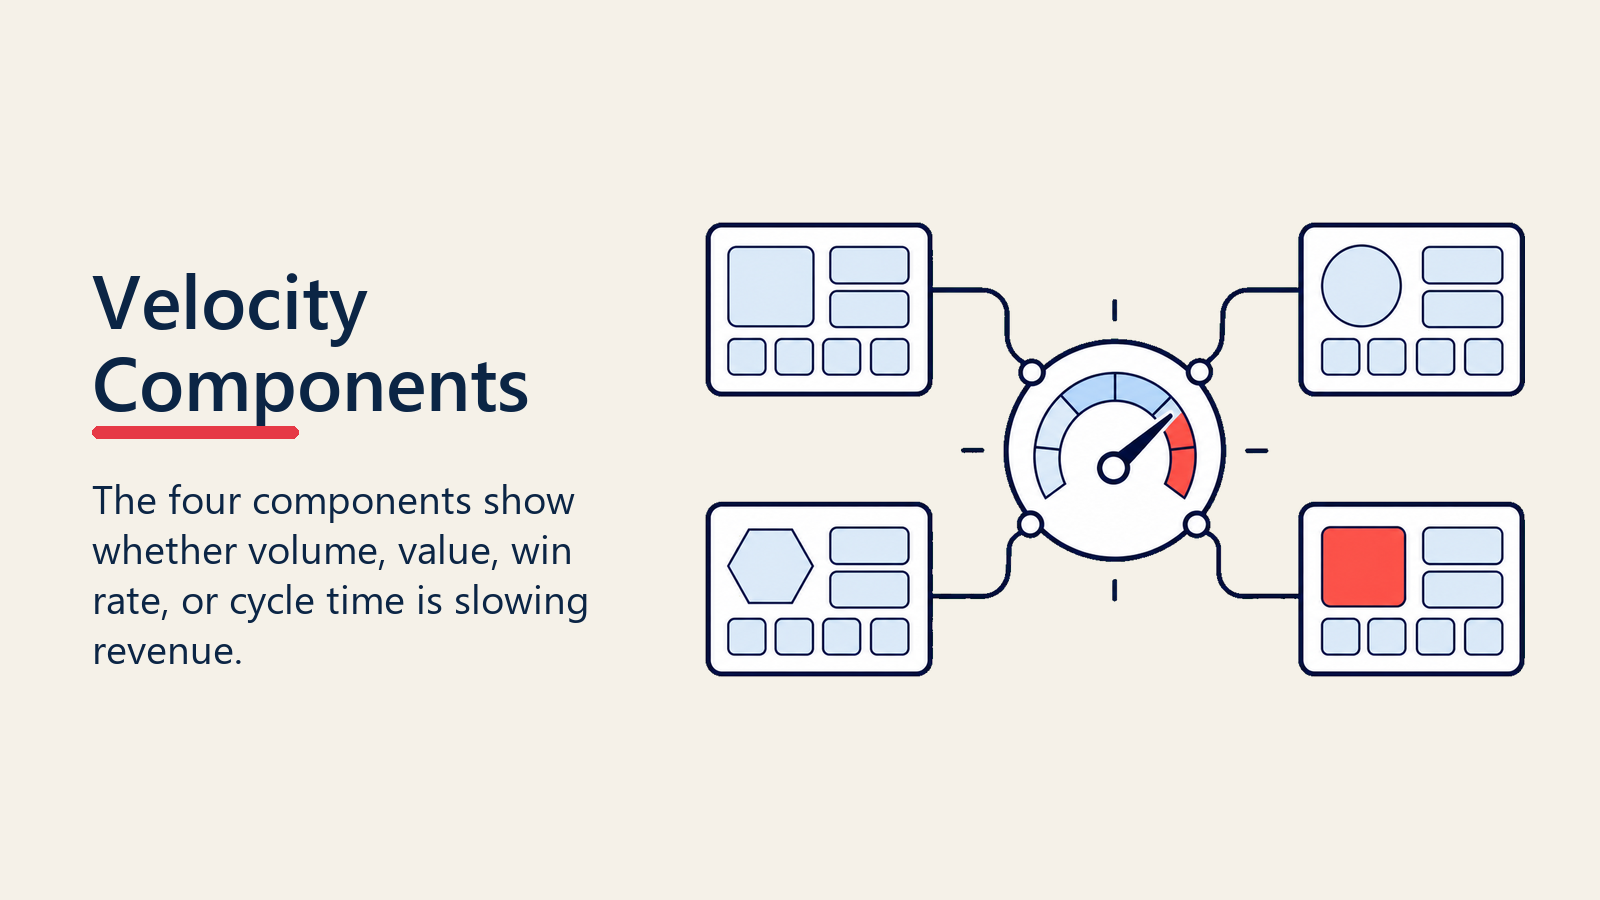
Each component of the velocity formula reveals different aspects of pipeline health:
1. Number of Opportunities (Volume)
This measures pipeline generation capacity, your ability to create qualified opportunities.
What impacts it:
- Marketing lead generation effectiveness
- SDR/BDR prospecting productivity
- Inbound conversion rates
- Partner and referral programs
Warning signs:
- Declining opportunity volume quarter-over-quarter
- Inconsistent opportunity creation (feast or famine)
- Heavy dependence on a single source
2. Average Deal Value (Size)
This measures deal quality and solution pricing power.
What impacts it:
- Product/service pricing strategy
- Upsell and cross-sell effectiveness
- Customer segment targeting (enterprise vs. SMB)
- Sales rep ability to expand deal scope
Warning signs:
- Declining average deal size over time
- High variance in deal sizes (lack of ICP focus)
- Discounting that erodes deal value
3. Win Rate Percentage (Conversion)
This measures qualification quality and competitive positioning through effective opportunity qualification.
What impacts it:
- Lead qualification rigor
- Sales methodology execution
- Product-market fit
- Competitive differentiation
- Pricing and value communication
Warning signs:
- Win rates below 25% (poor qualification)
- Declining win rates (competitive pressure)
- Wide variation in rep win rates (skill gaps)
4. Sales Cycle Length (Time)
This measures operational efficiency and buyer friction.
What impacts it:
- Deal complexity and decision-maker access
- Internal approval processes (both yours and customers')
- Sales process effectiveness
- Champion strength and internal selling
Warning signs:
- Lengthening sales cycles over time
- Deals stuck in specific stages for extended periods
- High variance in cycle length (unpredictable close timing)
Clear stage gate criteria can help identify and address these issues before they impact velocity.
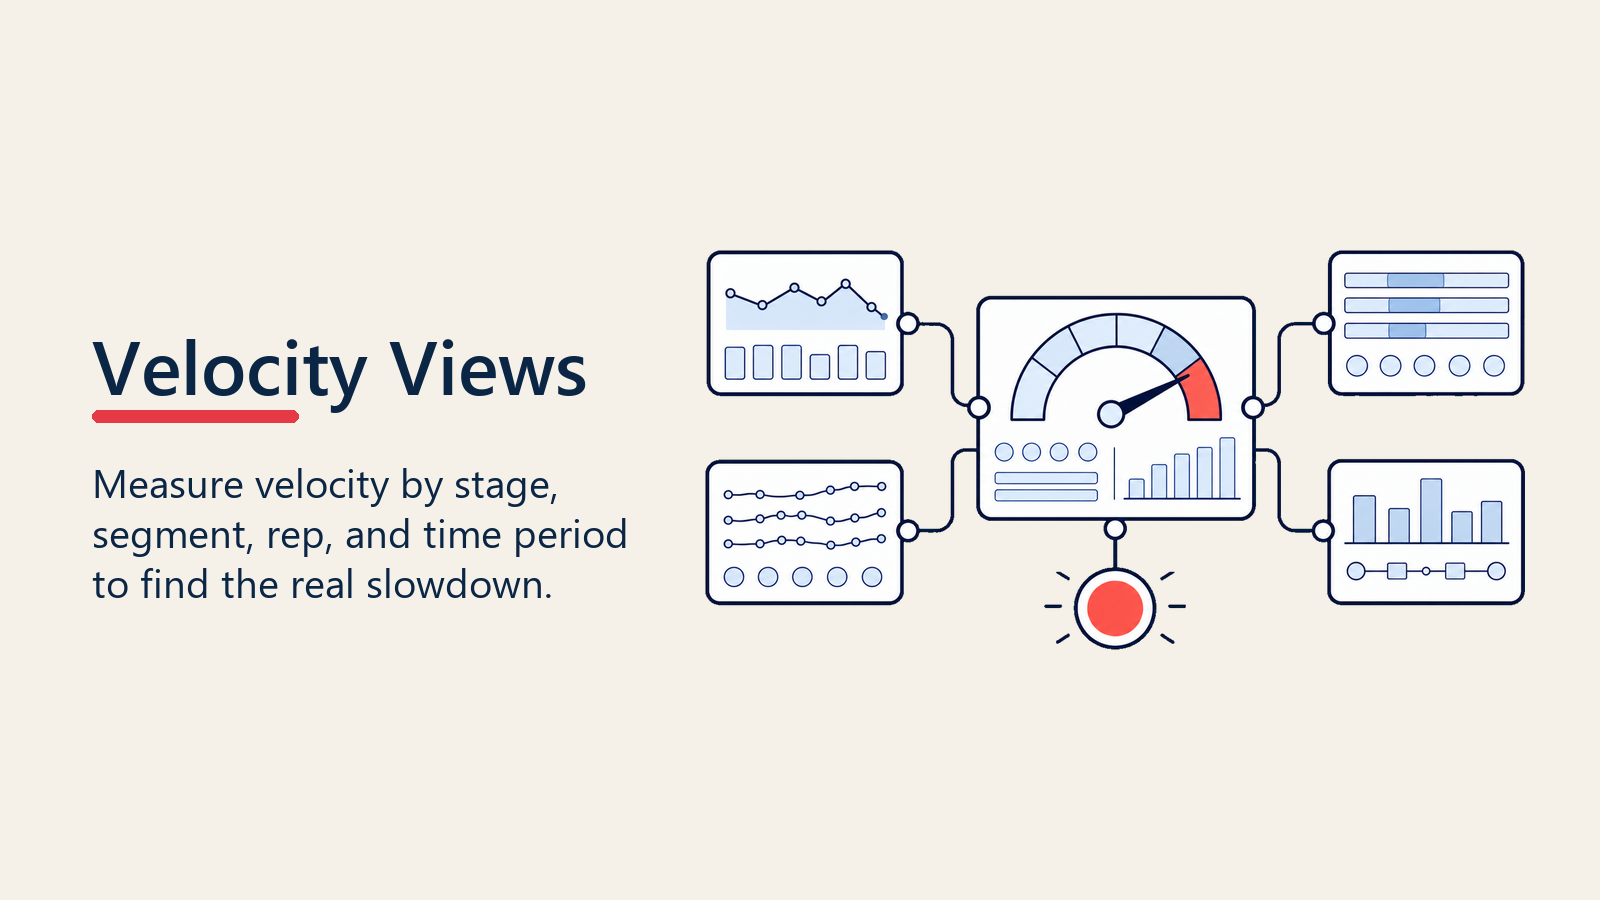
Measuring Pipeline Velocity: Four Critical Views
Velocity isn't just a single number. You need multiple views to understand what's actually happening:
1. Overall Pipeline Velocity
Your aggregate velocity across all opportunities, segments, and reps. This gives you the headline number for executive reporting and trend tracking.
Track this monthly and quarterly to identify whether your revenue generation capacity is improving or declining.
2. Stage-Specific Velocity
Calculate velocity for opportunities at each pipeline stage. This reveals where deals are accelerating versus where they're stalling.
For example:
- Discovery to Demo: 12 days average
- Demo to Proposal: 18 days average
- Proposal to Negotiation: 45 days average (red flag!)
- Negotiation to Close: 10 days average
Stage-specific velocity pinpoints exactly where pipeline bottlenecks exist.
3. Rep-Level Velocity
Compare velocity across individual sales reps. This identifies top performers (who are they closing faster and at what win rates?) and coaching opportunities.
Rep-level velocity reveals:
- Who's closing the right-sized deals
- Who's qualifying effectively (high win rates)
- Who's getting deals through stages efficiently
This data is invaluable for pipeline coaching conversations and identifying best practices to replicate across the team.
4. Segment Velocity
Break velocity down by customer segment (enterprise, mid-market, SMB), vertical, or product line.
This shows which segments generate revenue fastest and where your sales motion is most efficient. It also reveals misalignment, like pouring resources into segments with slow velocity and low returns.
Pipeline Velocity Benchmarks: What "Good" Looks Like
Velocity benchmarks vary significantly by business model, deal size, and market segment. Here's what typical looks like:
By Sales Motion
High-Velocity Transactional (SMB)
- Sales Cycle: 7-30 days
- Win Rate: 25-35%
- Deal Size: $5K-$25K
- Expected Velocity: $5K-$15K per day per rep
Mid-Market Consultative
- Sales Cycle: 30-90 days
- Win Rate: 30-40%
- Deal Size: $25K-$100K
- Expected Velocity: $10K-$30K per day per rep
Enterprise Complex
- Sales Cycle: 90-180 days
- Win Rate: 20-30%
- Deal Size: $100K-$500K+
- Expected Velocity: $15K-$50K per day per rep
Industry Context Matters
SaaS companies typically see shorter cycles (30-60 days for SMB, 90-120 for enterprise) because of lower switching costs and standardized implementations.
Professional services and complex technology sales often see longer cycles (120-240 days) because of customization requirements, procurement processes, and stakeholder complexity.
What matters most isn't hitting arbitrary benchmarks, it's improving your velocity over time and understanding which levers drive improvement. Use pipeline coverage analysis alongside velocity to ensure you have sufficient pipeline to hit targets at your current velocity rate.
Stage Duration Analysis: Where Time Disappears
Stage duration analysis reveals where deals wait longest and which delays are normal versus addressable.
Sales cycle length is an average, but deals don't move evenly through stages. Some stages are fast, others drag on. Identifying where time disappears is crucial for acceleration.
Mapping Stage Duration
Calculate average time spent in each stage:
Discovery: 8 days
Qualification: 5 days
Demo/Presentation: 12 days
Proposal: 22 days (bottleneck!)
Negotiation: 18 days
Contracting: 15 days
In this example, 22 days in Proposal stage is a clear bottleneck. That's where deal progression is stalling.
Why Stage Duration Matters More Than You Think
If your proposal stage averages 22 days but your top performer closes that stage in 10 days, you have a 12-day acceleration opportunity. Scale that across 50 deals per quarter and you've shaved 600 days of cycle time, you've essentially doubled your velocity.
Stage duration analysis reveals:
- Which stages need operational improvements
- Where reps need enablement or coaching
- Where buyers face decision friction
- Where your internal processes create delays
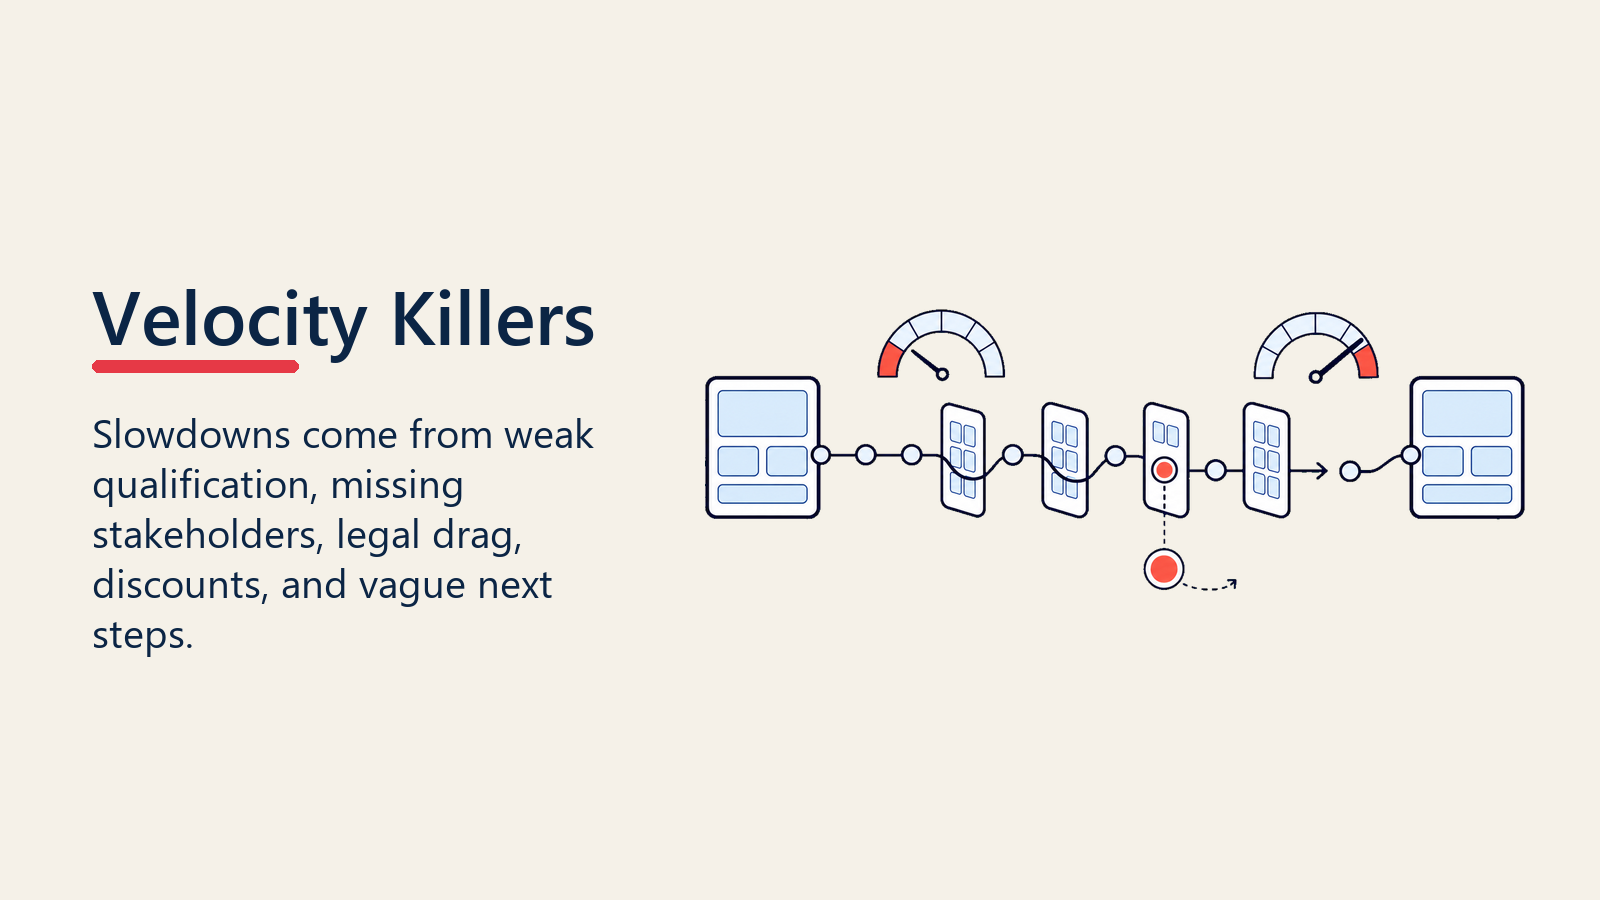
Velocity Killers: The Seven Deal-Slowing Forces
Certain patterns consistently slow pipeline velocity. Recognize these and you can address them:
1. Decision-Maker Access Issues
Deals stall when you're talking to influencers but can't reach decision-makers. Your champion can love your solution, but if the CFO or VP who signs contracts isn't engaged, you're stuck.
Acceleration strategy: Multi-threading, intentionally building relationships at multiple levels, including economic buyer and executive sponsors.
2. Internal Approval Delays
Both yours and the customer's. Complex approval chains (procurement, legal, security reviews) add weeks to cycles.
Acceleration strategy: Map approval processes early. Identify all stakeholders and address their concerns proactively. On your side, streamline pricing approvals and contract templates.
3. Scope Creep and Requirement Expansion
Deals that start simple get complicated as more stakeholders add requirements. What began as a single-department solution becomes an enterprise-wide initiative.
Acceleration strategy: Anchor scope early with mutual action plans. Phase implementations so initial deals close faster, with expansion opportunities addressed post-launch.
4. Missing or Weak Champion
Deals without internal champions, people who sell your solution when you're not in the room, stall or die. Weak champions lack influence, access, or urgency.
Acceleration strategy: Qualify champion strength explicitly. If you don't have one, develop one. If yours is weak, find a stronger advocate.
5. Competitive Situations and Evaluation Fatigue
Multiple vendor evaluations extend cycles. Prospects schedule demos with five vendors, then need weeks to compare and deliberate.
Acceleration strategy: Create urgency through limited-time offers, highlight switching costs and opportunity costs of delayed decisions, and differentiate strongly to short-circuit lengthy comparisons.
6. Unclear or Shifting Requirements
When prospects don't know exactly what they need, or requirements change mid-cycle, deals restart or stall entirely.
Acceleration strategy: Lead with discovery. Facilitate requirements definition rather than waiting for prospects to figure it out. Position yourself as the expert who clarifies needs.
7. Budget and Timing Misalignment
Deals that don't align with budget cycles or fiscal planning drag on as prospects wait for "next quarter" or "next year."
Acceleration strategy: Qualify budget availability and timing early. If timing is genuinely off, schedule follow-up for when budget becomes available rather than letting deals linger artificially.
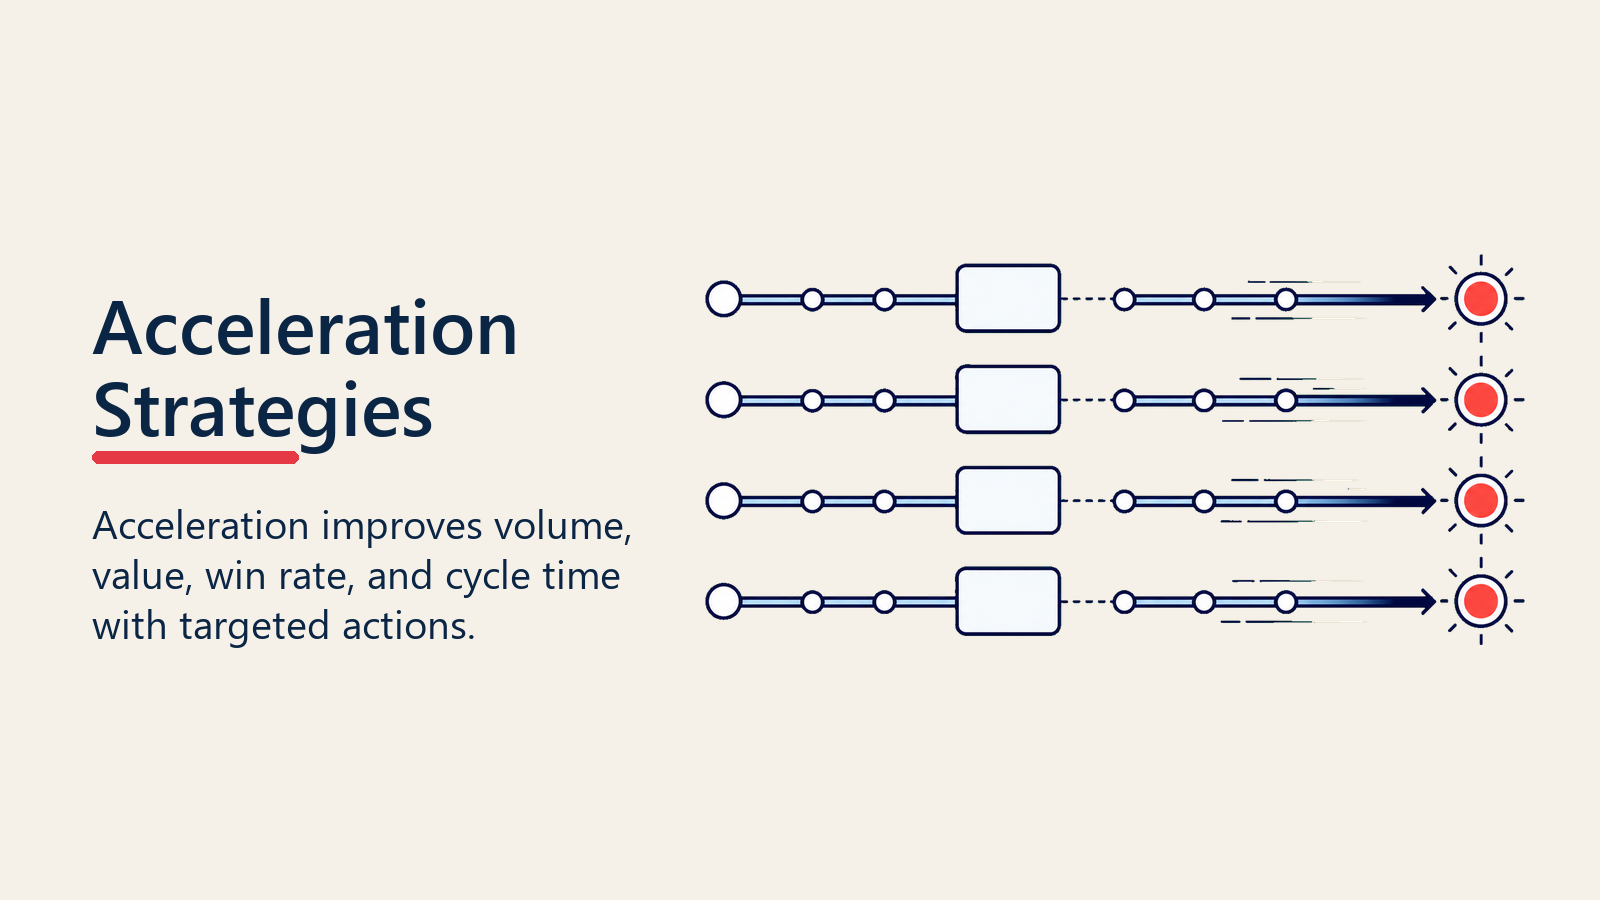
Pipeline Acceleration Strategies: Improving Each Component
The velocity formula shows exactly where to focus acceleration efforts. Here's how to improve each component:
Accelerating Opportunity Volume
Optimize high-converting sources: Double down on channels with the best MQL-to-opportunity conversion rates.
Improve SDR effectiveness: Better prospecting sequences, higher-quality accounts, and improved qualification handoffs increase opportunity creation.
Expand partner and referral programs: Warm introductions convert faster and at higher rates than cold outbound.
Increasing Average Deal Value
Target larger accounts: Adjust ICP and prospecting focus toward bigger organizations with higher budget capacity.
Improve solution packaging: Bundle features and services to increase deal size without requiring upsells.
Train reps on value-based selling: Help prospects see ROI rather than competing on price, which expands deal scope.
Boosting Win Rates
Tighten qualification criteria: Focus only on prospects with genuine need, budget, authority, and timeline. Disqualify faster to avoid wasting cycles on low-probability deals.
Strengthen competitive positioning: Clearer differentiation, better battle cards, and proof points that win competitive evaluations.
Improve sales methodology execution: MEDDIC, Challenger, or whichever framework you use, execution quality determines win rates.
Shortening Sales Cycles
Front-load discovery: Ask hard questions early. Uncover objections, identify stakeholders, and qualify urgency before investing time in demos and proposals.
Use mutual action plans: Collaborate with prospects to create joint close plans with specific milestones and deadlines. This creates momentum and accountability.
Eliminate internal friction: Streamline approvals, contracts, and onboarding so you're not the bottleneck when prospects are ready to close.
Deploy social proof and urgency: Case studies, testimonials, and limited-time incentives accelerate decision-making.
For a comprehensive approach to shortening cycles, explore sales cycle reduction and pipeline acceleration strategies.
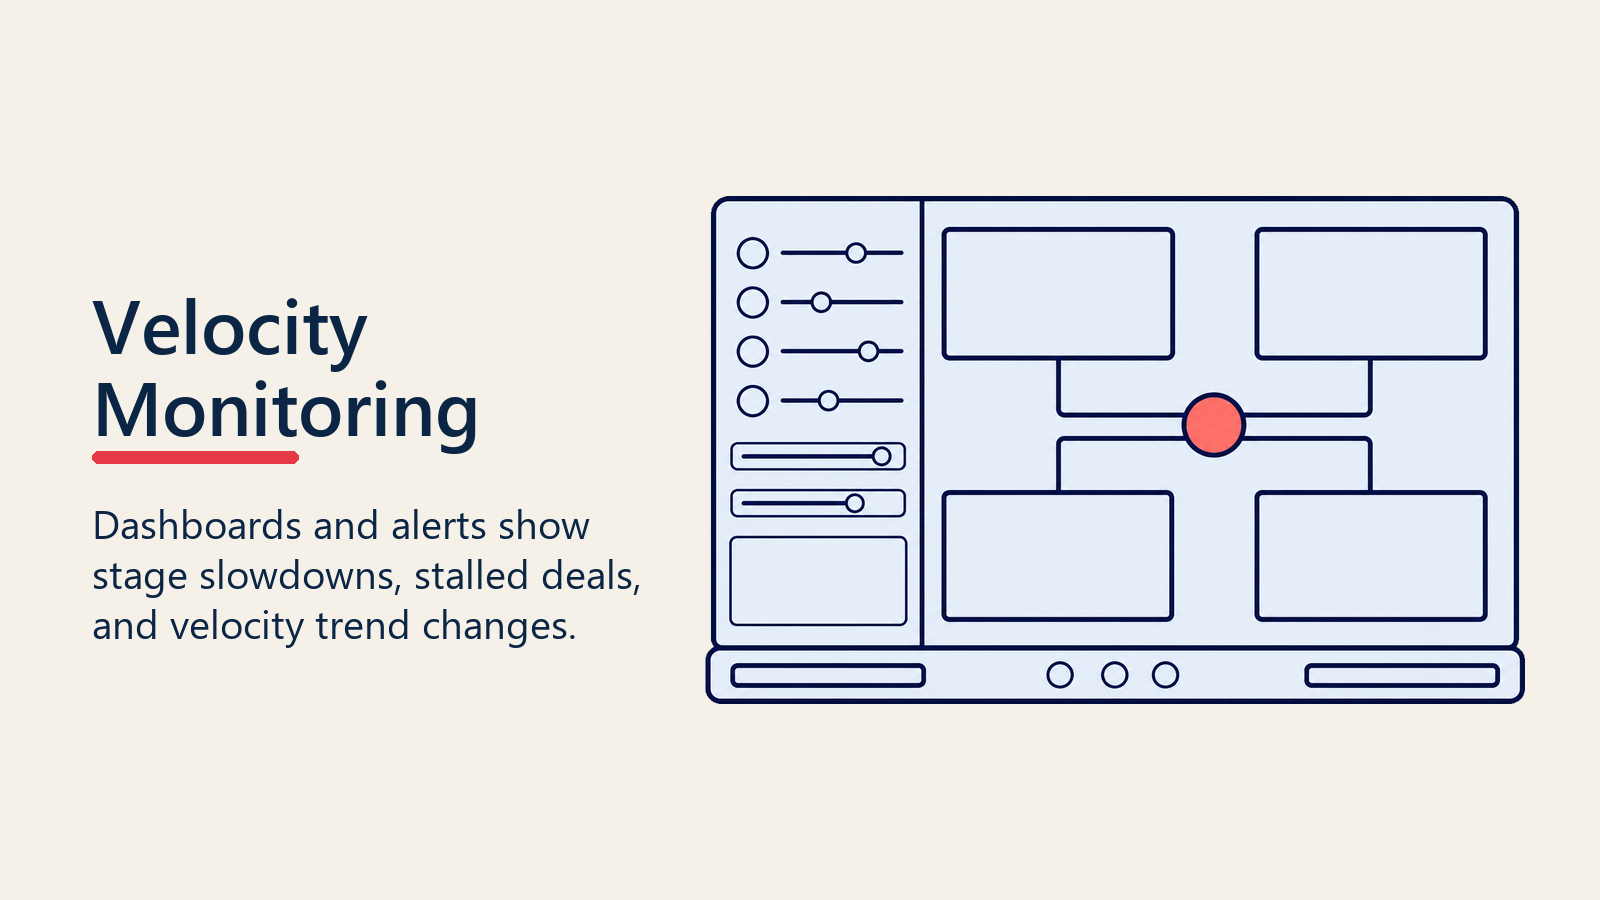
Monitoring Pipeline Velocity: Dashboards and Alerts
Pipeline velocity isn't a set-it-and-forget-it metric. It requires continuous monitoring to spot trends and take corrective action.
Essential Dashboard Views
Build these views into your regular pipeline reviews to maintain visibility into velocity trends.
1. Velocity Trend Over Time Track monthly and quarterly velocity to see if your revenue generation capacity is improving, declining, or flat.
2. Component Breakdown Display the four velocity components separately so you can see which factors are driving changes in overall velocity.
3. Stage Duration Waterfall Visualize time spent in each stage to quickly identify bottlenecks.
4. Rep Performance Matrix Compare reps across velocity, win rate, and average deal size to identify coaching opportunities and best practices to replicate.
5. Segment Velocity Heatmap Show velocity by segment (vertical, deal size, region) to inform resource allocation and go-to-market strategy.
Critical Alerts
Set up automated alerts for:
- Velocity drops 20%+ month-over-month: Investigate cause immediately
- Stage duration exceeds threshold: Flag deals stuck longer than typical stage duration
- Win rate declines 10%+ from baseline: Signals competitive pressure or qualification issues (see win rate improvement strategies)
- Sales cycle length increases 15%+: Indicates systemic slowdown requiring intervention
Using Velocity Data for Forecasting
Pipeline velocity directly improves forecast accuracy. Instead of gut-feel predictions based on pipeline size, you can calculate expected revenue based on historical velocity.
If your velocity is $6,250 per day and you have 90 days in the quarter, you can forecast $562,500 in new bookings with statistical confidence.
As you track velocity trends, you can adjust forecasts up or down based on leading indicators, velocity changes before bookings do.
For broader context on measurement, review the pipeline metrics overview to understand how velocity fits into your overall pipeline health framework.
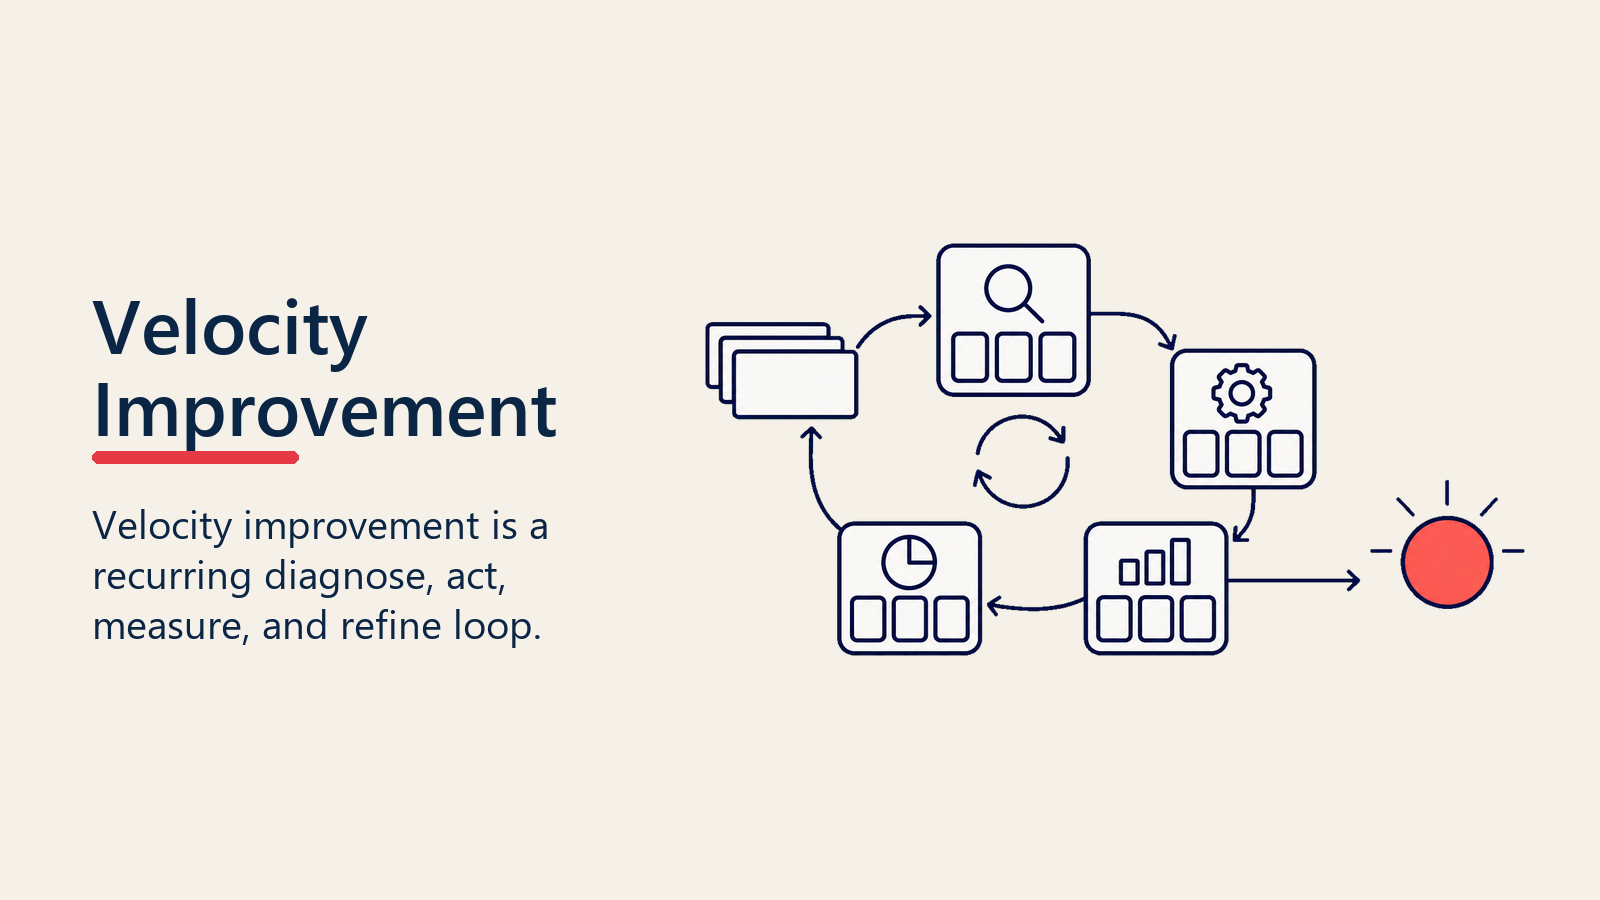
Velocity Improvement: A Continuous Optimization Process
Improving pipeline velocity isn't a one-time project. It's an operational discipline that requires ongoing attention.
Quarterly Velocity Reviews
Every quarter, conduct a structured velocity review:
- Analyze trends: Is velocity improving or declining? Why?
- Identify bottlenecks: Which stages are slowing down?
- Compare segments and reps: Where are the biggest gaps?
- Select focus area: Choose one or two components to improve this quarter
- Define experiments: What specific changes will you test?
- Measure impact: Track results and iterate
Rep-Level Coaching
Use velocity data to inform coaching conversations:
"Your win rate is strong at 35%, but your average cycle length is 95 days compared to team average of 65 days. Let's talk about what's causing delays in your deals and how we can accelerate them."
This is far more actionable than generic "close more deals faster" feedback.
Experimentation and Learning
Treat velocity improvement as a continuous learning process:
- Test different qualification criteria
- Experiment with mutual action plan templates
- Try new demo formats or proposal structures
- Adjust target account profiles
Measure the impact on velocity components and double down on what works.
Conclusion: Velocity as Revenue Predictor
Pipeline velocity isn't just a metric. It's the operational indicator that tells you whether your sales engine is accelerating or grinding to a halt.
Companies that monitor and optimize velocity don't just understand their pipeline, they control their revenue trajectory. They know exactly which levers to pull to hit targets, and they see problems coming before they show up in missed quotas.
Those that ignore velocity? They're constantly surprised by shortfalls, scrambling to add more pipeline without understanding why existing opportunities aren't converting efficiently.
The formula is simple. The discipline is hard. But the result, predictable, accelerating revenue growth, is worth the operational rigor.
Build the dashboards. Run the analyses. Hold the reviews. Improve the components. Make velocity a leadership discipline, and watch your revenue generation capacity compound.
Ready to accelerate your pipeline? Start by conducting a pipeline bottleneck analysis to identify where deals are stalling, then implement systematic deal progression management to keep opportunities moving.
Learn more:

Senior Operations & Growth Strategist
On this page
- What is Pipeline Velocity?
- The Pipeline Velocity Formula
- Example Calculation
- The Four Velocity Components: What They Tell You
- 1. Number of Opportunities (Volume)
- 2. Average Deal Value (Size)
- 3. Win Rate Percentage (Conversion)
- 4. Sales Cycle Length (Time)
- Measuring Pipeline Velocity: Four Critical Views
- 1. Overall Pipeline Velocity
- 2. Stage-Specific Velocity
- 3. Rep-Level Velocity
- 4. Segment Velocity
- Pipeline Velocity Benchmarks: What "Good" Looks Like
- By Sales Motion
- Industry Context Matters
- Stage Duration Analysis: Where Time Disappears
- Mapping Stage Duration
- Why Stage Duration Matters More Than You Think
- Velocity Killers: The Seven Deal-Slowing Forces
- 1. Decision-Maker Access Issues
- 2. Internal Approval Delays
- 3. Scope Creep and Requirement Expansion
- 4. Missing or Weak Champion
- 5. Competitive Situations and Evaluation Fatigue
- 6. Unclear or Shifting Requirements
- 7. Budget and Timing Misalignment
- Pipeline Acceleration Strategies: Improving Each Component
- Accelerating Opportunity Volume
- Increasing Average Deal Value
- Boosting Win Rates
- Shortening Sales Cycles
- Monitoring Pipeline Velocity: Dashboards and Alerts
- Essential Dashboard Views
- Critical Alerts
- Using Velocity Data for Forecasting
- Velocity Improvement: A Continuous Optimization Process
- Quarterly Velocity Reviews
- Rep-Level Coaching
- Experimentation and Learning
- Conclusion: Velocity as Revenue Predictor