FMEA: Failure Mode and Effects Analysis erklärt
Turn this article into takeaways for your work.
Each assistant summarizes the article only for you and suggests best practices for your work.
FMEA, die Abkürzung für Failure Mode and Effects Analysis, ist die Methode, mit der Ingenieur- und Betriebsteams Probleme stoppen, bevor sie den Kunden erreichen. Wenn Ihr Team sich jemals gefragt hat "Was könnte schiefgehen, und wie schlimm wäre es?", ist FMEA der strukturierte Weg, diese Frage zu beantworten.
Was ist FMEA?
FMEA ist eine strukturierte Methode zur Identifizierung potenzieller Fehler in einem Produkt, Prozess oder System, zur Bestimmung ihrer Ursachen und Auswirkungen und zur Priorisierung nach Risiko, sodass das Team zuerst bei den Hochprioritätspunkten handeln kann.
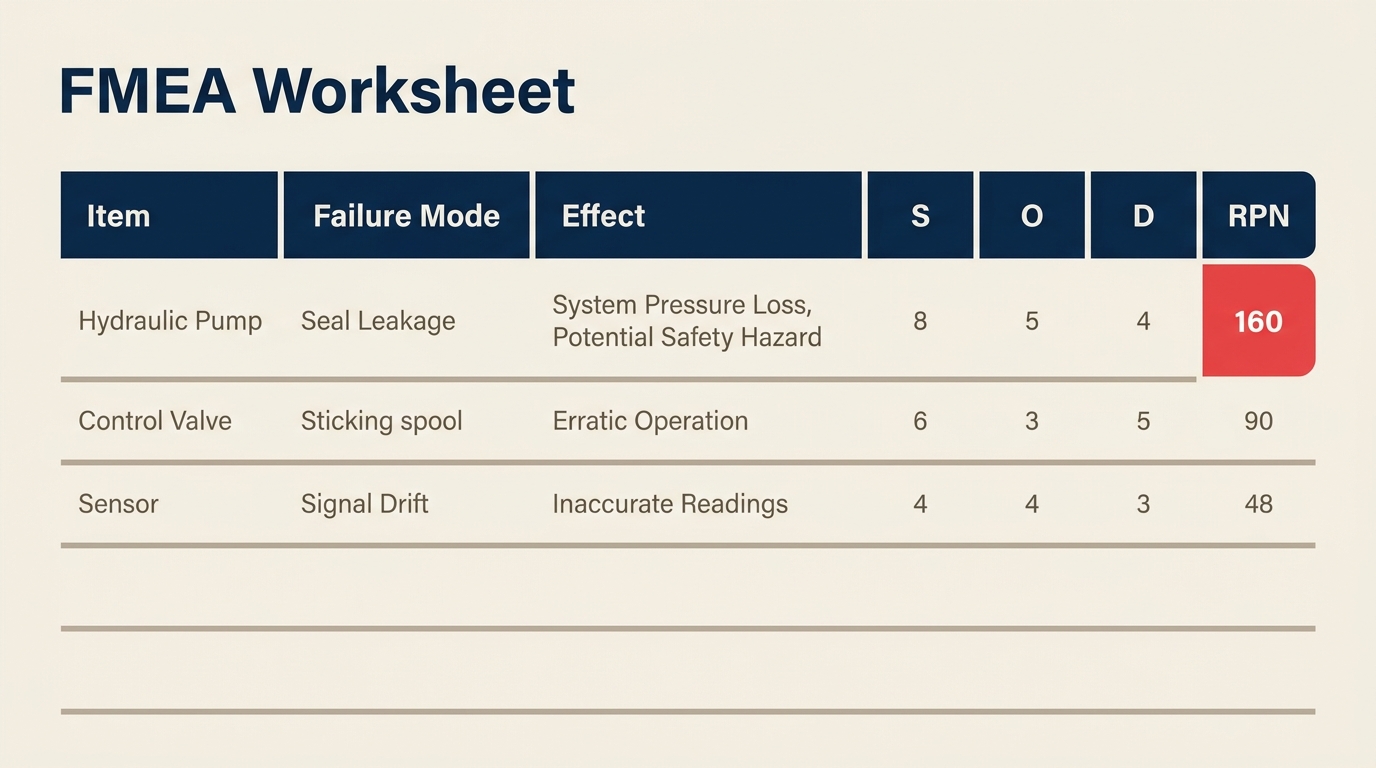
Das Ergebnis ist ein bewertetes Arbeitsblatt. Jeder Fehlermodus erhält eine Risk Priority Number (RPN) basierend auf drei Faktoren: wie schwerwiegend der Fehler ist, wie häufig er wahrscheinlich auftritt und wie gut aktuelle Kontrollen ihn erkennen können, bevor er Schaden anrichtet. Teams fokussieren dann ihre Verbesserungsbemühungen auf die Fehlermodi mit den höchsten RPNs.
FMEA dokumentiert nicht nur, was schiefgehen könnte. Sie zwingt funktionsübergreifende Teams, Fehler systematisch durchzudenken, bevor die Produktion beginnt oder bevor eine Prozessänderung in Betrieb geht.
Key Facts
FMEA wurde erstmals durch das US-Militär in MIL-P-1629, veröffentlicht 1949, formalisiert, ursprünglich entwickelt, um Fehler in Waffen- und Ausrüstungssystemen für Missionssicherheit und -erfolg zu bewerten.
NASA übernahm FMEA für das Apollo-Programm in den 1960er Jahren als Teil ihrer Zuverlässigkeitstechnik-Praktiken, und von dort verbreitete sich die Methode in die Luft- und Raumfahrt- sowie Automobilindustrie.
Die Automotive Industry Action Group (AIAG) und VDA veröffentlichten 2019 ein gemeinsames FMEA-Handbuch, das nun als globaler Referenzstandard für DFMEA und PFMEA in der Automobilindustrie gilt und frühere Ausgaben beider Organisationen ersetzt.
FMEA-Typen
FMEA ist nicht einheitlich. Der Anwendungsbereich bestimmt, welchen Typ Sie benötigen.
| FMEA-Typ | Vollständige Bezeichnung | Schwerpunkt | Wann einsetzen |
|---|---|---|---|
| DFMEA | Design FMEA | Produktdesign und -komponenten | Während der Produktentwicklung, bevor das Design finalisiert ist |
| PFMEA | Process FMEA | Fertigungs- oder Dienstleistungsprozessschritte | Vor dem Start oder der Änderung eines Produktionsprozesses |
| SFMEA | System FMEA | Interaktion zwischen Teilsystemen | Komplexe Systeme, bei denen Fehler an den Schnittstellen am wichtigsten sind |
Design FMEA (DFMEA) untersucht, ob das Produktdesign selbst versagen könnte. Wenn eine Kunststoffkomponente unter Wärmestress bricht oder ein Softwaremodul unter hoher Last abstürzt, ist das ein Design-Fehlermodus. DFMEA findet statt, während Entwicklungsteams noch Zeichnungen oder Spezifikationen ändern können.
Process FMEA (PFMEA) untersucht, was beim Prozess, der das Produkt herstellt oder liefert, schiefgehen könnte. Selbst ein perfektes Design wird Fehler produzieren, wenn die Montageschritte fehlerhaft sind. PFMEA ist der häufigere Typ in Fertigung und Servicebetrieb und direkt mit Six-Sigma-Verbesserungsprojekten verknüpft.
System FMEA zoomt weiter heraus, um zu untersuchen, wie Teilsysteme interagieren. Sie ist in der Luft- und Raumfahrt sowie Verteidigung verbreitet, wenn der Fehlerpunkt keine einzelne Komponente ist, sondern die Schnittstelle zwischen ihnen.
Für die meisten Betriebs- und Qualitätsteams ist PFMEA der Ausgangspunkt. DFMEA begegnet Ihnen bei der Arbeit mit Produktentwicklung, und System FMEA hauptsächlich in stark regulierten Branchen.
RPN: Severity, Occurrence und Detection
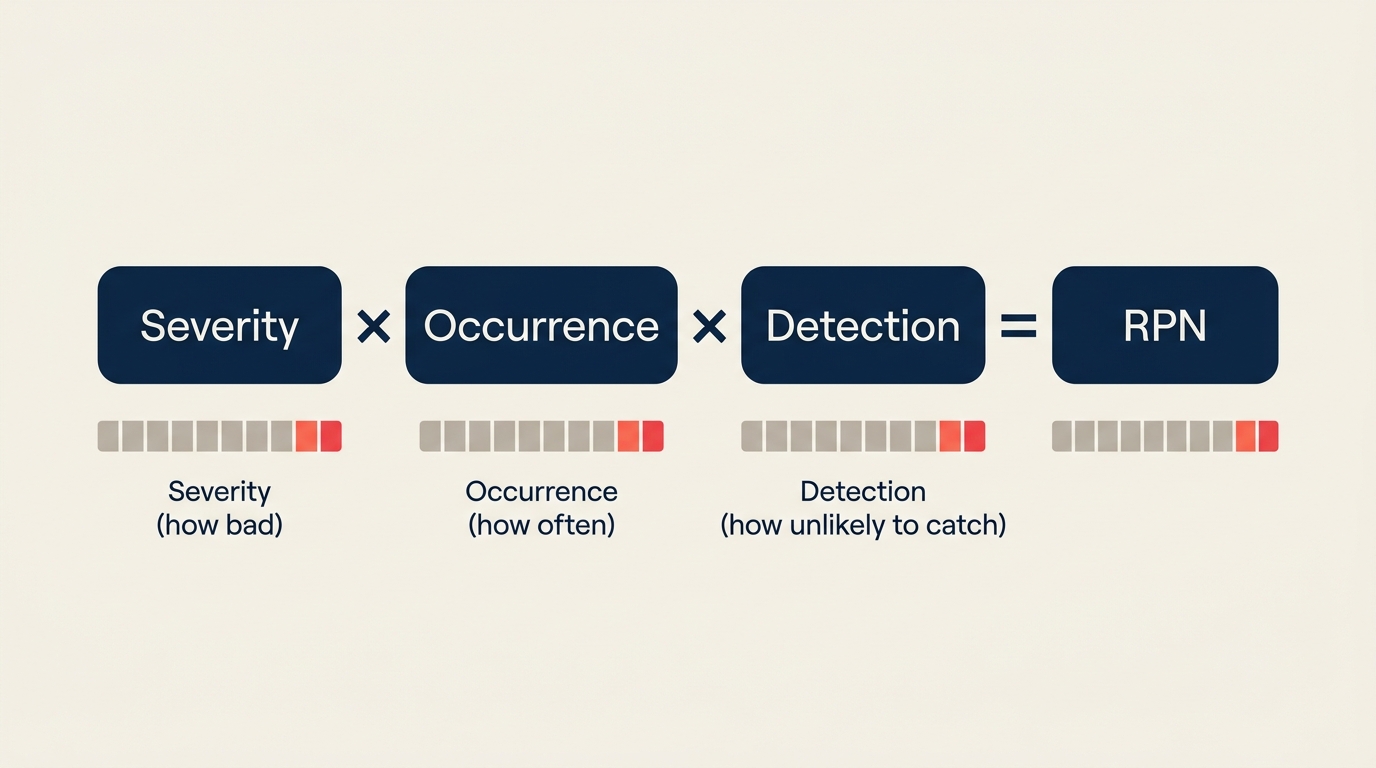
Die Risk Priority Number (RPN) ist der Kernbewertungsmechanismus der FMEA. Es ist eine einfache Formel:
RPN = Severity (S) x Occurrence (O) x Detection (D)
Jeder Faktor wird auf einer Skala von 1 bis 10 bewertet, sodass der RPN von 1 (vernachlässigbares Risiko) bis 1000 (maximales Risiko) reicht. Hier ist, was jede Dimension bedeutet und wie man sie bewertet:
Severity (S): Wie schlimm ist die Auswirkung, wenn dieser Fehler auftritt?
| Bewertung | Beschreibung |
|---|---|
| 1 | Keine Auswirkung auf Produkt oder Prozess |
| 2-3 | Geringfügige Auswirkung, Kunde bemerkt sie möglicherweise nicht |
| 4-6 | Mittlere Auswirkung, Kunde bemerkt sie und ist unzufrieden |
| 7-8 | Hohe Auswirkung, Produkt teilweise nicht funktionsfähig, Kunde sehr unzufrieden |
| 9 | Sehr hohe Schwere, Sicherheits- oder regulatorisches Problem mit Warnung |
| 10 | Gefährlich ohne Warnung, mögliche Verletzung oder Ausfall der Sicherheitsfunktion |
Occurrence (O): Wie häufig wird dieser Fehler wahrscheinlich auftreten?
| Bewertung | Beschreibung | Ungefähre Rate |
|---|---|---|
| 1 | Äußerst unwahrscheinlich | Weniger als 1 in 1.500.000 |
| 2-3 | Geringe Wahrscheinlichkeit | 1 in 150.000 bis 1 in 15.000 |
| 4-6 | Mittlere Wahrscheinlichkeit | 1 in 2.000 bis 1 in 400 |
| 7-8 | Hohe Wahrscheinlichkeit | 1 in 80 bis 1 in 20 |
| 9-10 | Sehr hoch, fast sicher | 1 in 8 oder häufiger |
Detection (D): Wie wahrscheinlich ist es, dass aktuelle Kontrollen den Fehler erkennen, bevor er den Kunden erreicht?
| Bewertung | Beschreibung |
|---|---|
| 1 | Nahezu sichere Erkennung; Kontrolle erkennt immer |
| 2-3 | Hohe Erkennungswahrscheinlichkeit |
| 4-6 | Mittlere Erkennungschance |
| 7-8 | Geringe Erkennungswahrscheinlichkeit; Kontrolle erkennt wahrscheinlich nicht |
| 9-10 | Keine bekannte Kontrolle; Fehler erreicht fast sicher den Kunden |
Beachten Sie, dass Detection kontraintuitiv ist: Eine Bewertung von 1 ist gut (Erkennung ist nahezu sicher), während eine Bewertung von 10 schlecht ist (keine Kontrollen vorhanden). Teams verwechseln dies oft, daher lohnt es sich, die Richtung mit Ihrem Team zu bestätigen, bevor mit der Bewertung begonnen wird.
Wie man eine FMEA durchführt
Eine gut durchgeführte FMEA folgt einer konsistenten Abfolge. Das Überspringen von Schritten, insbesondere Teamüberprüfung und Aktionsverfolgung, verwandelt FMEA in einen Papierkram statt in ein echtes Risikominderungswerkzeug.
Schritt 1: Das richtige Team zusammenstellen
FMEA funktioniert am besten als funktionsübergreifende Übung. Bringen Sie für eine PFMEA Prozessingenieure, Bediener, Qualitätspersonal und alle hinzu, die täglich den Prozess berühren. Bediener kennen oft Fehlermodi, die in der Dokumentation nie erscheinen. Streben Sie 4-7 Personen an; größere Gruppen verlangsamen die Bewertung ohne die Genauigkeit zu verbessern.
Schritt 2: Den Anwendungsbereich definieren
Einigen Sie sich darauf, welchen Prozess oder welches System die FMEA abdeckt. Ein SIPOC-Diagramm ist hier nützlich, um die Prozessgrenzen abzustecken. Ohne klaren Anwendungsbereich gehen Teams entweder zu breit vor (die FMEA wird unüberschaubar) oder zu eng (wichtige Fehlermodi fallen außerhalb der Grenze und werden übersehen).
Schritt 3: Alle Funktionen und Fehlermodi auflisten
Fragen Sie für jeden Prozessschritt oder jede Komponente: "Auf welche Weise könnte dieser Schritt seine beabsichtigte Funktion nicht erfüllen?" Ein Schritt kann mehrere Fehlermodi haben. Schreiben Sie sie auf dem richtigen Detailniveau. "Maschine versagt" ist zu vage. "Drehmomentschrauber bringt beim Anziehen der Schraube unzureichendes Drehmoment auf" ist umsetzbar.
Schritt 4: Auswirkungen und Ursachen identifizieren
Stellen Sie für jeden Fehlermodus zwei Dinge fest: Was passiert nachgelagert, wenn dieser Fehler auftritt (die Auswirkung), und was verursacht den Fehler zunächst. Ein Fishbone-Diagramm ist ein praktisches Werkzeug zum systematischen Brainstorming von Ursachen über Kategorien wie Ausrüstung, Materialien, Methoden und Personal.
Schritt 5: Severity, Occurrence und Detection bewerten
Verwenden Sie die oben genannten 1-10-Skalen. Bewerten Sie als Team, nicht als Einzelpersonen. Wenn die Bewertungen erheblich abweichen (eine Person sagt 3, eine andere 8), offenbart diese Meinungsverschiedenheit unterschiedliche Annahmen über den Prozess. Diese Gespräche sind wertvoll.
Schritt 6: RPN berechnen und priorisieren
Multiplizieren Sie S x O x D, um den RPN für jeden Fehlermodus zu erhalten. Sortieren Sie nach RPN absteigend. Viele Teams setzen einen RPN-Schwellenwert (üblicherweise 100 oder 125), oberhalb dessen Korrekturmaßnahmen erforderlich sind. Aber allein das RPN-Ranking erzählt nicht die ganze Geschichte. Ein Fehlermodus mit S=10 und RPN=80 verdient Aufmerksamkeit, auch wenn er unter dem Schwellenwert liegt, aufgrund der Schwere.
Schritt 7: Korrekturmaßnahmen definieren
Weisen Sie hochprioritären Fehlermodi eine spezifische Korrekturmaßnahme, einen verantwortlichen Eigentümer und ein Zielabschlussdatum zu. Maßnahmen sollten das Occurrence reduzieren (die Grundursache beheben) oder die Detection verbessern (eine Kontrolle hinzufügen). Das Reduzieren von Severity erfordert oft eine Designänderung, was in PFMEA schwieriger, aber in DFMEA möglich ist.
Verbinden Sie diesen Schritt mit Ihrem umfassenderen DMAIC- oder PDCA-Zyklus. FMEA identifiziert die Probleme; Ihr Verbesserungsprozess setzt die Lösungen um.
Schritt 8: RPN nach Maßnahmen neu berechnen
Sobald Korrekturmaßnahmen umgesetzt sind, bewerten Sie Occurrence und Detection neu (Severity ändert sich selten ohne eine Designänderung). Der neue RPN dokumentiert die erzielte Risikominderung und bestätigt, ob die Maßnahme funktioniert hat. Dieser abschließende Schritt ist das, was eine lebendige FMEA von einem einmaligen Dokument unterscheidet.
FMEA-Beispiel
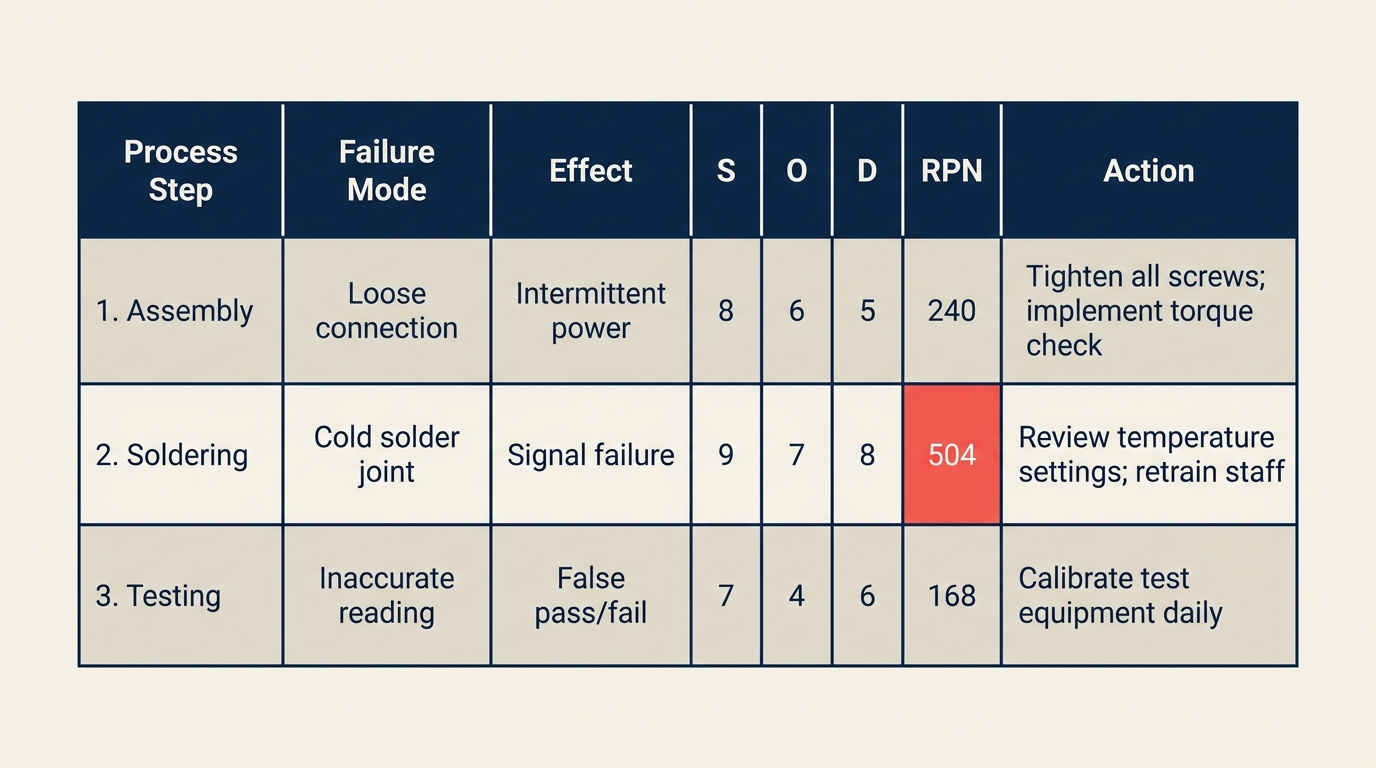
Nachfolgend ein PFMEA-Praxisbeispiel für eine Tabletten-Verpackungslinie in einer Pharmafabrik.
| Prozessschritt / Funktion | Fehlermodus | Auswirkung | S | Mögliche Ursache | O | Aktuelle Kontrollen | D | RPN | Empfohlene Maßnahme |
|---|---|---|---|---|---|---|---|---|---|
| Tablette in Blister füllen | Unterfüllung (fehlende Tablette) | Patient erhält unvollständige Dosis | 9 | Vision-System falsch kalibriert | 3 | Kamerainspektion alle 2 Stunden | 5 | 135 | Inspektionshäufigkeit auf alle 30 Min. erhöhen; Echtzeitalarm hinzufügen |
| Blisterfolie versiegeln | Schwache Versiegelung | Feuchtigkeitseintritt, reduzierte Haltbarkeit | 7 | Heizplatten-Temperatur unter Spezifikation | 4 | Manuelle Temperaturprüfung zu Schichtbeginn | 7 | 196 | Kontinuierliche Temperaturüberwachung mit automatischer Abschaltung installieren |
| Losnummer drucken | Unleserlicher Druck | Rückverfolgbarkeitsfehler, Rückrufrisiko | 8 | Tintenkartusche leer | 5 | Sichtprüfung durch Bediener | 6 | 240 | Tintenstandsensor mit Alarm vor Schwellenwert hinzufügen |
| Endverpackung in Karton | Falsches Produkt im Karton | Verwechslung, Patientensicherheitsrisiko | 9 | Kein Produktverifikationsschritt | 2 | Etikettenprüfung alle 100 Einheiten | 5 | 90 | Barcode-Scan-Verifikation an der Verpackungsstation hinzufügen |
| Kartonbeschriftung | Falsch angebrachtes Etikett | Nichtkonformes Produkt wird versendet | 6 | Etikettenzuführung Spannung inkonsistent | 3 | Prüfung am Schichtende | 7 | 126 | Etikettenzuführung wöchentlich kalibrieren; Online-Inspektionskamera hinzufügen |
In diesem Beispiel hat "Unleserlicher Druck" mit 240 den höchsten RPN. Die Korrekturmaßnahme zielt auf die Grundursache (geringe Tinte wird nicht erkannt) ab, anstatt einfach mehr nachgelagerte Inspektionen hinzuzufügen.
FMEA im Vergleich mit anderen Risikobewertungswerkzeugen
FMEA ist eines von mehreren Werkzeugen zur Analyse von Fehlern und Ursachen. Hier ist der Vergleich mit den am häufigsten verwendeten.
| Werkzeug | Primäre Frage | Ergebnis | Am besten für |
|---|---|---|---|
| FMEA | Was könnte versagen, wie schlimm ist es und kann es erkannt werden? | Bewertetes Arbeitsblatt mit RPN-Prioritäten | Proaktive Risikopriorisierung vor oder während Prozessänderungen |
| Fishbone-Diagramm | Was sind die möglichen Ursachen dieses Problems? | Visuelle Ursachenkarte nach Kategorien gegliedert | Brainstorming der Grundursachen nach dem Auftreten eines Fehlers |
| 5 Whys | Was ist die Grundursache dieses spezifischen Problems? | Ursachenkette bis zur Grundursache | Schnelle Ursachenanalyse für ein bekanntes Problem |
| HAZOP | Was ist, wenn diese Prozessvariable von der Auslegung abweicht? | Abweichungsbasierte Risikotabelle | Chemische, Prozess- und Anlagensicherheitsanalyse |
FMEA und das Fishbone-Diagramm ergänzen sich natürlich. Verwenden Sie das Fishbone, um alle potenziellen Ursachen für einen Fehlermodus zu sammeln (Schritt 4 oben), dann FMEA, um diese Ursachen zu bewerten und zu priorisieren. Sie führen sie oft in derselben Sitzung durch.
Total Quality Management-Programme betten FMEA typischerweise als Standardwerkzeug in ihr Qualitätsplanungs-Toolkit ein, insbesondere bei Prozessdesign-Reviews.
Häufige Fehler und Best Practices
Zu vermeidende Fehler:
- Als Einzelperson bewerten. Eine FMEA, die allein durchgeführt wird, produziert optimistische Bewertungen. Teambewertungen zeigen Meinungsverschiedenheiten auf, die echte Wissenslücken über den Prozess offenbaren.
- Neubewertung überspringen. Wenn Sie nach der Umsetzung von Maßnahmen nicht neu bewerten, haben Sie keinen Beleg dafür, dass sich etwas verbessert hat. Der Vorher/Nachher-RPN-Vergleich ist der Beweis.
- FMEA als Checkbox verwenden. Ein fertiggestellter FMEA-Ordner, den niemand liest, ist wertlos. Das Dokument ist nur so wertvoll wie die Maßnahmen, die es antreibt.
- Jeden hohen RPN gleich behandeln. Ein RPN von 200 mit S=10, O=2, D=10 hat ein anderes Risikoprofil als S=5, O=8, D=5. Betrachten Sie die einzelnen Bewertungen, nicht nur die Gesamtsumme.
- Niedrige-RPN-Punkte mit hoher Severity ignorieren. Ein S=10-Fehler, der derzeit selten ist (O=1), kann häufig werden, wenn sich Volumen, Materialien oder Bediener ändern. Markieren Sie hochschwerwiegende Punkte zur Überwachung, auch wenn der RPN niedrig ist.
Best Practices:
- Beginnen Sie mit einer Value Stream Map oder Prozesslandkarte vor der FMEA-Sitzung. Teams bewerten besser, wenn sie den Prozess visuell sehen können.
- Überprüfen Sie die FMEA bei jeder Prozessänderung, nicht nur beim erstmaligen Start.
- Halten Sie ein lebendes Dokument anstatt einer Momentaufnahme zu einem bestimmten Zeitpunkt. Aktualisieren Sie Occurrence- und Detection-Bewertungen, wenn Kontrollen hinzugefügt werden.
- Verknüpfen Sie jede Korrekturmaßnahme mit Ihren Standard Operating Procedures, sodass die Lösung Teil des normalen Betriebs wird.
- Kombinieren Sie FMEA mit Lean-Methoden-Prozessüberprüfungen, um sowohl Verschwendung als auch Risiko in einem einzigen Durchgang zu erfassen.
Häufig gestellte Fragen
Wofür steht FMEA? FMEA steht für Failure Mode and Effects Analysis. Der Name beschreibt genau, was das Werkzeug tut: Es identifiziert Fehlermodi (die Arten, wie ein Prozess oder Produkt versagen kann), analysiert ihre Auswirkungen (was passiert, wenn sie versagen) und bewertet sie, sodass Teams die wichtigsten Risiken priorisieren können.
Was ist ein RPN in FMEA? RPN steht für Risk Priority Number. Er wird berechnet, indem drei Bewertungen multipliziert werden, die jeweils auf einer 1-10-Skala liegen: Severity (wie schlimm die Fehlerauswirkung ist), Occurrence (wie oft der Fehler wahrscheinlich auftritt) und Detection (wie unwahrscheinlich es ist, dass aktuelle Kontrollen ihn erkennen). Die Formel lautet: RPN = S x O x D. Das Ergebnis reicht von 1 bis 1000. Höhere RPNs weisen auf Fehlermodi mit höherer Priorität hin, die Korrekturmaßnahmen erfordern.
Was ist der Unterschied zwischen DFMEA und PFMEA? Design FMEA (DFMEA) analysiert potenzielle Fehler im Produktdesign, bevor das Design finalisiert ist. Sie wird von Produktentwicklungs- und Entwicklungsteams eingesetzt. Process FMEA (PFMEA) analysiert potenzielle Fehler im Fertigungs- oder Dienstleistungsprozess, der das Produkt herstellt oder liefert. PFMEA wird von Betriebs- und Qualitätsteams eingesetzt und ist der häufigere Typ in der täglichen Prozessverbesserungsarbeit.
Wann sollten Sie FMEA einsetzen? FMEA ist am wertvollsten, bevor ein Problem auftritt, nicht danach. Verwenden Sie sie beim Start eines neuen Prozesses oder Produkts, vor einer wesentlichen Prozessänderung, während der Improve-Phase eines Six-Sigma-DMAIC-Projekts oder bei jeder regulatorischen Qualitätsplanungsüberprüfung (üblich bei Medizinprodukten, in der Automobilindustrie und Luft- und Raumfahrt). Es ist ein proaktives Werkzeug, kein reaktives. Nach einem Problem ist ein Fishbone-Diagramm oder eine 5-Whys-Analyse schneller und gezielter.
Welcher RPN-Schwellenwert sollte eine Korrekturmaßnahme auslösen? Es gibt keine universelle Regel, aber ein üblicher Ausgangspunkt ist ein RPN über 100-125. Aber der RPN allein sollte nicht der einzige Auslöser sein. Jeder Fehlermodus mit einer Severity von 9 oder 10 verdient Aufmerksamkeit unabhängig vom RPN, weil die Folge dieses Fehlers zu schwerwiegend ist, um ihn unbehandelt zu lassen. Viele Teams verwenden eine Kombination: obligatorische Maßnahme bei RPN über 100, plus obligatorische Überprüfung bei S größer oder gleich 9.
FMEA funktioniert, weil sie eine Frage, die jedes Betriebsteam bereits stellt ("Was könnte schiefgehen?"), in eine bewertete, priorisierte Liste mit Verantwortlichen und Fristen verwandelt. Die Strenge macht den Unterschied. Teams, die sie als lebendes Dokument behandeln und die Korrekturmaßnahmen abschließen, übertreffen konsistent diejenigen, die das Arbeitsblatt ausfüllen und ablegen.

Senior Operations & Growth Strategist
On this page
- Was ist FMEA?
- Key Facts
- FMEA-Typen
- RPN: Severity, Occurrence und Detection
- Severity (S): Wie schlimm ist die Auswirkung, wenn dieser Fehler auftritt?
- Occurrence (O): Wie häufig wird dieser Fehler wahrscheinlich auftreten?
- Detection (D): Wie wahrscheinlich ist es, dass aktuelle Kontrollen den Fehler erkennen, bevor er den Kunden erreicht?
- Wie man eine FMEA durchführt
- Schritt 1: Das richtige Team zusammenstellen
- Schritt 2: Den Anwendungsbereich definieren
- Schritt 3: Alle Funktionen und Fehlermodi auflisten
- Schritt 4: Auswirkungen und Ursachen identifizieren
- Schritt 5: Severity, Occurrence und Detection bewerten
- Schritt 6: RPN berechnen und priorisieren
- Schritt 7: Korrekturmaßnahmen definieren
- Schritt 8: RPN nach Maßnahmen neu berechnen
- FMEA-Beispiel
- FMEA im Vergleich mit anderen Risikobewertungswerkzeugen
- Häufige Fehler und Best Practices
- Häufig gestellte Fragen