Value Stream Mapping: How to Map and Improve a Process (Symbols + Examples)
Turn this article into takeaways for your work.


Each assistant summarizes the article only for you and suggests best practices for your work.
Most ops leaders who run their first value stream mapping (VSM) exercise walk away with the same uncomfortable discovery: roughly 80% of total lead time is waiting, not working. The work itself is fast. The gaps between the work are where time disappears.
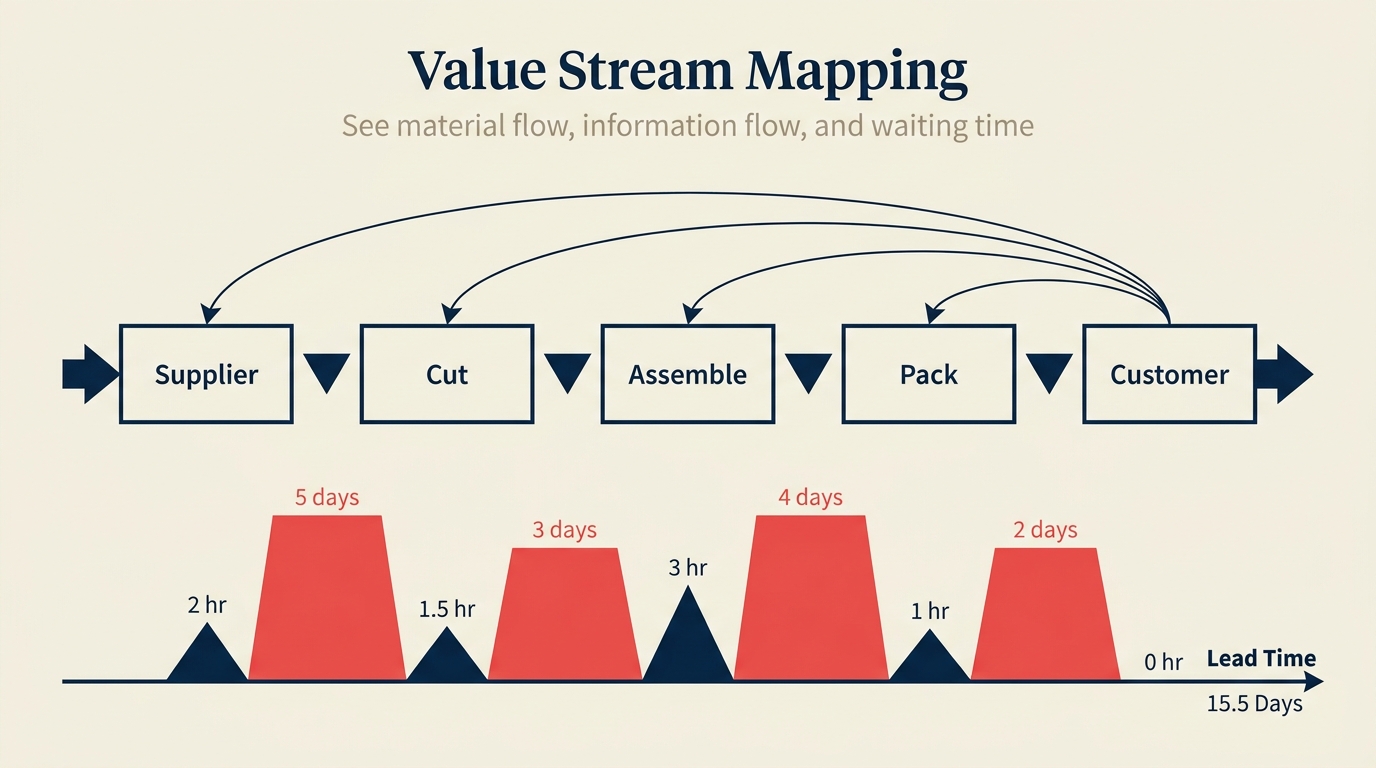
VSM makes that visible in a single diagram, every process step, every inventory buffer, every information trigger, laid out from supplier to customer with a timeline below. Once you can see it all at once, the places worth fixing become obvious.
What is value stream mapping?
Value stream mapping is a lean tool that visualizes the complete, end-to-end flow of materials and information required to deliver a product or service to a customer. The output is a diagram, typically hand-drawn first, that captures every step a request or unit of product travels through, together with data boxes showing how long each step takes, how much work-in-progress sits between steps, and how information moves through the system.
The method has its roots in Toyota's material and information flow diagrams, developed as part of the Toyota Production System (TPS) during the 1980s. Toyota's engineers used these diagrams to teach factory-floor teams where waste was hiding and which changes would have the biggest impact on throughput. The approach entered mainstream English-language practice in 1999 when Mike Rother and John Shook published Learning to See (Lean Enterprise Institute), the book that standardized the symbols and the two-map approach, current state, then future state, that practitioners still use today.
VSM differs from a standard process map in one critical way: it treats the value stream as the unit of analysis, not the individual task. A process map asks "what happens?" VSM asks "what happens, how long does it take, how much waits between each step, and which of those activities actually matter to the customer?"
Key Facts
- Mike Rother and John Shook formalized VSM in Learning to See (Lean Enterprise Institute, 1999), standardizing the symbols and two-map approach still in use globally.
- Research from the Lean Enterprise Institute and Womack and Jones' Lean Thinking (Free Press, 1996) found that in most manufacturing value streams, only around 5% of total lead time consists of value-adding activity, the rest is transport, waiting, and overprocessing.
- A 2021 study in the International Journal of Production Research found VSM adoption has expanded strongly into healthcare, software, and financial services, well beyond its manufacturing origins.
VSM symbols you need to know
VSM uses a shared visual language so that any team member can read a map without a legend. These are the symbols you'll use on almost every map:
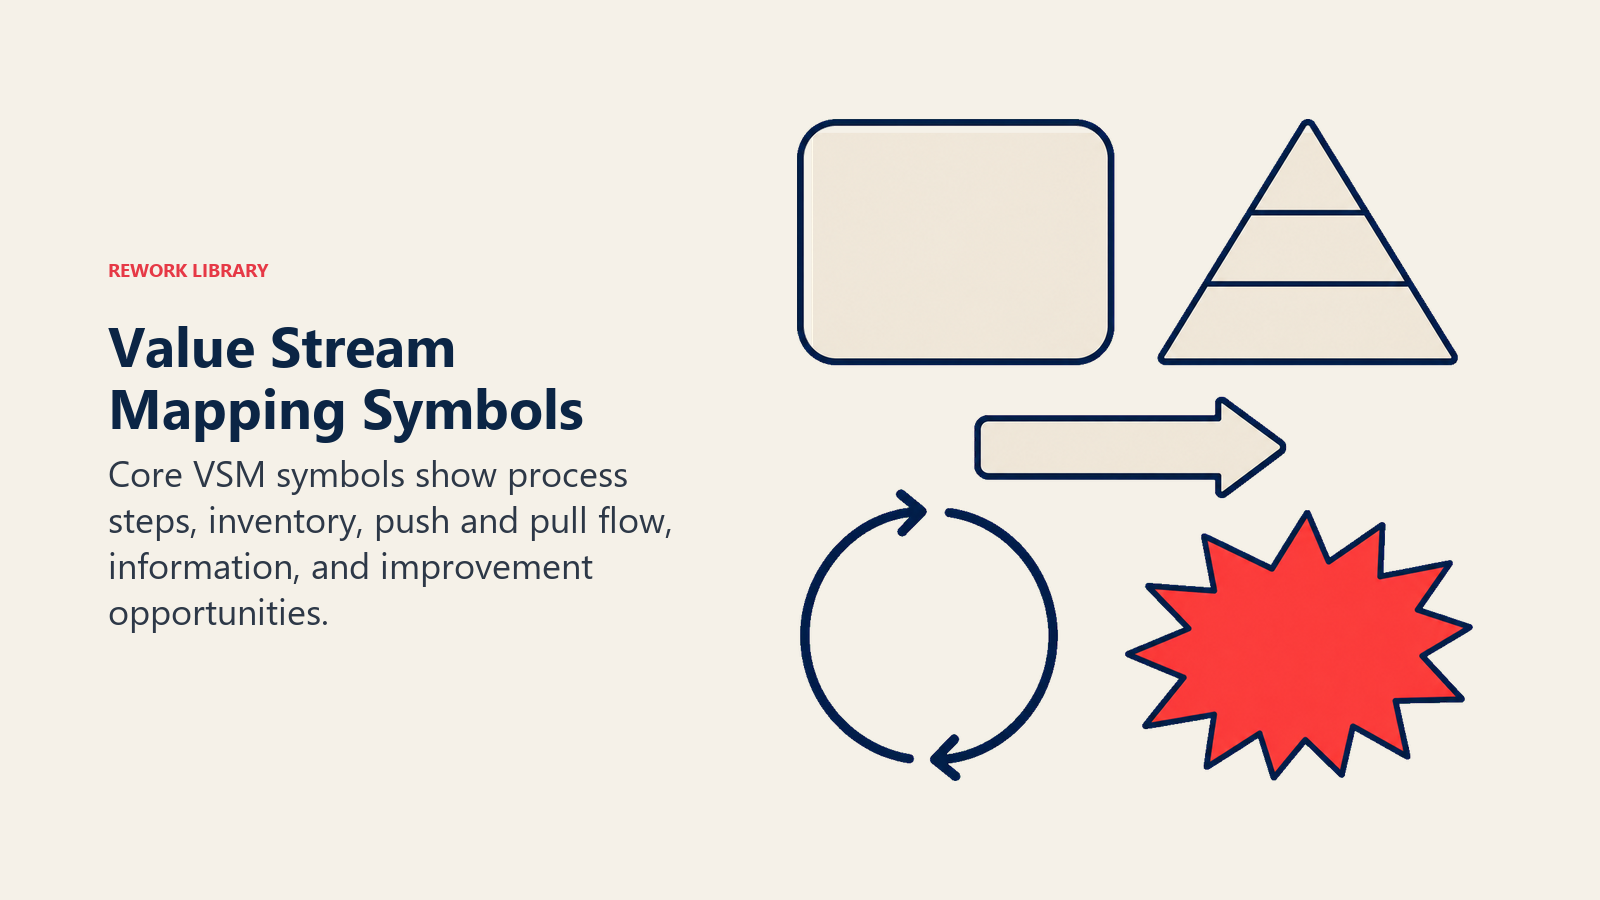
| Symbol | Name | What it means |
|---|---|---|
| Rectangle | Process box | A step where work is done. Label it with the activity name and attach a data box below (cycle time, changeover time, uptime, operators). |
| Filled triangle with I | Inventory triangle | Work-in-progress (WIP) or stock sitting between two process steps. Label with quantity and, where known, time in queue. |
| Striped push arrow | Push arrow | Material or work is pushed forward by the upstream step regardless of whether downstream is ready. Common in batch environments. |
| Curved pull arrow | Pull arrow | Downstream step signals upstream to produce or release work. Indicates a pull system rather than a push system. |
| Narrow rectangle labeled FIFO | FIFO lane | A controlled queue where items flow in the same order they enter. Limits WIP and prevents cherry-picking. |
| Open-sided rectangle | Supermarket | A controlled inventory buffer that downstream pulls from. The upstream step replenishes only what was consumed. |
| Jagged starburst | Kaizen burst | A specific improvement opportunity identified on the map. Marks where waste is concentrated and change will be focused. |
| Circle with head | Operator | The number of people working at that process step. |
| Truck silhouette | Truck shipment | Physical delivery from a supplier or to a customer, usually labeled with frequency. |
| Straight arrow | Information flow | The flow of instructions, schedules, or orders between steps or to/from an external source. |
| Straight line with tick | Manual information | Paper-based or verbal information flow, as distinct from electronic. |
| Sawtooth rectangle | External source | A supplier or customer who sits outside the value stream boundary. Usually placed at the far left (supplier) and far right (customer). |
You don't need every symbol on every map. Start with the process box, inventory triangle, push arrow, and information flow line. Add the rest as your map demands them.
How to build a value stream map in 6 steps
Building a VSM is a physical, team-based activity. The best maps are drawn in pencil, on paper, on a wall, not in software, at least not first.
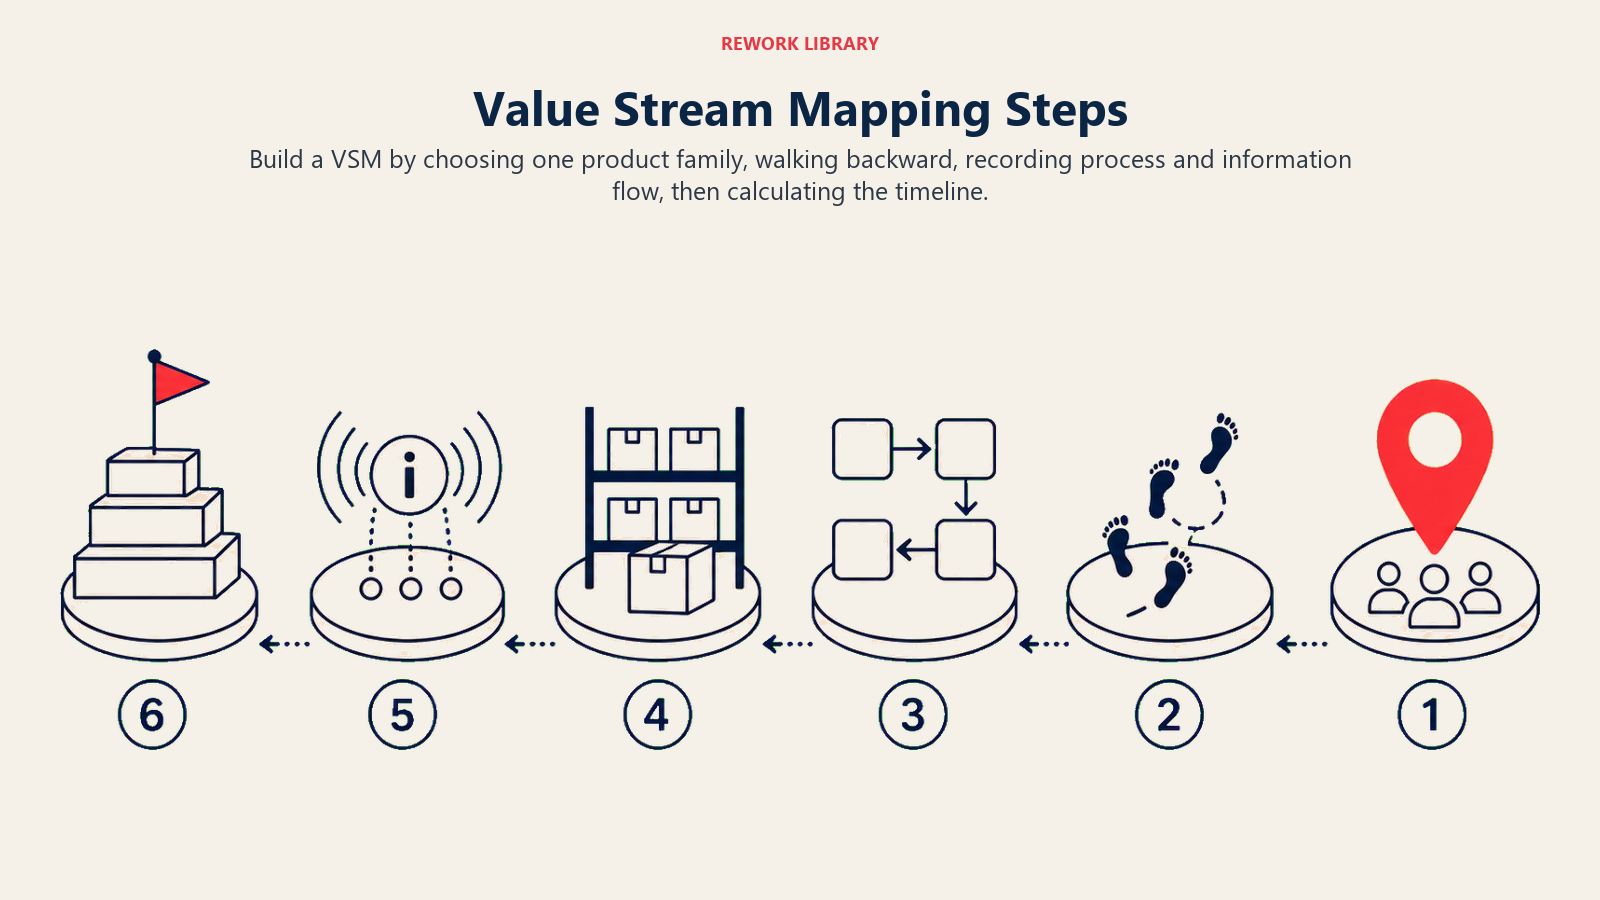
Step 1: Pick your product family
Don't map everything. Choose one product family, a group of products or services that pass through the same sequence of process steps. A map that tries to show every variant becomes unreadable. A focused map exposes real waste.
Step 2: Walk the process backward from the customer
Start at the customer end and physically walk upstream. Don't rely on how people think the process works. Watch what actually happens, in the sequence it actually happens. Walking backward prevents you from drawing the "intended" process instead of the real one.
Step 3: Capture process boxes and data boxes
For each step, draw a process box. Below it, draw a data box with at least: cycle time (CT), changeover time (CO), and number of operators. These numbers are what make the future-state map credible, you can't improve what you haven't measured.
Step 4: Add material flows
Draw inventory triangles between process boxes. Label each with the current WIP count or, if known, the average time material sits there. Add push arrows or pull arrows to show how work moves between steps.
Step 5: Add information flows
Draw how information moves through the system. Who schedules each step? Does production planning push a weekly schedule to the floor? Does an order management system trigger releases? These information flows often reveal where poor scheduling creates the waiting shown in the inventory triangles.
Step 6: Draw the timeline
Below the process boxes and inventory triangles, draw a stepped timeline. The peaks below the line show process time at each step. The plateaus above the line show wait time between steps. Sum the plateaus to get lead time. Sum the peaks to get total process time.
Current state vs future state
A VSM exercise produces two maps, not one.
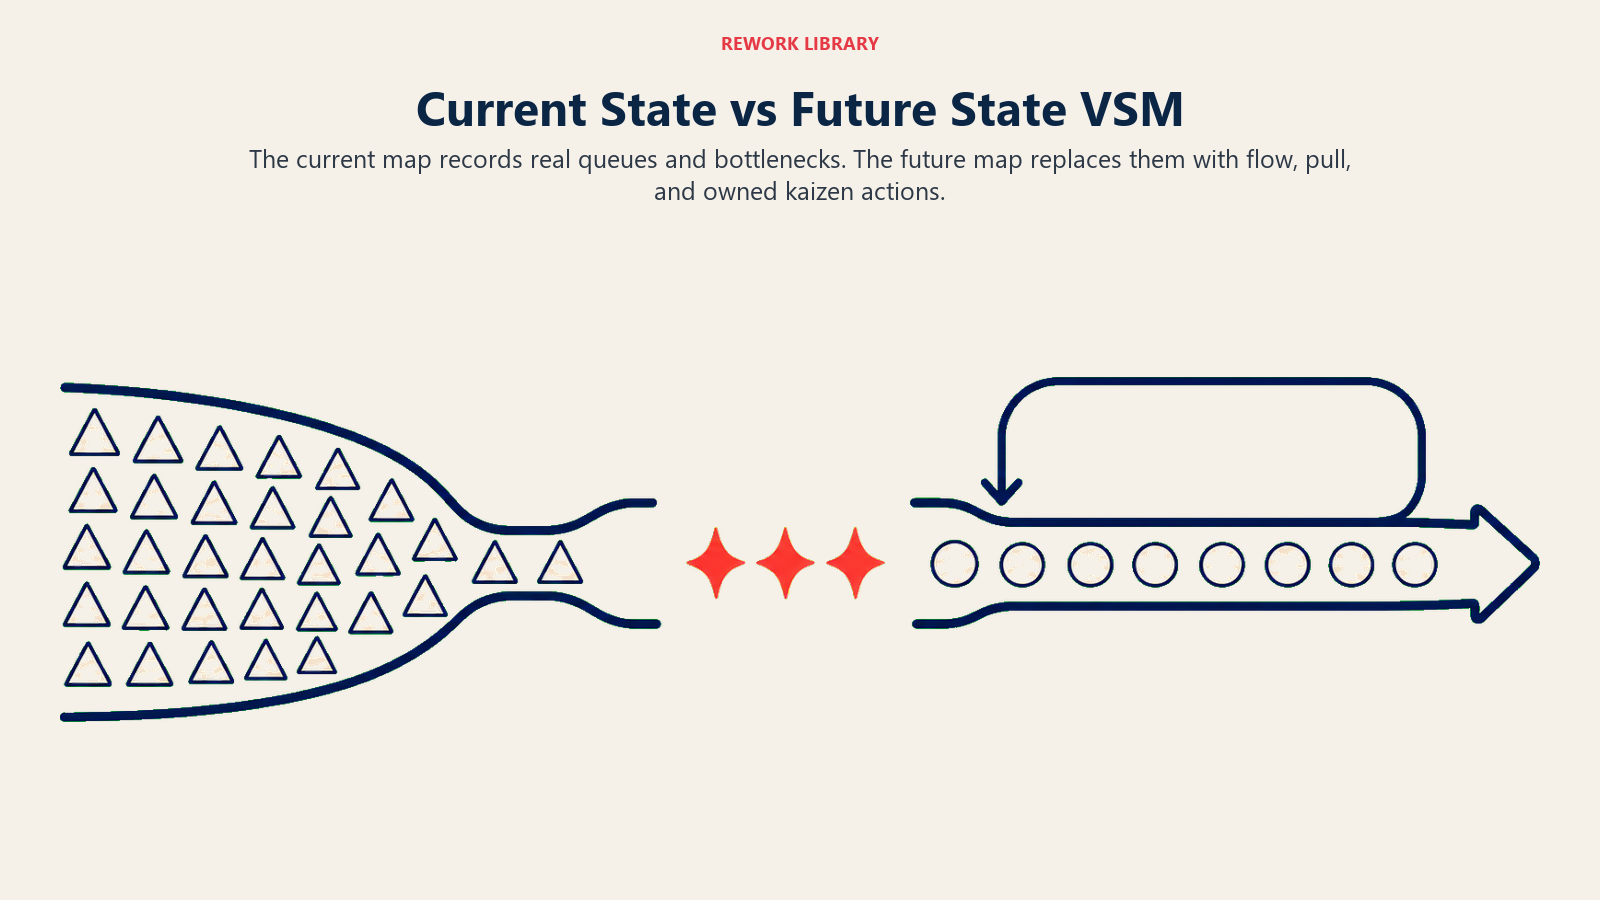
The current state map is a truthful picture of the value stream as it exists today, every bottleneck, every pile of WIP, every scheduling handoff. Its purpose is not to embarrass anyone. It's to give the team a shared, accurate baseline that everyone has seen and agreed on.
The future state map is the lean ideal you'll work toward. You don't guess at it. You build it from the current state by asking: where is the customer-defined takt time (the rate at which customers demand product)? Which step sets the pace for the whole flow? Where can we introduce pull instead of push? Where should we create continuous flow and eliminate the queues between steps?
Kaizen bursts are how you bridge the two maps. Mark each area where you'll attack waste with a jagged kaizen burst on the current state. Each burst becomes a specific improvement project with an owner and a deadline. The future state map shows what the value stream will look like once those projects land.
The practical discipline here is to avoid jumping straight to solutions. Draw the current state honestly before you design the future state. Teams that skip straight to "what should it look like" tend to draw idealized processes that don't reflect the constraints the floor is actually working within.
Calculating lead time vs process time
The timeline at the bottom of a VSM diagram tracks two distinct numbers, and confusing them leads to bad improvement decisions.
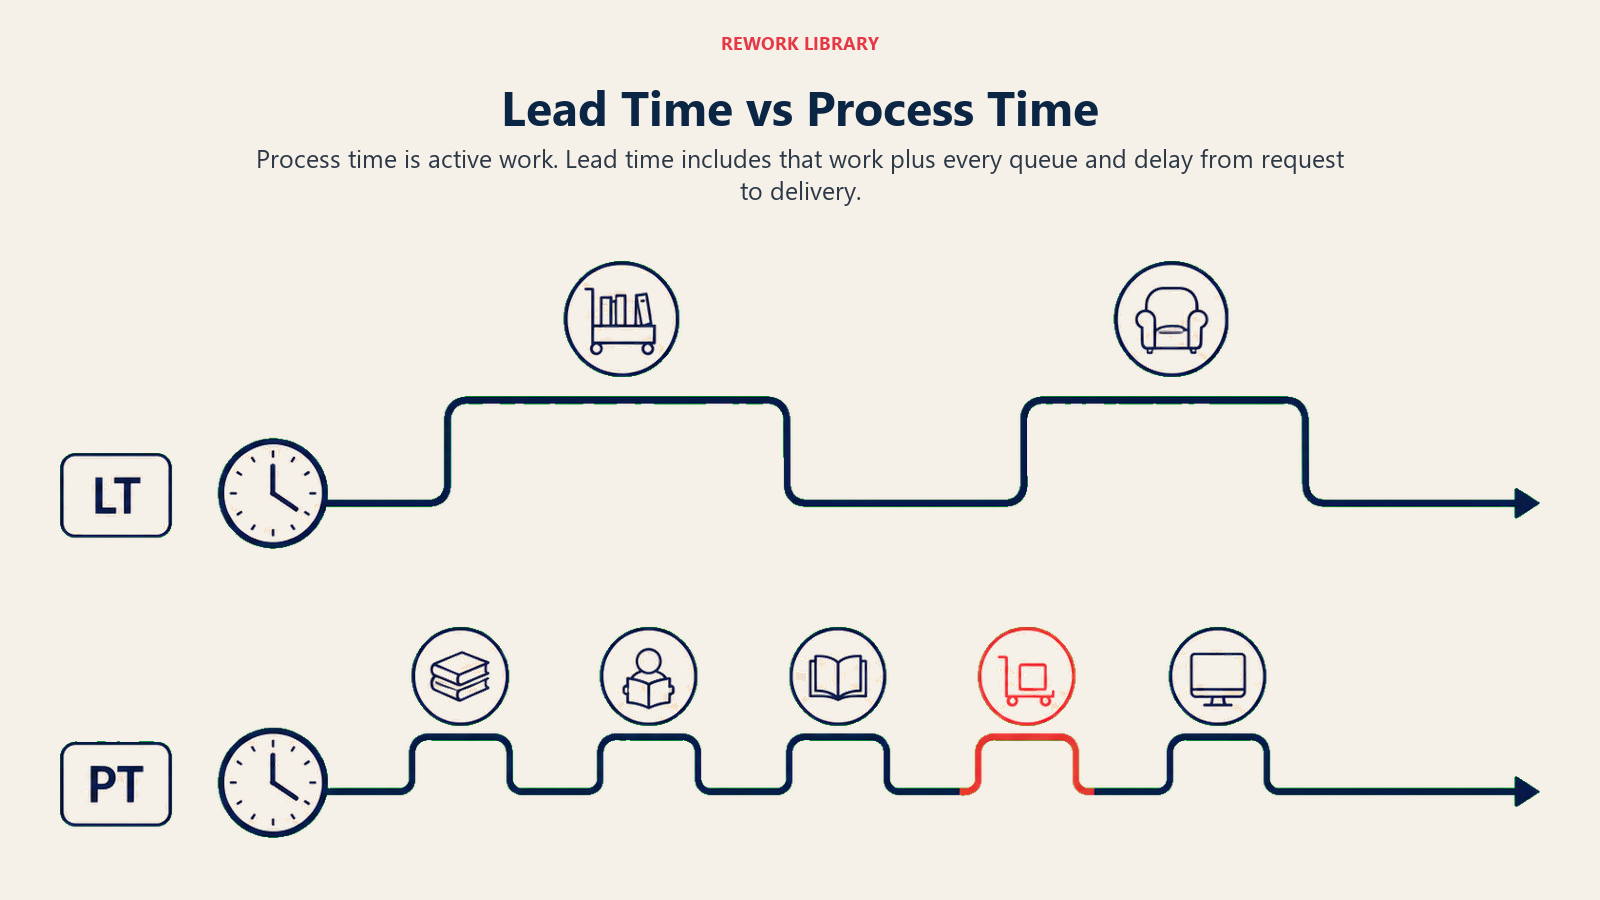
Process time (PT) is the value-adding time at each step, how long a unit is actually being worked on. It's represented below the timeline as small peaks.
Lead time (LT) is the total elapsed time from the moment a customer request enters the value stream to the moment the customer receives the output. It includes all the waiting between steps, not just the work time. It's represented by the tall plateaus above the timeline.
Process Cycle Efficiency (PCE) = Process Time / Lead Time. A PCE below 10% is common in manufacturing and office processes. Raising it is the core goal of every future-state map.
Here's a simple worked example:
| Step | Process time | Wait time (inventory) |
|---|---|---|
| Order intake | 5 min | 4 hours |
| Credit check | 10 min | 2 hours |
| Pick and pack | 15 min | 1 hour |
| Ship | 5 min | 30 min |
| Total | 35 min | 7.5 hours |
Lead time = 35 min + 7.5 hours = roughly 8 hours. Process time = 35 minutes. PCE = 35 / 480 = 7.3%.
The goal isn't to speed up the 35 minutes of work. The goal is to shrink the 7.5 hours of waiting.
Worked example: an invoice approval value stream
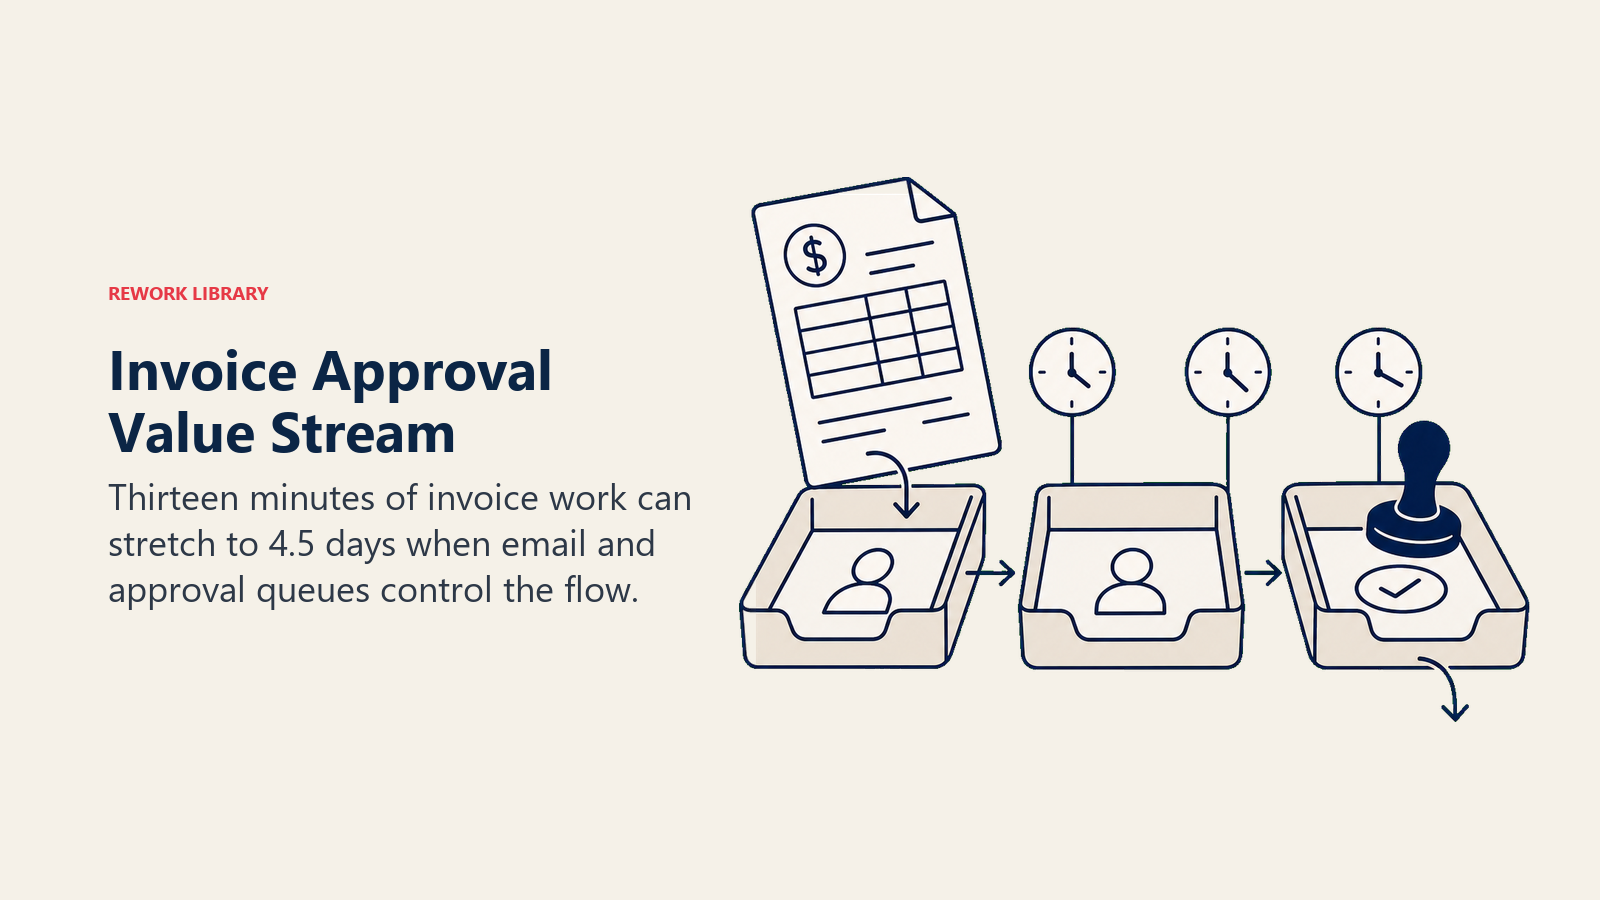
Consider a finance team that processes vendor invoices. The current state looks like this:
| Step | Cycle time | WIP in queue | Queue time |
|---|---|---|---|
| Invoice received | 2 min | 20 invoices | 2 days |
| Manager review | 5 min | 12 invoices | 1.5 days |
| Finance approval | 3 min | 8 invoices | 1 day |
| Payment release | 2 min | 5 invoices | 4 hours |
| Supplier notified | 1 min | 0 | 0 |
Total process time: 13 minutes. Total lead time: approximately 4.5 days. PCE: roughly 0.3%.
The kaizen bursts fall on the "Invoice received" queue (2 days of unprocessed invoices sitting in an email inbox) and on "Manager review" (batch processing once per day instead of on receipt). The future state cuts lead time to under 1 day by introducing a pull trigger, the manager reviews within 4 hours of receipt, and the finance system auto-releases payments within 2 hours of approval.
Nothing about the 13 minutes of actual work changes. The entire gain comes from attacking wait time.
VSM vs process map vs swimlane diagram
VSM is often confused with other diagramming tools. Here's how they differ:
| Tool | Shows | Scale | Best for |
|---|---|---|---|
| Value stream map | Material flow + information flow + timeline + waste data | End-to-end value stream (supplier to customer) | Finding where wait time and WIP are concentrated; building the case for Lean improvement |
| Process map / flowchart | Steps and decision points in sequence | One process or subprocess | Documenting how a process works; onboarding; standard operating procedures |
| Swimlane diagram | Which role or team handles each step | One cross-functional process | Mapping handoffs between departments; finding accountability gaps |
Choose VSM when you want to quantify waste. Choose a process map when you want to document steps. Use a swimlane when handoffs between teams are the core issue you're investigating.
The 8 wastes VSM helps you find
Every VSM session is, at its core, a waste-finding exercise. Lean methodology identifies 8 types of waste, sometimes remembered by the acronym DOWNTIME:
- Defects, errors that require rework or scrapping, consuming time with no value created
- Overproduction, producing more than the customer needs right now, creating WIP that has to wait
- Waiting, time when work sits idle between steps, which is exactly what the VSM timeline makes visible
- Non-utilized talent, skills and knowledge that the system never taps
- Transport, unnecessary movement of materials, documents, or data between locations
- Inventory, WIP, finished goods, or information sitting in queues beyond what's needed
- Motion, unnecessary physical or digital movement by people doing the work, which a spaghetti diagram makes visible on a floor plan
- Extra processing, steps that add no customer value, such as re-entering data that already exists or approvals that don't change outcomes
VSM is particularly good at surfacing waiting and inventory waste because those two show up directly on the timeline and in the inventory triangles. The other six often appear when you dig into the data boxes at each process step.
Common mistakes when running a VSM
Even teams with good intentions make the same handful of errors on their first few maps:
- Mapping the process they wish existed, not the one that does. Walk the floor. Talk to the people doing the work. The actual flow almost always has workarounds and detours that don't show up in documented procedures.
- Skipping the data boxes. A VSM without numbers is a decoration. Cycle time, WIP count, and queue time are what connect the diagram to real improvement decisions.
- Drawing it in software first. Sticky notes and pencil on butcher paper keep the team engaged and the map easy to revise. Jumping to Visio or Miro before the current state is agreed on tends to anchor everyone to the first version.
- Building the future state map in isolation. The future state should be designed by the same cross-functional team that drew the current state. Designing it in a conference room without floor involvement produces a future state no one on the floor owns.
- Treating the map as the output. The map is only useful if it produces kaizen projects with owners and deadlines. A map on a wall that nobody acts on is just documentation.

On this page
- What is value stream mapping?
- VSM symbols you need to know
- How to build a value stream map in 6 steps
- Step 1: Pick your product family
- Step 2: Walk the process backward from the customer
- Step 3: Capture process boxes and data boxes
- Step 4: Add material flows
- Step 5: Add information flows
- Step 6: Draw the timeline
- Current state vs future state
- Calculating lead time vs process time
- Worked example: an invoice approval value stream
- VSM vs process map vs swimlane diagram
- The 8 wastes VSM helps you find
- Common mistakes when running a VSM