Full-Funnel Conversion Rates: How RevOps Tracks Revenue Flow
Full-funnel conversion rates show how records move from first touch to revenue and expansion.
A single conversion rate is rarely enough. RevOps should track conversion by stage, source, segment, motion, and time period.
Harvard Business Review's sales and marketing alignment research is a useful warning for conversion reporting: teams often think they agree on funnel stages until the numbers expose different definitions. McKinsey's B2B growth research also reinforces why connected commercial systems matter when growth gets harder to sustain.
Conversion rates are only useful when the stages behind them are governed.
Key operating facts
- Full-funnel conversion should track how demand becomes pipeline, revenue, renewal, and expansion, not only how leads become opportunities.
- Conversion rates need stage definitions, source rules, time windows, and segment cuts before leaders can trust them.
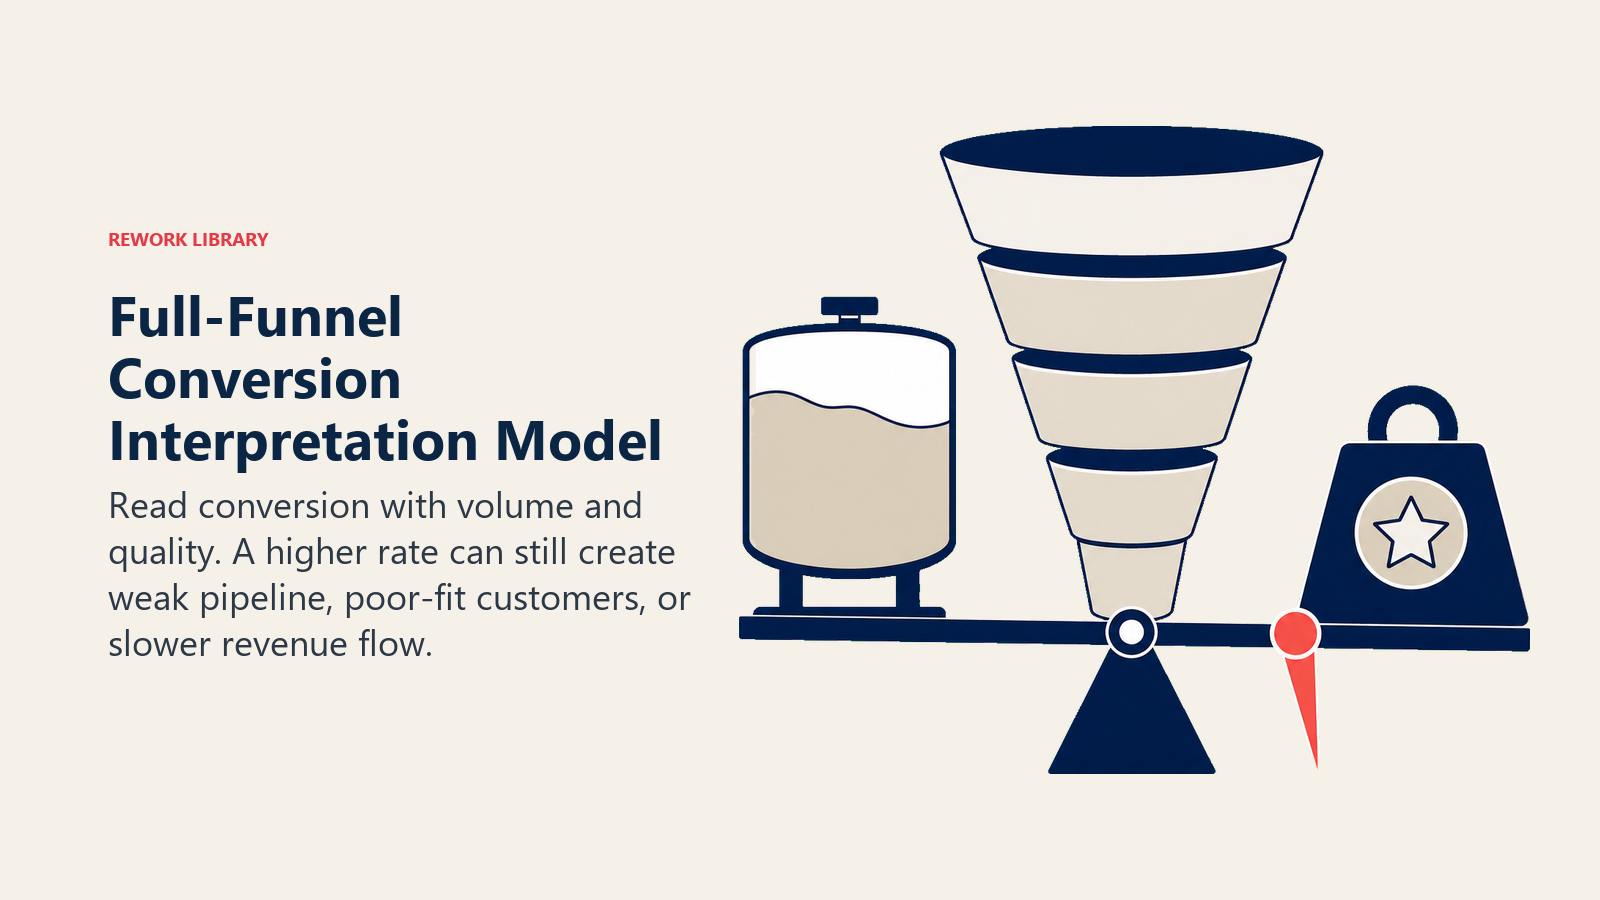
- A high conversion rate can still be bad if it creates weak pipeline or poor-fit customers. Always pair conversion with quality.
- RevOps should use conversion changes to decide where to inspect: source quality, routing, acceptance, opportunity criteria, stage aging, customer fit, or expansion triggers.
Core conversion rates
| Conversion | Question |
|---|---|
| Visitor to lead | Does traffic create identifiable demand? |
| Lead to MQL | Does captured demand meet qualification rules? |
| MQL to SQL | Does sales accept marketing-qualified demand? |
| SQL to opportunity | Does accepted demand become pipeline? |
| Opportunity to closed-won | Does pipeline become revenue? |
| Customer to renewal | Does the customer stay? |
| Customer to expansion | Does the account grow? |
Use Lead Conversion Rate and RevOps Metrics as deeper references.
Why full-funnel beats isolated conversion
Isolated conversion metrics can hide the real issue.
Marketing may show strong visitor-to-lead conversion, but sales may reject the leads. Sales may show high SQL-to-opportunity conversion, but opportunities may stall in early stage. Customer success may show stable renewals, but expansion signals may never become pipeline.
Full-funnel conversion connects the steps:
- Demand creation
- Qualification
- Sales acceptance
- Pipeline creation
Interpretation model
Conversion rates should be interpreted with quality and volume.
Turn this article into takeaways for your work.
Each assistant summarizes the article only for you and suggests best practices for your work.
| Pattern | What it may mean |
|---|---|
| High lead conversion, low sales acceptance | Capture is strong but qualification or targeting is weak |
| Low MQL-to-SQL, high win rate | Criteria may be strict, but accepted demand is high quality |
| High SQL-to-opportunity, low win rate | Opportunities may be created too early |
| Low opportunity conversion, high expansion | Acquisition may be weak while customer value is strong |
| High renewal, low expansion | Customers stay but growth motion is underdeveloped |
This keeps teams from optimizing one conversion point at the expense of the system. A campaign that creates many low-fit leads can improve top-of-funnel conversion while hurting sales productivity. A strict qualification process can reduce volume while improving win rate. RevOps should show the tradeoff, not only the rate.
- Deal progression
- Closed-won revenue
- Retention
- Expansion
This gives leaders a flow view instead of a local performance view.
Conversion by stage
RevOps should define conversion rates with clear numerators and denominators.
| Metric | Formula | What it diagnoses |
|---|---|---|
| Lead capture rate | Leads divided by visitors or sessions | Whether traffic converts to identifiable demand |
| MQL rate | MQLs divided by leads | Whether captured demand meets qualification rules |
| SQL acceptance rate | Accepted SQLs divided by MQLs routed | Whether sales trusts qualified demand |
| Opportunity creation rate | Opportunities divided by SQLs | Whether accepted leads become real pipeline |
| Win rate | Closed-won opportunities divided by qualified opportunities | Whether pipeline converts to revenue |
| Renewal rate | Renewed customers divided by renewable customers | Whether customers stay |
| Expansion rate | Expansion customers divided by eligible customers | Whether customer base grows |
Definitions should be documented in the Revenue Data Dictionary. If definitions change silently, trend analysis becomes unreliable.
Segment cuts
Never review conversion only at the company level.
Cut conversion by:
- Source
- Segment
- Region
- Company size
- Product line
- Sales motion
- New business vs expansion
- Inbound vs outbound
- Partner vs direct
A blended rate can hide opposite patterns. Enterprise outbound may have low lead volume but high ACV. Inbound SMB may have high visitor-to-lead conversion but lower win rate. Partner-sourced deals may have slower cycles but stronger retention.
RevOps should help leaders compare like with like.
Time windows
Conversion rates need consistent time windows.
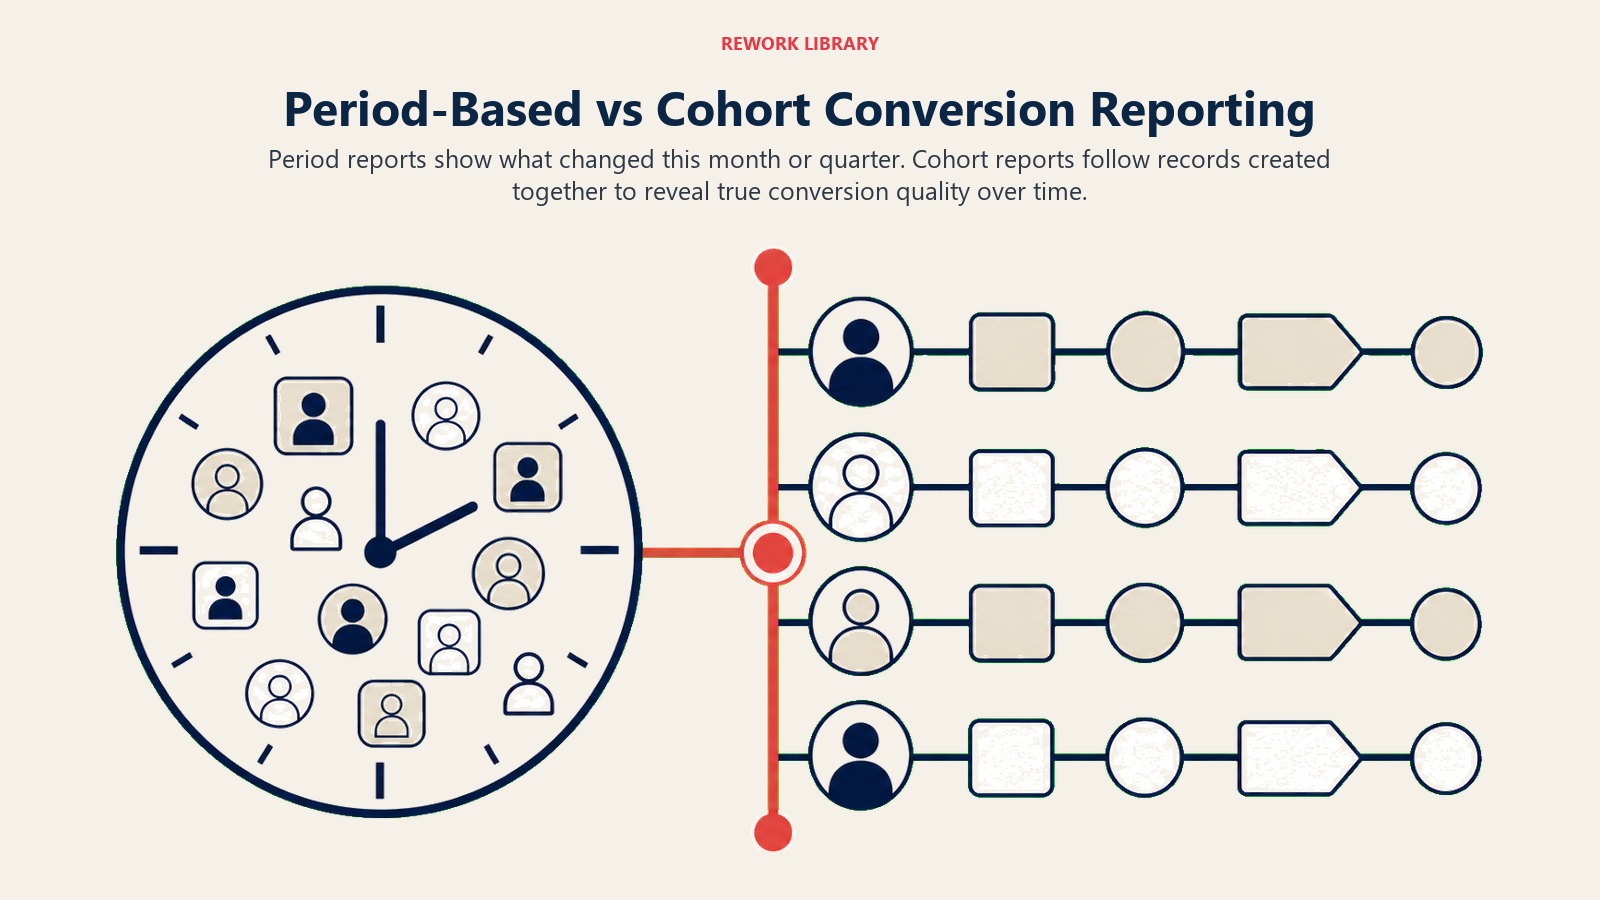
There are two common approaches:
| Approach | Use when |
|---|---|
| Period-based | You want to see what happened this month or quarter |
| Cohort-based | You want to see what happened to records created in a specific period |
Period-based reporting is faster but can mix records from different cohorts. Cohort reporting is cleaner for conversion quality, but it takes longer to mature.
For example, if 1,000 leads were created in January, a cohort report follows those leads through MQL, SQL, opportunity, and closed-won over time. That is better for understanding source quality.
Conversion and velocity
Conversion rate alone is incomplete.
A source with 20 percent opportunity conversion in two weeks may be better than a source with 25 percent conversion over six months, depending on sales cycle and deal size. RevOps should pair conversion with velocity.
Useful paired metrics:
- MQL-to-SQL conversion plus acceptance time
- SQL-to-opportunity conversion plus time to opportunity
- Opportunity-to-win conversion plus sales cycle length
- Renewal conversion plus renewal risk aging
- Expansion conversion plus time from signal to opportunity
This prevents teams from optimizing conversion while ignoring speed.
Benchmark caution
Benchmarks help orientation, but internal trend by segment is more useful. A low ACV inbound funnel and enterprise outbound motion should not share targets.
Benchmarks also need context. Visitor-to-lead rates differ by industry, offer type, traffic source, and buyer intent. MQL-to-SQL rates differ by qualification rules. Win rates differ by stage definition. Renewal and expansion rates differ by product, contract model, and customer fit.
Use benchmarks to ask better questions, not to set universal targets.
Data quality checks
Before trusting conversion rates, check:
- Stage definitions are current.
- Source fields are complete.
- Duplicate records are controlled.
- Stage dates are populated.
- Rejection reasons are specific.
- Opportunities are linked to source records.
- Closed-won amount and date are reliable.
- Renewal and expansion records are connected to accounts.
If these checks fail, conversion reporting may create false confidence.
Diagnostic patterns
Common patterns:
Lead-to-MQL is strong, MQL-to-SQL is weak. Qualification may be too loose, or sales does not trust the definition.
SQL-to-opportunity is weak. Sales acceptance may be informal, or opportunity creation criteria may be too strict or unclear.
Opportunity-to-win is weak. Pipeline may be created too early, stage criteria may be weak, or deal quality may vary by source.
Win rate is stable, expansion is weak. The company may be closing customers without enough adoption or growth fit.
Conversion improves while revenue falls. Deal size, segment mix, or sales cycle may be changing.
Review cadence
Review full-funnel conversion monthly.
The monthly review should include:
- Conversion trend
- Segment and source cuts
- Biggest stage drop-off
- Conversion plus velocity
- Data-quality caveats
- Actions for next month
Weekly reviews should focus on urgent handoffs, not full-funnel interpretation.
Action template
Every conversion review should end with an action:
| Finding | Action |
|---|---|
| MQL acceptance down for one source | Review campaign targeting and scoring |
| SQL-to-opportunity down by region | Inspect qualification and manager coaching |
| Stage 2 to 3 conversion weak | Review stage exit criteria |
| Expansion conversion weak | Audit expansion triggers and CS handoff |
| Conversion report has high unknown source | Fix source capture before budget decisions |
Conversion reporting without action becomes decoration.
Readiness checklist
Before publishing:
- Stages are defined.
- Conversion formulas are documented.
- Source and segment fields are reliable.
- Time windows are clear.
- Data caveats are visible.
- Functional leaders agree on interpretation.
- RevOps owns definition governance.
Full-funnel conversion is working when leaders can see where flow changes and know which operating owner should respond.
Example analysis
Imagine the funnel looks like this:
| Stage | Count | Conversion |
|---|---|---|
| Leads | 10,000 | 100% |
| MQLs | 2,000 | 20% of leads |
| SQLs | 800 | 40% of MQLs |
| Opportunities | 300 | 37.5% of SQLs |
| Closed-won | 60 | 20% of opportunities |
At first glance, leaders may focus on the 20 percent win rate. But the bigger issue might be earlier. If one source has 70 percent MQL-to-SQL acceptance and another has 12 percent, the blended number hides a targeting or qualification problem.
RevOps should avoid stopping at the blended funnel. The real work is in the cuts.
Conversion by source
Source-level conversion helps marketing, sales, and finance make better tradeoffs.
For each source, track:
- Lead volume
- MQL rate
- SQL acceptance
- Opportunity creation
- Pipeline value
- Win rate
- Sales cycle
- Retention or expansion quality
One source may create low volume but strong pipeline. Another may create many leads but poor acceptance. A third may create customers that expand later. The right budget decision depends on the whole path, not one stage.
Conversion by segment
Segment cuts often reveal funnel design issues.
For example:
- SMB inbound may convert quickly but churn faster.
- Mid-market may convert slower but retain better.
- Enterprise may have low opportunity volume but high deal value.
- Partner-sourced opportunities may need longer cycle assumptions.
RevOps should help leaders avoid applying one target to every segment. Shared governance does not mean identical expectations.
Conversion and stage definitions
When conversion changes, first ask whether definitions changed.
If MQL criteria became stricter, MQL volume may fall while acceptance improves. That can be good. If opportunity creation rules became tighter, pipeline may look smaller but more real. If renewal risk categories changed, retention conversion may appear worse because risk is now visible earlier.
Document definition changes in the same dashboard that shows conversion. Otherwise leaders may mistake governance improvement for performance decline.
What to do when conversion drops
Use a diagnosis path:
- Confirm the data is complete.
- Check whether definitions changed.
- Split by source, segment, owner, and motion.
- Compare conversion and velocity.
- Review sample records.
- Identify the owner of the handoff.
- Pick one operating change.
Do not jump to broad conclusions. A conversion drop may be a data issue, quality issue, capacity issue, timing issue, or definition issue.
Conversion review packet
The monthly packet should include:
- Funnel counts by stage
- Conversion rates by stage
- Source and segment cuts
- Velocity alongside conversion
- Highest leakage point
- Data-quality caveats
- Definition changes
- Recommended actions
RevOps should send the packet before the meeting. The meeting should focus on actions, not reading the dashboard.
Common mistakes
Comparing different motions. Enterprise outbound and inbound demo requests should not share one target.
Ignoring time lag. Leads created this month may not become revenue this month.
Ignoring source quality. Volume hides acceptance and win rate.
Ignoring retention. Acquisition conversion can look strong while customer quality is weak.
Treating benchmarks as targets. Internal trend and segment context matter more.
Conversion review rule
Full-funnel conversion should help the company decide where to improve the system next.
If the metric only says "conversion is down," it is incomplete. If it says "MQL-to-SQL acceptance dropped in paid search for mid-market accounts because rejection reasons show poor fit," it is useful. That level of diagnosis is what RevOps should build toward.
Launch plan
Start with one governed funnel before adding every possible cut.
- Confirm lifecycle stages.
- Document conversion formulas.
- Validate stage dates and source fields.
- Build a company-level funnel.
- Add source and segment cuts.
- Add velocity alongside conversion.
- Add data-quality warnings.
- Review with marketing, sales, CS, finance, and RevOps.
Do not publish conversion dashboards before leaders agree on definitions. If marketing, sales, and finance do not agree on what counts as SQL or qualified pipeline, the dashboard will create debate instead of clarity.
Ownership model
Conversion ownership should be explicit.
| Metric | Functional owner | RevOps role |
|---|---|---|
| Visitor to lead | Marketing | Source and capture data governance |
| Lead to MQL | Marketing and RevOps | Qualification rules |
| MQL to SQL | Sales and marketing | Handoff definition and SLA |
| SQL to opportunity | Sales | Opportunity creation criteria |
| Opportunity to closed-won | Sales | Stage and forecast governance |
| Customer to renewal | CS | Renewal data model |
| Customer to expansion | CS and sales | Expansion trigger governance |
Functional leaders own performance. RevOps owns the definitions, data, and cross-stage diagnosis.
Ownership checklist
Before using full-funnel conversion in planning, confirm:
- The report shows counts and percentages.
- It separates source and segment.
- It shows time period and cohort logic.
- It includes velocity.
- It flags data-quality risk.
- It names the owner of each stage.
- It links conversion changes to operating actions.
When those pieces are in place, conversion reporting becomes a management system rather than a metric dump.
Ownership model operating example
Suppose paid social produces many leads, but sales accepts only a small share. RevOps should not stop at reporting "paid social is weak." It should inspect fit, offer, lead source quality, routing, SLA, and rejection reasons. If most rejections are bad-fit company size, marketing should adjust targeting. If most rejections are no intent, the offer may be too broad. If follow-up is late, the issue may be ownership or capacity.
That is how conversion reporting becomes useful: it turns a rate into a specific operating fix.
Conversion review checklist
Before leaders use conversion rates for planning, confirm the report can answer three questions: where did flow change, why did it change, and who owns the fix? If it cannot answer those questions, improve definitions, cuts, or data quality before using the numbers for budget or capacity decisions.
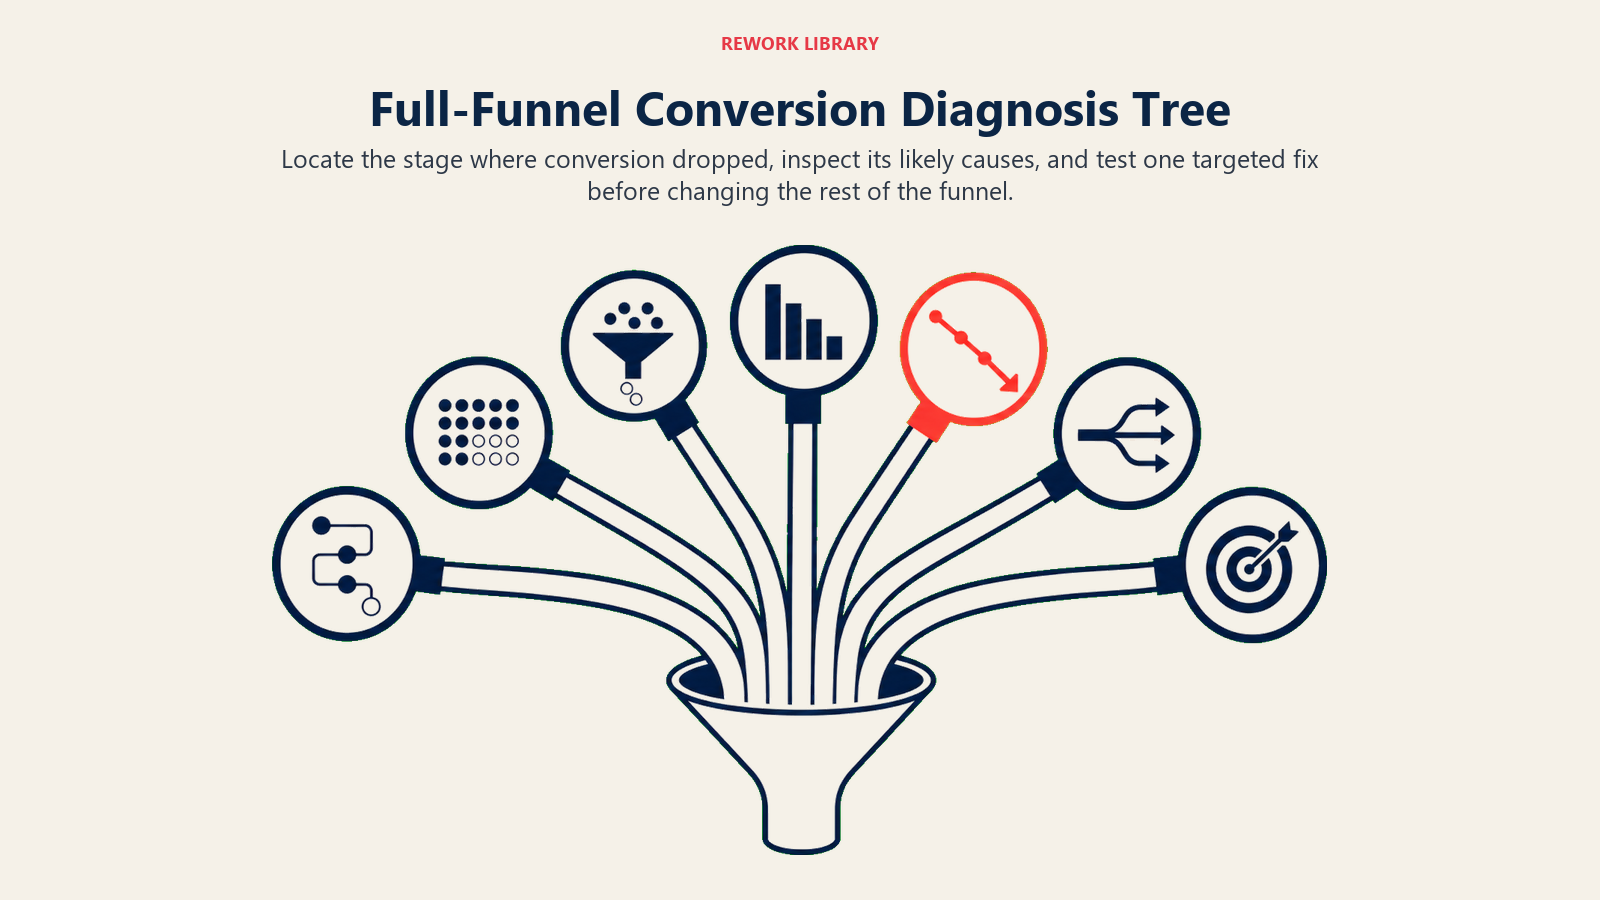
Conversion diagnosis tree
When a conversion rate drops, diagnose the stage before assigning blame.
| Drop appears at | Likely causes to inspect | First fix to test |
|---|---|---|
| Visitor to lead | Offer, page intent, traffic source, form friction | Improve offer-market fit or capture path |
| Lead to MQL | ICP mismatch, weak intent, scoring drift, missing firmographic data | Tighten qualification inputs |
| MQL to SQL | Poor source quality, slow follow-up, unclear acceptance criteria | Review rejection reasons and SLA compliance |
| SQL to opportunity | Weak discovery, poor fit, wrong handoff, capacity issue | Clarify opportunity creation criteria |
| Opportunity to win | Qualification, pricing, competition, sales execution, product fit | Inspect losses by segment and stage |
| Closed-won to onboarded | Missing handoff data, implementation gap, unclear success criteria | Enforce closed-won handoff rules |
| Renewal to expansion | Weak adoption, no owner, missing trigger, poor customer fit | Review health, usage, and expansion signals |
This tree keeps conversion analysis honest. A low MQL-to-SQL rate may be a marketing source problem, a sales follow-up problem, or a definition problem. The right cut by source, segment, owner, and time window reveals which one is most likely.
Conversion action log
Each monthly review should end with a short action log:
| Field | Example |
|---|---|
| Conversion issue | MQL-to-SQL fell from 31 percent to 22 percent |
| Segment or source | Content syndication, SMB accounts |
| Suspected cause | High no-intent rejection rate |
| Owner | Marketing Ops and SDR leader |
| Action | Tighten source acceptance and add rejection reason review |
| Review date | Next monthly funnel review |
Without an action log, conversion reviews become recurring explanations. With one, RevOps can tell whether the operating fix changed the trend.
Frequently Asked Questions about Full-Funnel Conversion Rates
Who owns conversion rates?
Functional leaders own stage performance. RevOps owns definitions, reporting, and cross-stage diagnosis.
How often should they be reviewed?
Monthly is enough for most funnel conversion analysis. Weekly reviews are better for urgent handoff metrics.
Learn more

Senior Operations & Growth Strategist
On this page
- Core conversion rates
- Why full-funnel beats isolated conversion
- Interpretation model
- Conversion by stage
- Segment cuts
- Time windows
- Conversion and velocity
- Benchmark caution
- Data quality checks
- Diagnostic patterns
- Review cadence
- Action template
- Readiness checklist
- Example analysis
- Conversion by source
- Conversion by segment
- Conversion and stage definitions
- What to do when conversion drops
- Conversion review packet
- Common mistakes
- Conversion review rule
- Launch plan
- Ownership model
- Ownership checklist
- Ownership model operating example
- Conversion review checklist
- Conversion diagnosis tree
- Conversion action log
- Learn more