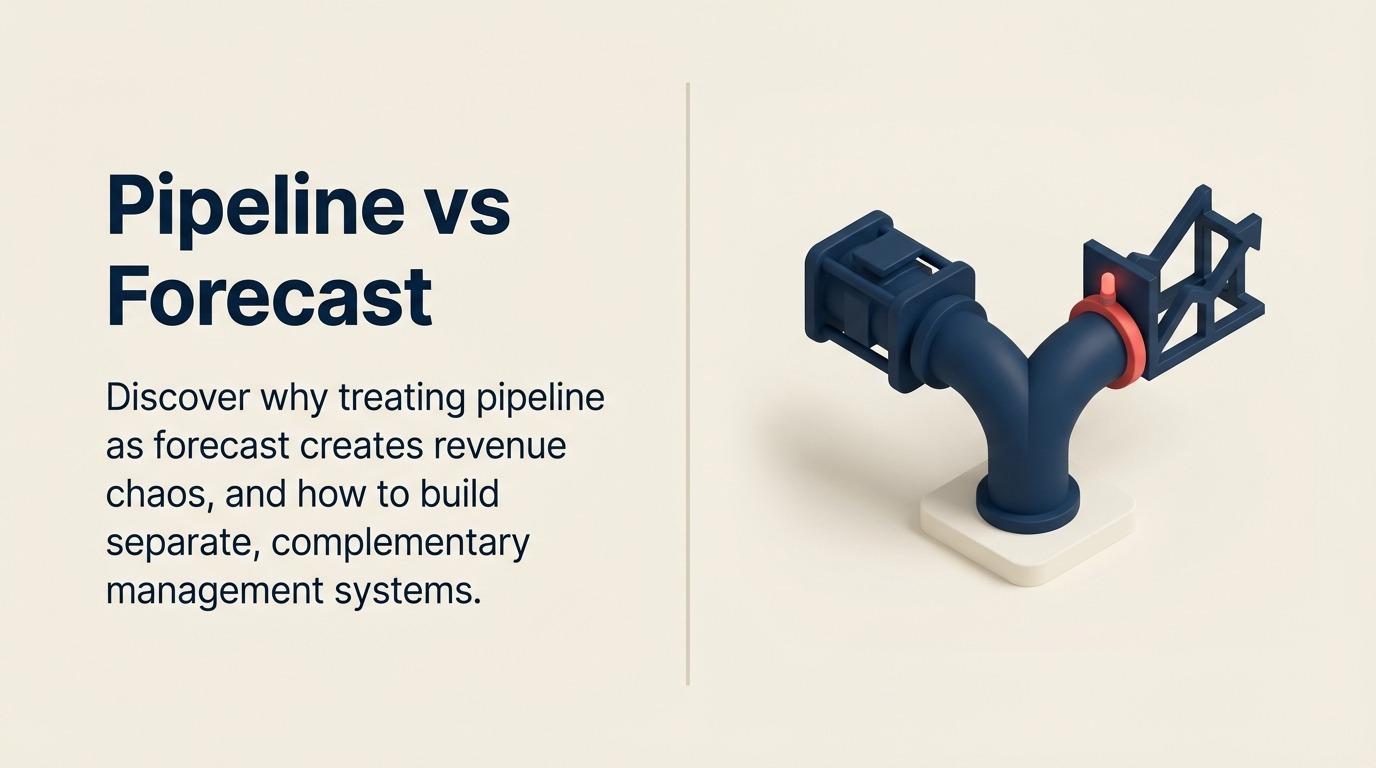
Pipeline vs Forecast: Understanding the Critical Distinction for Revenue Operations
Turn this article into takeaways for your work.
Each assistant summarizes the article only for you and suggests best practices for your work.
"Let's do a pipeline review."
Sounds straightforward, right? Except half the room thinks you mean reviewing all active opportunities to assess pipeline health. The other half thinks you mean predicting what will close this quarter.
And that confusion? It's costing you millions.
Most revenue leaders use "pipeline" and "forecast" like they mean the same thing. They don't. But meetings constantly conflate current opportunity state with future predictions. Coverage targets get set without anyone clarifying the difference between what exists and what will actually convert.
If you're a C-level executive responsible for revenue, this distinction matters more than you think. Pipeline and forecast serve completely different purposes. They need different metrics and different management disciplines. When you treat them as synonyms, you get planning chaos, forecasting errors, and teams working toward different goals.
The Costly Confusion
The mixing of pipeline and forecast manifests in predictable and expensive ways:
Undercoverage crises emerge when leadership assumes pipeline equals forecast. You look at $10M in pipeline and assume you'll close $10M. Then conversion reality hits, your actual close rate is 25%, and you miss targets by 75%. But nobody caught it because "pipeline looked good."
Wishful forecasting happens when teams predict revenue without pipeline discipline. Sales leaders commit to numbers that have no grounding in actual opportunity reality. Finance builds plans around fantasy. Board meetings turn into explaining why you're 40% below forecast.
Meeting inefficiency wastes hours every week because nobody knows what they're reviewing. Is this about opportunity health or revenue prediction? Stage progression or close probability? Current state or future outlook? Different questions require different data and different conversations.
Resource misallocation follows when the distinction blurs. Marketing gets told to generate more pipeline when the real issue is forecast accuracy. Sales gets pressured to close faster when the actual problem is insufficient top-of-funnel coverage.
Core Definitions
First, we need to get specific about what these terms actually mean:
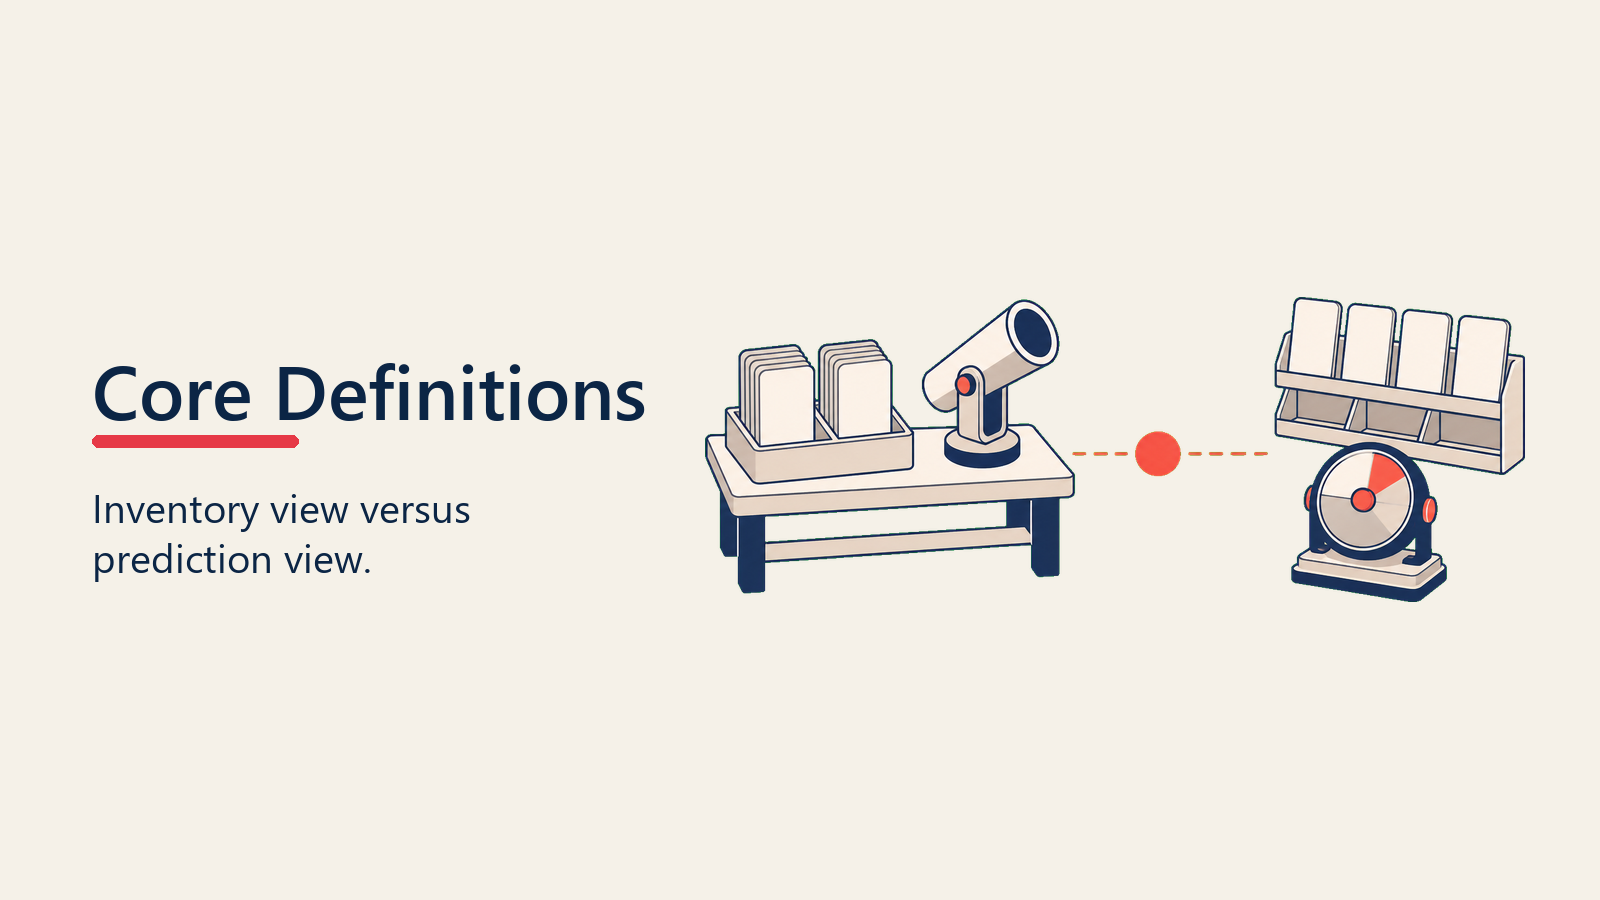
Pipeline: The Current State
Pipeline is a snapshot of all active sales opportunities at a specific point in time. It's an inventory view, what exists right now across all stages of your sales process.
Pipeline answers one question: "What opportunities are we working on?" It includes early-stage discovery calls, mid-stage proposals, late-stage negotiations, and everything in between. The key thing is it's comprehensive and current. Understanding what is sales pipeline provides the foundation for this distinction.
Think of pipeline as your warehouse inventory. It shows everything on the shelves, regardless of when it might sell or whether it will sell at all.
Forecast: The Future Prediction
Forecast is a prediction of the deals expected to close within a specific time period, typically the current quarter or month. It's a filtered, probability-weighted view of which opportunities will convert to revenue.
Forecast answers: "What will we actually close this quarter?" It focuses on opportunities with high probability of near-term conversion, filtered by close date and weighted by stage probability.
Think of forecast as your sales projection. It's not everything in the warehouse, it's what you expect to ship this month based on orders in progress, customer commitments, and historical conversion patterns.
Five Key Differences
Pipeline and forecast are related, but they answer different questions about available opportunity and expected revenue.
The distinction between pipeline and forecast breaks down into five specific dimensions:
1. Time Orientation
Pipeline: Present Tense Pipeline focuses on what exists now. It's a current inventory that changes daily as opportunities enter, progress, or exit. Time horizon is open-ended, pipeline includes deals closing next week and deals closing in nine months.
Forecast: Future Tense Forecast focuses on what will close in a defined future period. It's inherently time-bound, this month, this quarter, this fiscal year. Opportunities outside the forecast window don't count, regardless of size or probability.
2. Purpose and Use
Pipeline: Visibility and Health Pipeline management answers operational questions: Do we have enough opportunities? Are deals progressing? Where are bottlenecks? Is pipeline growing or shrinking? Are we winning new business?
You're looking for visibility into sales activity and pipeline health. Good pipeline management ensures adequate coverage, identifies stuck deals, and drives coaching interventions.
Forecast: Prediction and Planning Forecasting answers planning questions: Will we hit targets? What should finance expect? Do we need to accelerate or brake spending? Should we revise guidance?
You're trying to predict accurately so the business can plan. Good forecasting lets CFOs manage cash, CEOs communicate with boards, and operations teams scale appropriately.
3. Scope and Inclusion
Pipeline: All Stages Pipeline includes everything from initial qualification to final negotiation. Early-stage opportunities count just as much as late-stage deals in total pipeline value. The metric includes the entire waterfall.
A $500K opportunity in discovery contributes $500K to pipeline, even if close probability is 10% and the expected close date is six months out.
Forecast: Closeable Deals Forecast includes only opportunities likely to close within the forecast period. Early-stage deals don't typically make the forecast cut. The focus is narrow, deals with high probability and near-term close dates.
That same $500K opportunity in discovery contributes $0 to this quarter's forecast if it won't close for six months, regardless of how real it might be.
4. Accuracy Requirements
Pipeline: 100% Current Pipeline must be completely current and accurate as of the snapshot date. Every opportunity should show the correct stage, value, and status. The standard here is factual precision, this is what exists right now.
Pipeline accuracy means every rep has updated their opportunities, no ghost deals are hanging around, and stage progression reflects reality. It's basically data hygiene.
Forecast: Probabilistic Forecast must be predictively accurate, but it's inherently probabilistic. No one knows with 100% certainty which deals will close. The standard here is predictive precision, minimizing variance between what you forecast and what actually happens.
Forecast accuracy means your prediction methodology models conversion probability correctly, your reps call their deals honestly, and your variance trends toward zero over time.
5. Ownership and Accountability
Pipeline: Sales Operations Focus Pipeline management typically sits with sales operations. The discipline involves process enforcement, CRM hygiene, stage definitions, conversion tracking, and opportunity progression.
Sales operations ensures pipeline data is clean, complete, and current. They run reports, analyze trends, and identify process breakdowns.
Forecast: Revenue Leadership Focus Forecasting typically sits with revenue leadership, CRO, VP Sales, regional directors. The discipline involves deal inspection, probability assessment, risk identification, and commitment making.
Revenue leaders inspect specific opportunities, challenge assumptions, assess competitive dynamics, and ultimately commit numbers to finance and the board.
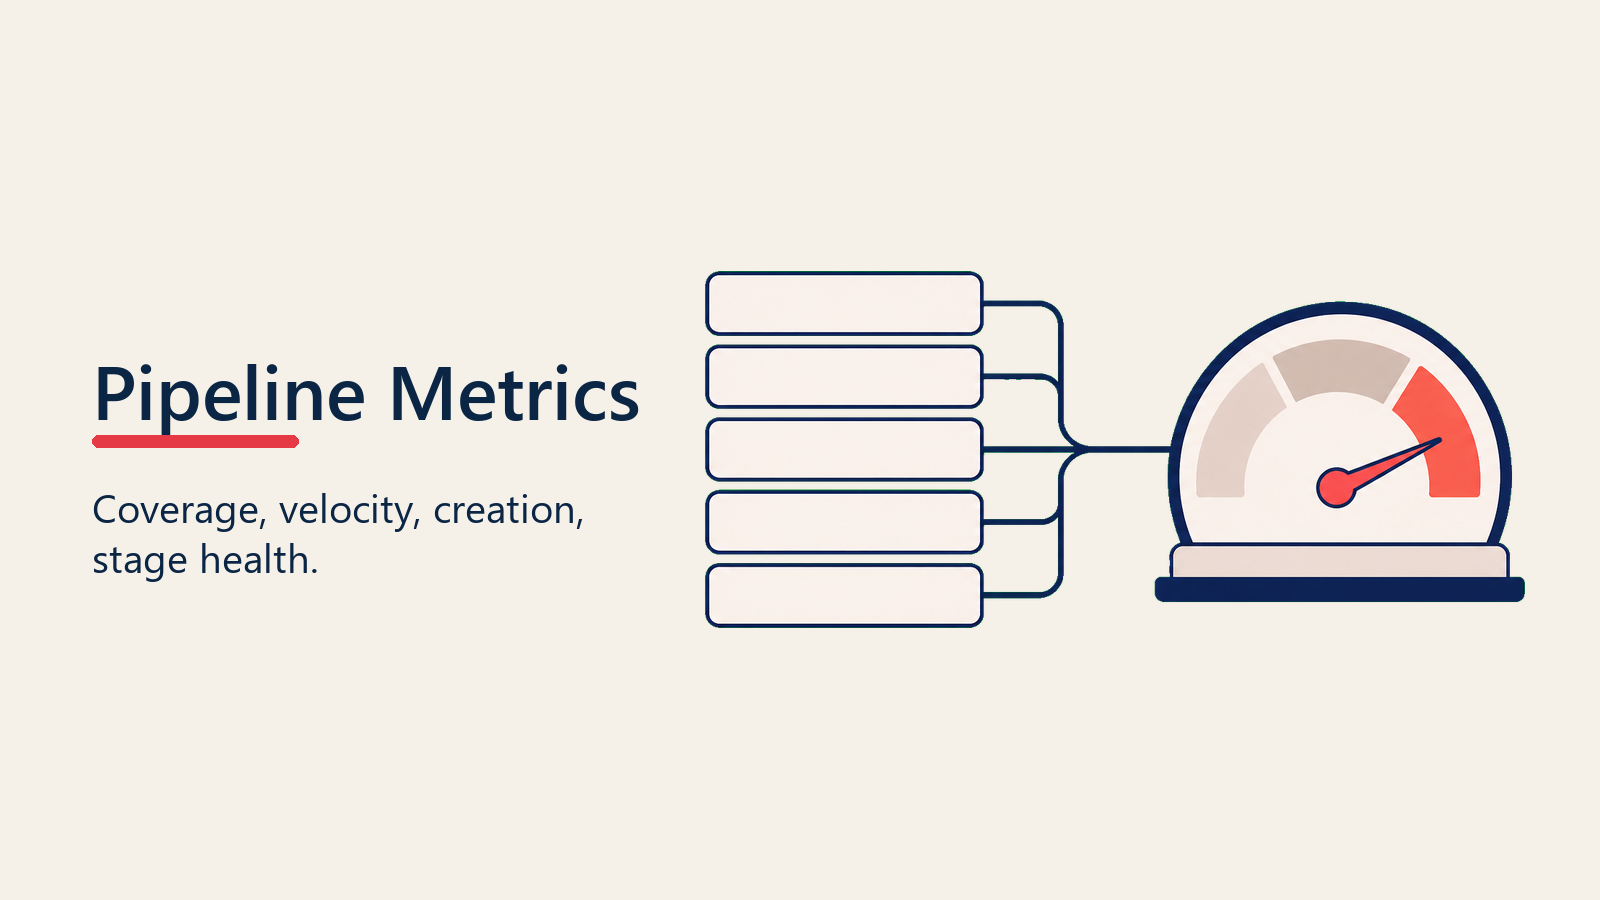
Pipeline Metrics: What to Measure
To manage pipeline effectively, you need to track specific metrics:
Total Pipeline Value
The aggregate dollar value of all active opportunities. This is your core inventory metric. Track it over time to see whether pipeline is growing, stable, or shrinking.
Benchmark: Healthy B2B companies maintain pipeline equal to 3-5x their quarterly quota, though this varies significantly by sales cycle length and close rate.
Pipeline by Stage
Total pipeline broken down by sales stage. This reveals where opportunities cluster and where they stall.
If 70% of pipeline sits in early stages, you have coverage but potential velocity problems. If 70% sits in late stages, you might have short-term strength but long-term generation issues.
Pipeline Coverage Ratio
Pipeline value divided by quota or target. This answers: "Do we have enough pipeline to hit our number?" A thorough pipeline coverage analysis helps you determine adequate coverage levels.
The formula: Total Pipeline Value / Quota or Target = Coverage Ratio
A 3x coverage ratio means you have $3M in pipeline against $1M in quota. Whether that's sufficient depends on your historical close rate.
Pipeline Velocity
How fast opportunities move through your pipeline, typically measured as average days in stage or average time from creation to close. Understanding pipeline velocity metrics is essential for optimization.
Velocity reveals efficiency. Faster velocity means quicker revenue realization. Slowing velocity flags problems, deals getting stuck, reps avoiding difficult conversations, or qualification issues.
New Pipeline Created
Dollar value of new opportunities added in a period. This measures top-of-funnel health and marketing effectiveness.
Declining new pipeline creation is an early warning sign. You might have healthy current pipeline, but if creation drops, you'll face future coverage shortfalls.
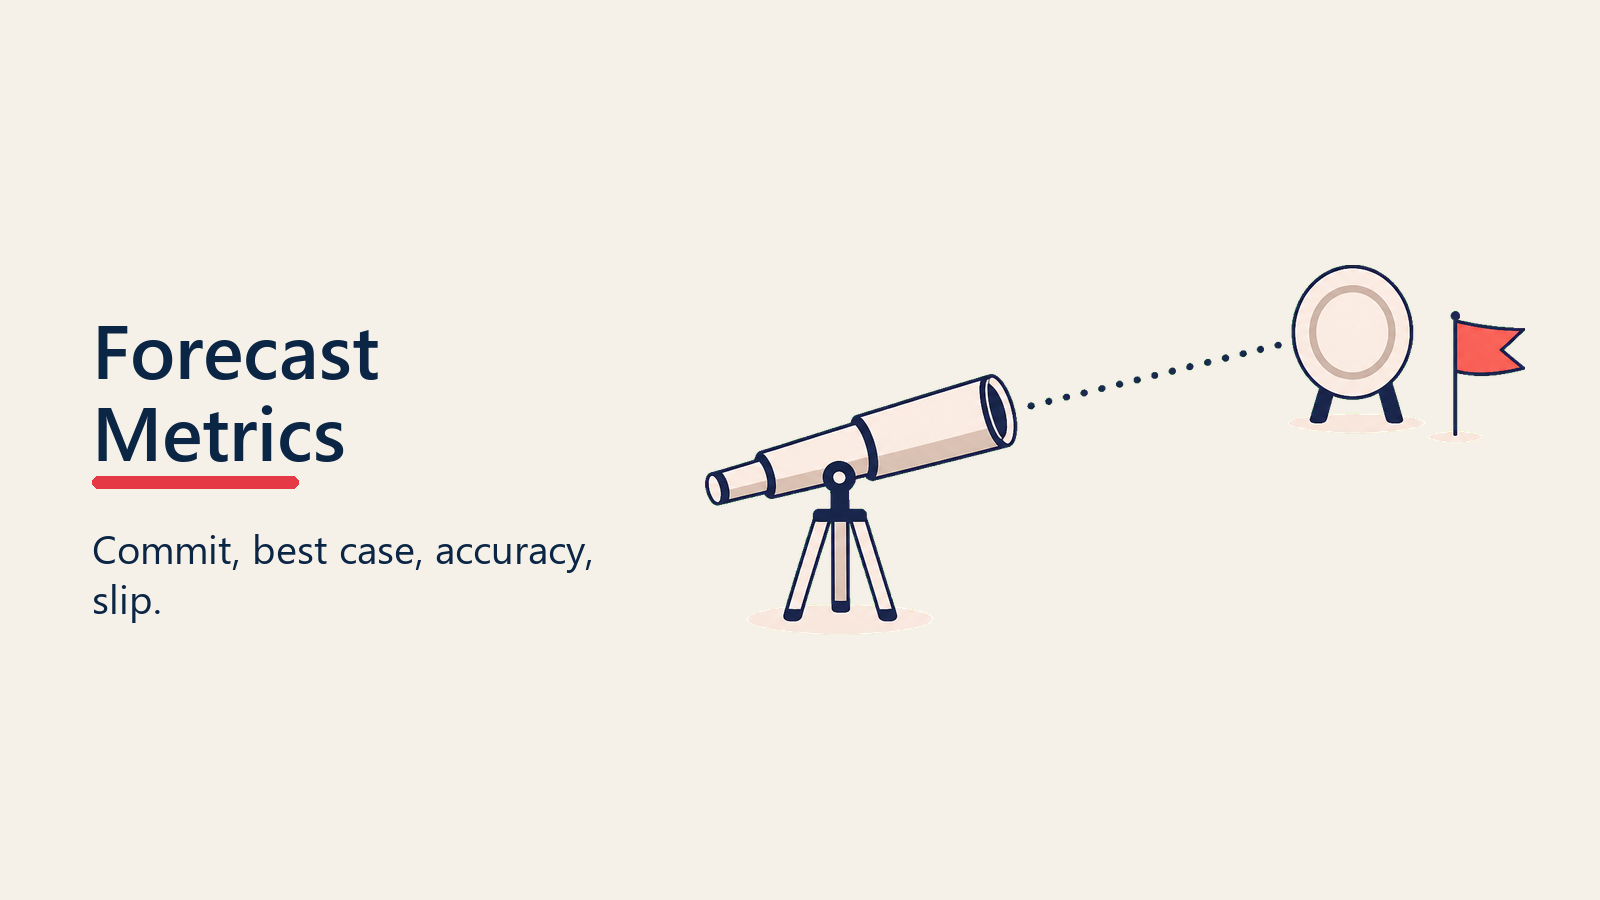
Forecast Metrics: What to Measure
Forecasting needs different metrics entirely:
Commit Forecast
The dollar value of deals your sales leadership commits will close in the forecast period. This is your official number, what you tell finance, what goes in board reports, what determines whether you hit or miss.
Commit should be conservative and achievable. Good forecasters commit what they're confident delivering, not what they hope might happen.
Best Case Forecast
The dollar value of deals that could close if everything goes right. This includes your commit forecast plus additional opportunities with reasonable close probability.
Best case provides upside visibility. It helps leadership understand what's possible if deals accelerate or new opportunities convert unexpectedly.
Forecast Accuracy
The variance between what you forecasted and what actually closed. This is your credibility metric.
The formula: (Actual Closed - Forecast) / Forecast = Forecast Variance
A forecast of $1M with actual results of $900K yields -10% variance (10% miss). A forecast of $1M with actual results of $1.1M yields +10% variance (10% overperformance).
Elite forecasters maintain variance within +/- 5%. Most organizations operate at +/- 15-20%.
Deal Slip Rate
The percentage of forecasted deals that don't close in the predicted period. Slipped deals push to future quarters or are lost entirely.
The formula: Deals Forecasted but Not Closed / Total Deals Forecasted = Slip Rate
High slip rates (above 30%) indicate over-optimism, poor deal qualification, or lack of customer commitment. They also distort future forecasts as slipped deals pile up.
The Relationship: How Pipeline Feeds Forecast
Pipeline and forecast aren't independent, they're connected through a filtering and weighting process:
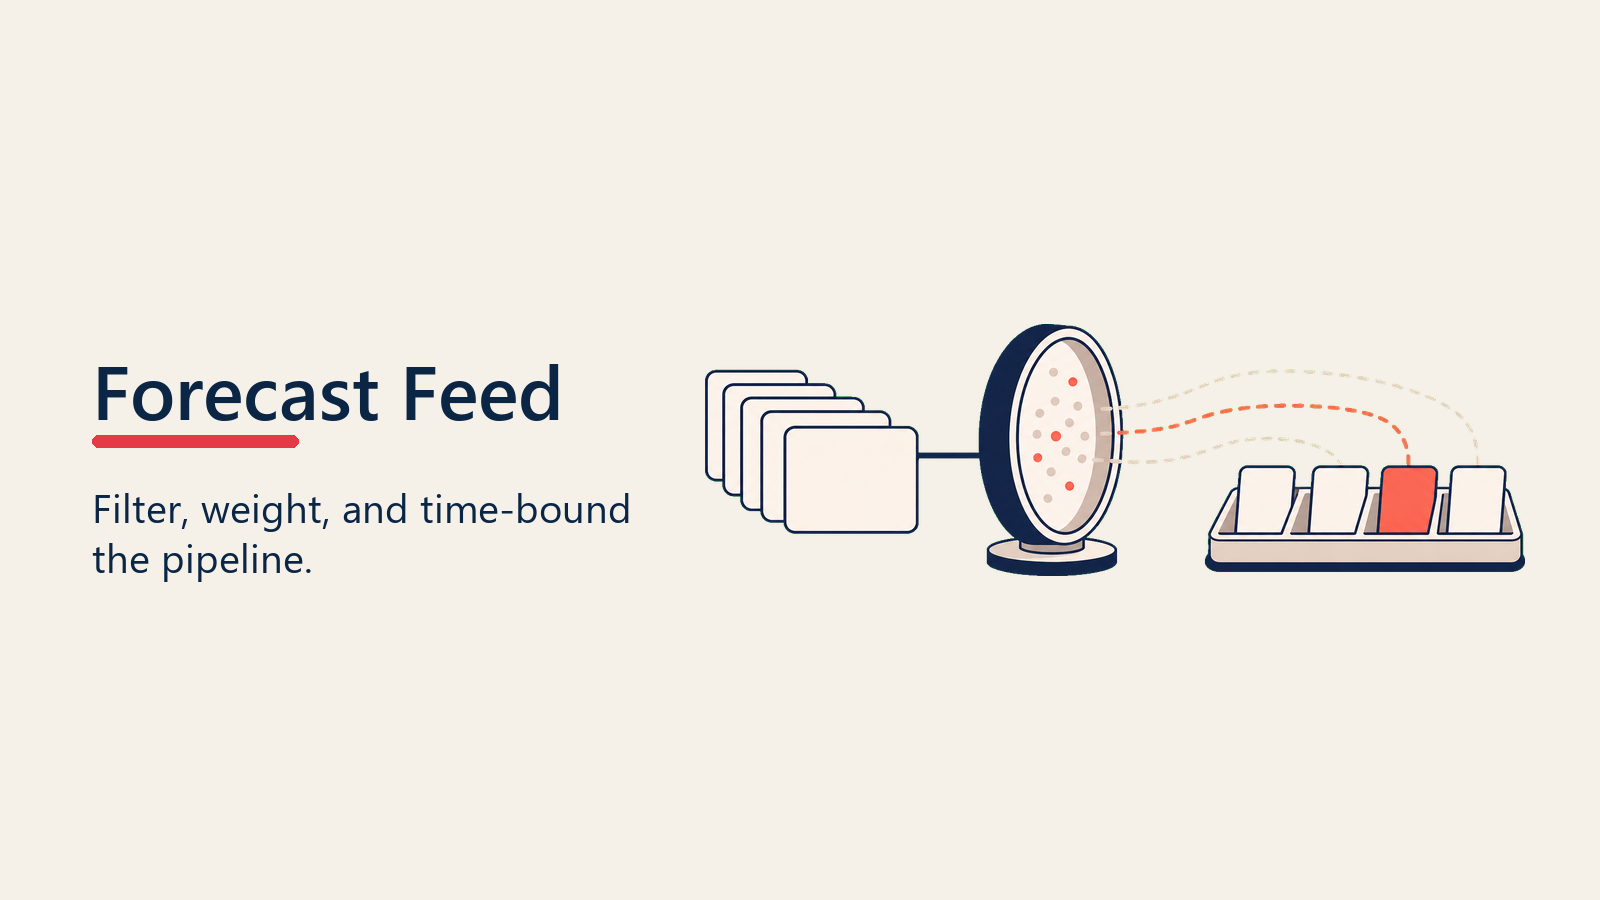
Weighted Pipeline Methodology
Most forecasting models start with pipeline and apply stage-based probability weights:
- Qualification stage: 10% weight
- Discovery stage: 20% weight
- Proposal stage: 40% weight
- Negotiation stage: 60% weight
- Verbal commitment stage: 90% weight
A $100K opportunity in proposal stage contributes $40K to weighted pipeline ($100K × 40%).
Weighted pipeline gives you a more realistic view than raw pipeline numbers. Not every opportunity closes, and this approach accounts for that.
Stage-Based Probability Models
Probability weights should reflect your actual historical conversion rates by stage. If 25% of opportunities in discovery stage ultimately close, your discovery weight should be 25%, not 20%. Building accurate probability models requires historical data analysis.
Most companies start with generic weights and refine them over time using closed-loop analysis. The goal: minimize variance between weighted forecast and actual results.
Time-Based Filtering
Forecasting applies time filters to pipeline. Only opportunities with close dates within the forecast period count toward that period's forecast.
A $200K opportunity with a July 15 close date contributes to Q2 forecast if your quarter ends June 30 (assuming it's in your time filter range), but it definitely contributes to Q3 forecast.
This filtering separates long-term pipeline from near-term commitments.
Common Management Mistakes
Revenue leaders keep making the same mistakes:
Using Pipeline as Forecast
The most common error: treating total pipeline as predicted revenue. "We have $10M in pipeline, so we'll close $10M."
This ignores conversion reality. If your close rate is 25%, that $10M in pipeline yields $2.5M in closed revenue. The coverage looks healthy until you miss by 75%.
The fix: separate pipeline reviews from forecast calls. Track pipeline for coverage and health. Build forecast using probability-weighted models and time filters.
Forecasting Without Pipeline Discipline
The opposite error: predicting revenue without any grounding in actual pipeline opportunities. Sales leaders commit numbers because that's what's needed, not because the opportunities support the commitment.
This creates wishful thinking. Forecast says $5M, but pipeline shows $8M with a 30% close rate ($2.4M expected). The math doesn't work, but everyone proceeds anyway.
The fix: forecast discipline requires pipeline discipline. You can't commit revenue without identifying the specific opportunities that will deliver it.
Mixing Timeframes and Definitions
Running meetings where some people discuss total pipeline, others discuss quarterly forecast, and still others discuss monthly commit, all without clarity on which conversation is happening.
This creates confusion, misalignment, and bad decisions. Marketing hears "we need more pipeline" when the actual issue is forecast accuracy. Sales hears "commit more" when the actual issue is insufficient early-stage coverage.
The fix: agenda clarity. State explicitly whether the meeting covers pipeline health, forecast review, or executive planning. Use separate meetings for separate purposes.
Best Practice Framework
Mature revenue organizations operate distinct processes:
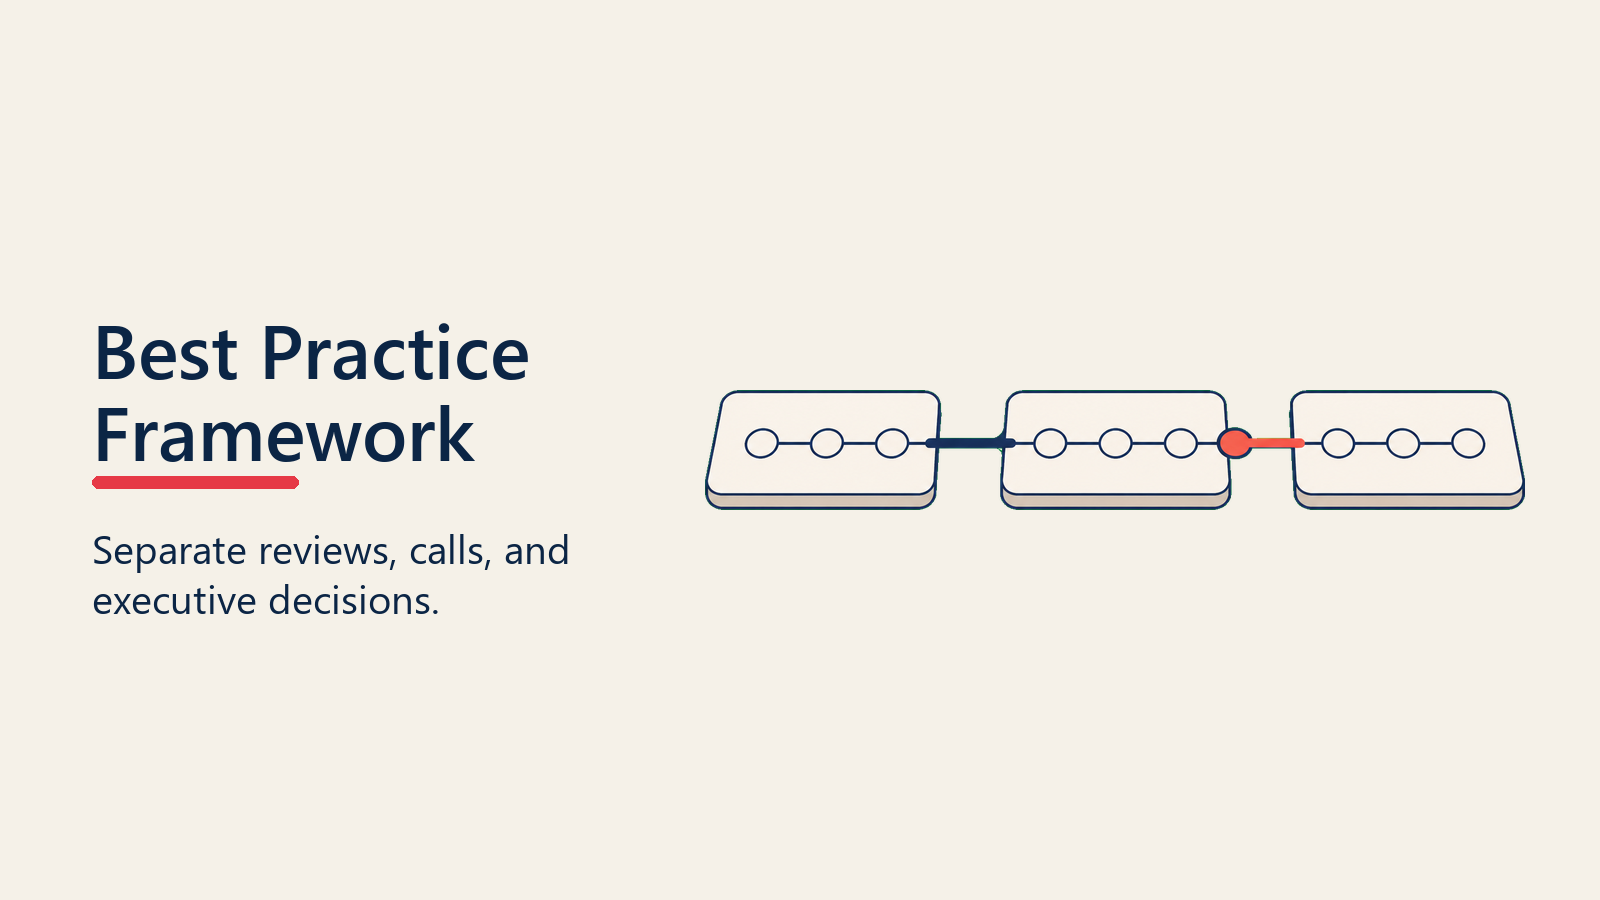
Pipeline Reviews: Weekly, Comprehensive, Health-Focused
Frequency: Weekly, led by sales managers with their teams
Scope: All opportunities regardless of stage or close date
Focus Questions:
- Are we creating enough new pipeline?
- Where are deals getting stuck?
- Which opportunities need coaching intervention?
- Is pipeline coverage adequate for future quarters?
Metrics: Total pipeline, pipeline by stage, pipeline velocity, new pipeline created, coverage ratio
Output: Coaching actions, process improvements, early warning flags
Forecast Calls: Weekly/Monthly, Commit-Focused, Accuracy-Emphasis
Frequency: Weekly for in-quarter, monthly for future quarters
Scope: Opportunities forecasted to close in the specific period
Focus Questions:
- What will close this month/quarter?
- What's changed since last forecast?
- What risks could cause deals to slip?
- What upside opportunities might accelerate?
Metrics: Commit forecast, best case, forecast vs. actual variance, slip rate
Output: Updated commit numbers, risk identification, resource allocation decisions
Executive Reviews: Monthly/Quarterly, Strategic Planning
Frequency: Monthly or quarterly, led by CRO with CEO/CFO/board
Scope: Both pipeline health and forecast accuracy, plus strategic context
Focus Questions:
- Will we hit quarterly and annual targets?
- Is pipeline coverage trending positively?
- What strategic adjustments are needed?
- How accurate has forecasting been?
Metrics: Quarter-to-date results vs. forecast, pipeline coverage, forecast accuracy trends, win rates, sales cycle length
Output: Strategic decisions, investment adjustments, external guidance
Technology Requirements
You need distinct views in your systems to separate pipeline from forecast:
Pipeline Dashboards show total pipeline value, pipeline by stage, coverage ratios, and velocity metrics. They include all opportunities and update in real-time.
Forecast Dashboards show commit and best case by period, forecast accuracy tracking, deal-level inspection views, and variance analysis. They filter by close date and weight by probability.
CRM Configuration should enforce consistent stage definitions, required fields that enable accurate probability weighting, and close date discipline. Implementing stage gate criteria ensures data quality.
Reporting Infrastructure must support both comprehensive pipeline analysis and time-bounded forecast scenarios. Mixing these views creates analytical confusion.
Most modern CRMs (Salesforce, HubSpot, Pipedrive) support both pipeline and forecast views, but you have to configure them deliberately. Default configurations often blur the distinction.
Conclusion: Separate Disciplines, Complementary Outcomes
Pipeline management and forecasting are separate disciplines that serve complementary purposes.
Pipeline management makes sure you have enough healthy opportunities to drive revenue. It's about volume, velocity, and conversion optimization. Good pipeline management creates the raw material for predictable revenue.
Forecasting makes sure you can accurately predict which opportunities will close and when. It's about probability assessment, risk identification, and commitment accuracy. Good forecasting enables business planning and capital allocation.
Treating them as the same thing guarantees neither works effectively. You end up with inflated pipeline that doesn't convert and forecasts disconnected from reality.
Organizations that separate the disciplines, with distinct meetings, metrics, and ownership, build the dual capability that drives predictable growth: sufficient pipeline coverage and accurate revenue prediction.
You have a choice: maintain the confusion and accept the chaos, or build the operational clarity that lets you plan with confidence.
Ready to improve your pipeline and forecast discipline? Explore forecasting fundamentals to develop accurate prediction capabilities.
Learn More
- Stage-Based Forecasting - Build probability models from conversion data
- Conversion Rate Analysis - Measure and optimize stage-to-stage conversion
- Revenue Predictability - Create consistent, reliable revenue forecasts
- Deal Inspection Process - Evaluate opportunity quality and close likelihood

Senior Operations & Growth Strategist
On this page
- The Costly Confusion
- Core Definitions
- Pipeline: The Current State
- Forecast: The Future Prediction
- Five Key Differences
- 1. Time Orientation
- 2. Purpose and Use
- 3. Scope and Inclusion
- 4. Accuracy Requirements
- 5. Ownership and Accountability
- Pipeline Metrics: What to Measure
- Total Pipeline Value
- Pipeline by Stage
- Pipeline Coverage Ratio
- Pipeline Velocity
- New Pipeline Created
- Forecast Metrics: What to Measure
- Commit Forecast
- Best Case Forecast
- Forecast Accuracy
- Deal Slip Rate
- The Relationship: How Pipeline Feeds Forecast
- Weighted Pipeline Methodology
- Stage-Based Probability Models
- Time-Based Filtering
- Common Management Mistakes
- Using Pipeline as Forecast
- Forecasting Without Pipeline Discipline
- Mixing Timeframes and Definitions
- Best Practice Framework
- Pipeline Reviews: Weekly, Comprehensive, Health-Focused
- Forecast Calls: Weekly/Monthly, Commit-Focused, Accuracy-Emphasis
- Executive Reviews: Monthly/Quarterly, Strategic Planning
- Technology Requirements
- Conclusion: Separate Disciplines, Complementary Outcomes
- Learn More