Bahasa Indonesia
Six Sigma: Prinsip, Belt, dan DMAIC Dijelaskan
Turn this article into takeaways for your work.
Each assistant summarizes the article only for you and suggests best practices for your work.
Six Sigma adalah metodologi yang mengubah pengurangan cacat menjadi ilmu pengetahuan. Ketika tim Anda sepakat tentang apa artinya "cukup baik" pada 3,4 cacat per juta kesempatan, Anda berhenti menebak-nebak dan mulai mengukur.
Apa Itu Six Sigma?
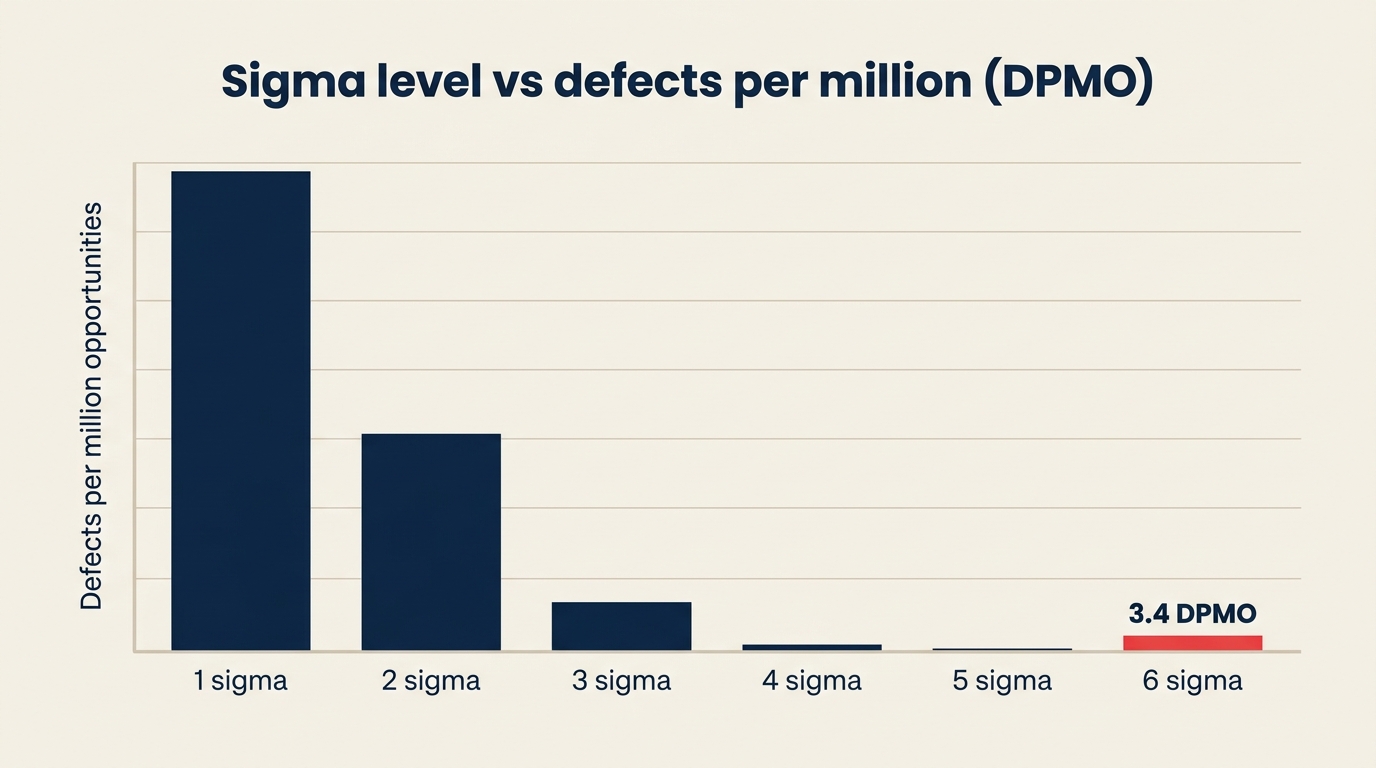
Six Sigma adalah metodologi berbasis data untuk menghilangkan cacat, menargetkan tingkat mutu 3,4 cacat per juta kesempatan (DPMO). Pada enam standar deviasi (sigma) dari rata-rata, hampir setiap unit yang dihasilkan proses memenuhi spesifikasi.
Bill Smith, seorang insinyur keandalan di Motorola, memformalkan metode ini pada tahun 1986. Motorola menggunakannya untuk memangkas biaya garansi dan memenangkan Malcolm Baldrige National Quality Award pertama pada tahun 1988. Satu dekade kemudian, Jack Welch menjadikan Six Sigma sebagai inti sistem operasi GE, menanamkannya di setiap unit bisnis dan melaporkan penghematan kumulatif yang mengukuhkan reputasinya di seluruh dunia.
Fakta Utama
GE melaporkan Six Sigma menghasilkan $10 miliar manfaat kumulatif dalam lima tahun pertama program (Laporan Tahunan GE, 1999).
Motorola, pencetusnya, telah mengutip lebih dari $17 miliar penghematan Six Sigma yang terdokumentasi sejak 1986 (Motorola, pengungkapan internal).
Riset tolok ukur LNS Research 2024 menemukan bahwa 70% perusahaan Fortune 500 pernah menggunakan Six Sigma atau Lean Six Sigma pada suatu titik dalam operasi mereka.
5 Prinsip Inti Six Sigma
Fokus pada pelanggan. Setiap proyek dimulai dengan mendefinisikan apa yang dihargai pelanggan dan seperti apa kegagalan dari perspektif mereka. Mutu bukan penilaian internal; itu adalah penilaian pelanggan. Tim yang melewatkan langkah ini mengoptimalkan metrik yang tidak dipedulikan siapapun di luar organisasi.
Biarkan data, bukan opini, yang menggerakkan keputusan. Intuisi adalah titik awal, bukan kesimpulan. Six Sigma mengharuskan pengukuran garis dasar, uji statistik, dan bukti terdokumentasi sebelum perubahan apa pun bergerak ke implementasi. Jika data tidak meyakinkan, tim mengumpulkan lebih banyak.
Targetkan proses, bukan orang. Ketika cacat muncul, insting adalah menyalahkan karyawan yang membuatnya. Six Sigma menggeser pertanyaan itu: apa yang diizinkan atau didorong oleh proses yang menghasilkan hasil ini? Memperbaiki sistem bersifat permanen. Melatih ulang individu tidak.
Kelola secara proaktif. Tim mutu yang reaktif memperbaiki masalah setelah pelanggan mengeluh. Tim Six Sigma memantau indikator terdepan, menetapkan pemicu tindakan, dan melakukan intervensi sebelum variasi menjadi cacat. Diagram kendali, aturan run, dan statistical process control (SPC) adalah alat yang memungkinkan hal ini.
Berkolaborasi lintas fungsi. Cacat jarang berada dalam satu departemen saja. Kesalahan penagihan mungkin berasal dari penjualan, muncul di keuangan, dan merusak hubungan pelanggan di manajemen akun. Proyek Six Sigma menarik tim lintas fungsi bersama dengan piagam bersama dan akuntabilitas bersama.
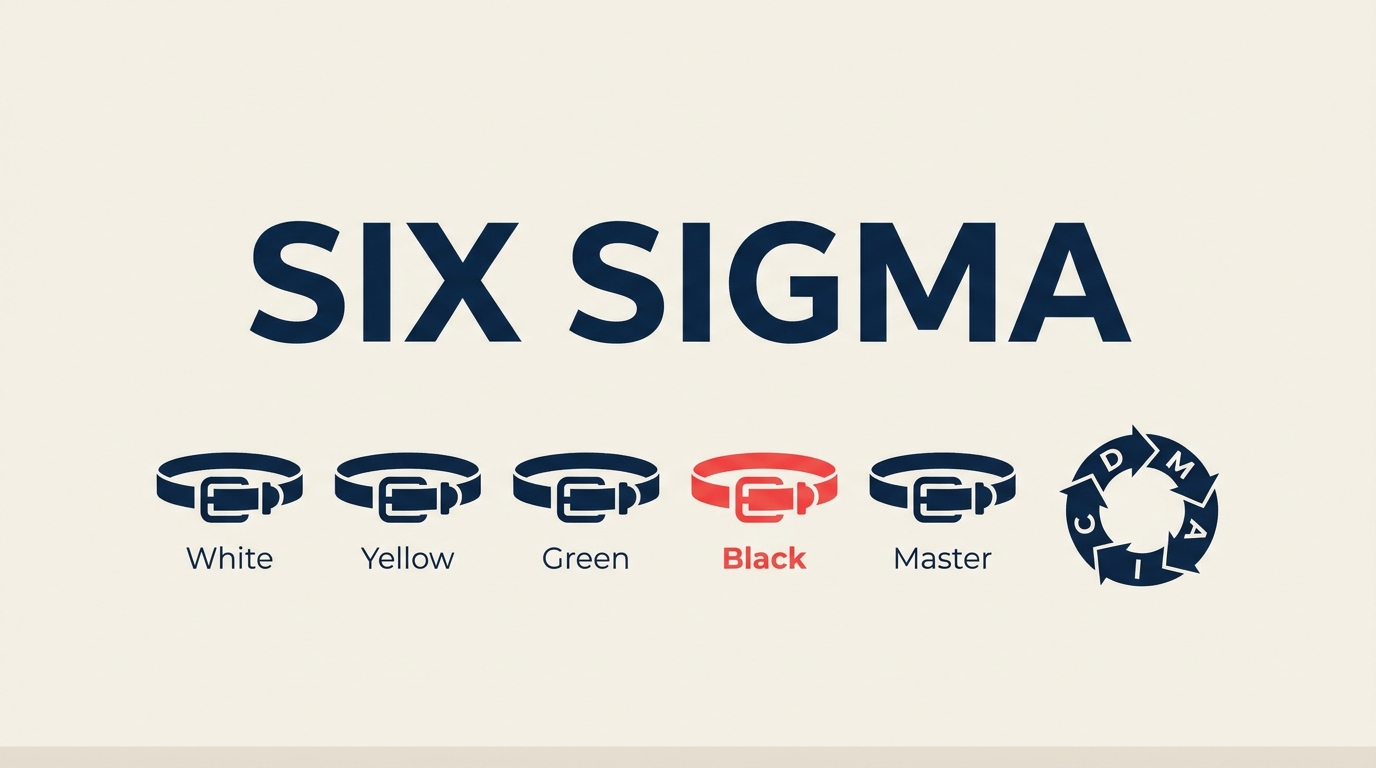
Belt Six Sigma: Siapa yang Melakukan Apa
| Belt | Peran | Jam pelatihan (perkiraan) | Proyek tipikal |
|---|---|---|---|
| White Belt | Kesadaran dasar; mendukung upaya perbaikan lokal | 4-8 | Pelacakan proses tingkat departemen |
| Yellow Belt | Anggota tim dalam proyek DMAIC; mengumpulkan data | 16-40 | Pengumpulan data, fasilitasi rapat |
| Green Belt | Pemimpin proyek paruh waktu; menjalankan proyek DMAIC yang lebih kecil | 80-120 | Perbaikan proses tunggal, pengurangan waktu siklus |
| Black Belt | Pemimpin proyek penuh waktu; ahli statistik | 160-200 | Proyek lintas fungsi kompleks, dampak $100K-$500K |
| Master Black Belt | Pelatih dan instruktur; menetapkan standar metodologi | 200+ jam + bertahun-tahun pengalaman | Tata kelola program, pipeline pelatihan, perubahan budaya |
| Champion | Sponsor eksekutif; menghilangkan hambatan organisasi | Tidak ada jam yang ditetapkan | Memilih proyek, mengamankan sumber daya, meninjau kemajuan |
Dalam praktiknya, Green Belt melakukan sebagian besar pekerjaan proyek sehari-hari. Black Belt biasanya memimpin tiga hingga lima proyek per tahun, masing-masing dengan target keuangan yang ditentukan. Master Black Belt berada di atas tingkat proyek dan berfokus pada membangun kapabilitas organisasi dari waktu ke waktu.
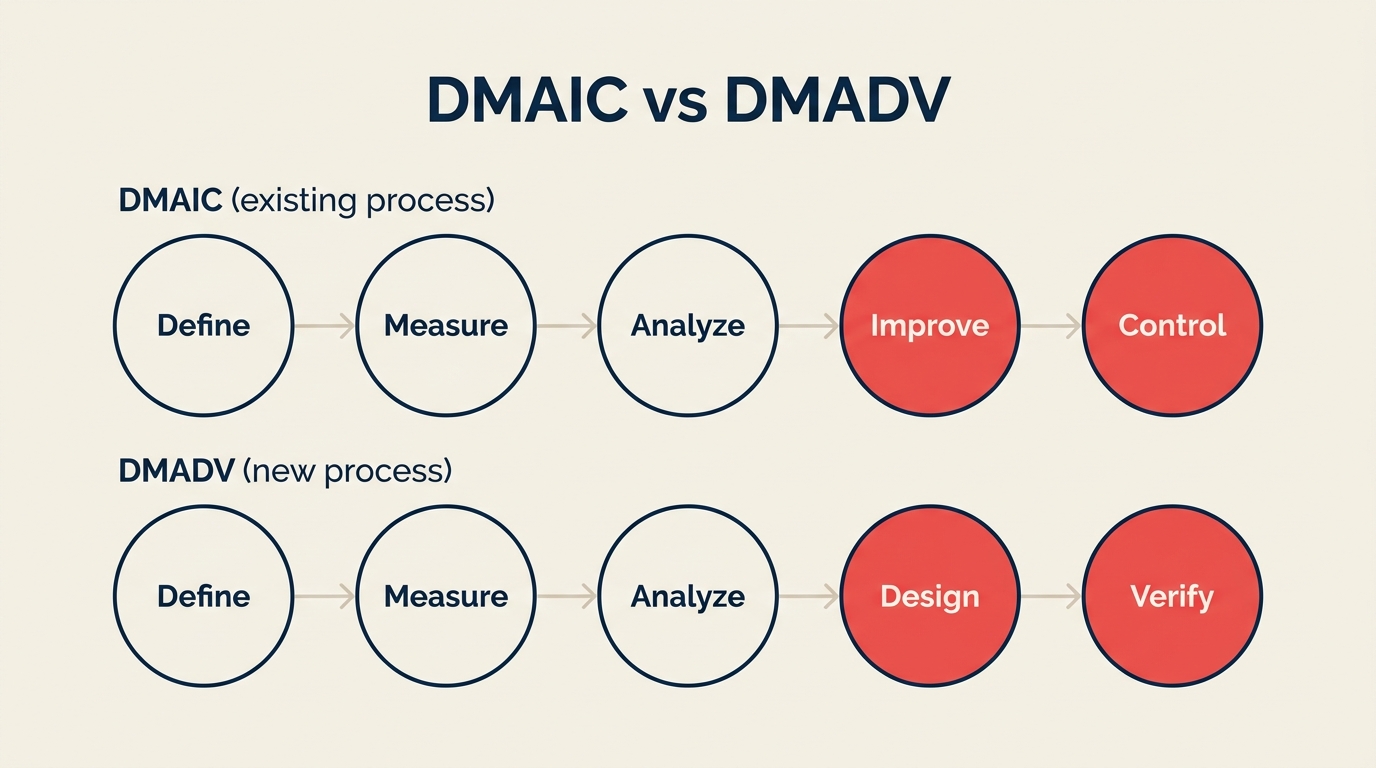
DMAIC vs DMADV: Kapan Menggunakan Masing-Masing
| Dimensi | DMAIC | DMADV |
|---|---|---|
| Gunakan ketika | Sebuah proses sudah ada dan perlu ditingkatkan | Proses atau produk baru perlu dirancang |
| Tujuan | Kurangi variasi dan cacat pada kondisi saat ini | Rancang untuk mutu Six Sigma sejak awal |
| Fase | Define, Measure, Analyze, Improve, Control | Define, Measure, Analyze, Design, Verify |
| Proyek umum | Pemenuhan pesanan, kesalahan call center, tingkat scrap | Peluncuran produk baru, fitur perangkat lunak, peluncuran layanan |
DMAIC jauh lebih umum karena sebagian besar organisasi memperbaiki proses yang sudah ada, bukan membangun yang baru dari nol. Anda mencapai DMADV ketika proses saat ini begitu rusak sehingga perancangan ulang lebih murah daripada perbaikan, atau ketika Anda memperkenalkan sesuatu yang sepenuhnya baru dan ingin menanamkan mutu sebelum diluncurkan.
Kedua kerangka berbagi tiga fase pertama. Perbedaan terjadi di fase keempat, di mana DMAIC bertanya "bagaimana kita meningkatkan apa yang ada?" dan DMADV bertanya "bagaimana kita merancang apa yang seharusnya ada?"
Cara Menjalankan Proyek DMAIC dalam 5 Fase
Define
Nyatakan masalah dalam istilah yang terukur dan dapatkan penyelarasan pemangku kepentingan sebelum menyentuh data apa pun. Pernyataan masalah yang samar ("kualitasnya buruk") menghasilkan proyek yang samar. Pernyataan yang tajam ("tingkat pengembalian pelanggan untuk lini produk X adalah 4,2%, dibandingkan target kami 1,5%, dengan biaya $320K/tahun") memberikan tim garis finis.
Hasil yang dapat diserahkan:
- Piagam proyek dengan ruang lingkup, jadwal, dan target keuangan
- Peta SIPOC (Suppliers, Inputs, Process, Outputs, Customers)
- Ringkasan Voice of the Customer (VOC) dengan persyaratan critical-to-quality (CTQ)
Measure
Tetapkan garis dasar yang andal. Anda perlu mengetahui persis seberapa buruk proses saat ini sebelum dapat mengklaim perbaikan. Fase ini juga memvalidasi sistem pengukuran itu sendiri.
Hasil yang dapat diserahkan:
- DPMO garis dasar dan tingkat sigma untuk proses tersebut
- Measurement System Analysis (MSA / Gauge R&R) yang mengkonfirmasi keandalan data
- Rencana pengumpulan data dengan ukuran sampel dan frekuensi pengumpulan
Analyze
Temukan akar masalah variasi dan cacat. Ini adalah fase yang paling intensif data. Tim menggunakan alat statistik dan visual untuk bergerak dari "ini adalah gejalanya" ke "ini adalah akar masalah yang terverifikasi."
Hasil yang dapat diserahkan:
- Diagram fishbone (Ishikawa) yang memetakan penyebab potensial
- Uji hipotesis yang mengkonfirmasi faktor mana yang signifikan secara statistik
- Daftar akar masalah yang diprioritaskan dengan bukti pendukung
Improve
Rancang, uji, dan implementasikan solusi yang secara langsung mengatasi akar masalah yang telah dikonfirmasi. Uji coba sebelum diskalakan. Dokumentasikan segalanya agar perbaikan dapat diulang.
Hasil yang dapat diserahkan:
- Pilihan solusi yang dievaluasi berdasarkan biaya, dampak, dan kelayakan
- Hasil uji coba dengan perbandingan sebelum/sesudah
- SOP yang diperbarui dan instruksi kerja untuk proses baru
Control
Kunci keuntungan. Tim manajemen proses yang meningkatkan proses kemudian meninggalkannya akan melihat proses tersebut kembali ke kondisi lama dalam beberapa bulan. Rencana kendali dan sistem pemantauan mencegah hal itu.
Hasil yang dapat diserahkan:
- Diagram kendali dengan batas kendali yang ditentukan dan aturan respons
- Rencana kendali yang menentukan apa yang dipantau, seberapa sering, dan siapa yang bertindak ketika batas dilanggar
- Dokumentasi serah terima yang memindahkan kepemilikan dari tim proyek ke pemilik proses
Alat Inti Six Sigma
| Alat | Fase | Tujuan |
|---|---|---|
| SIPOC | Define | Memetakan proses di tingkat tinggi: Suppliers, Inputs, langkah Process, Outputs, Customers |
| Voice of Customer (VOC) | Define | Menerjemahkan umpan balik pelanggan ke dalam persyaratan mutu yang terukur (CTQ) |
| Diagram fishbone | Analyze | Peta sebab-akibat visual yang mengelompokkan akar masalah potensial berdasarkan kategori |
| Diagram kendali | Measure / Control | Plot deret waktu dengan batas kendali statistik untuk membedakan variasi normal dari sinyal |
| FMEA | Improve | Failure Mode and Effects Analysis: menilai risiko (keparahan x kejadian x deteksi) untuk memprioritaskan perbaikan |
| Uji hipotesis | Analyze | t-test, ANOVA, chi-square -- mengkonfirmasi apakah perbedaan yang diamati signifikan secara statistik |
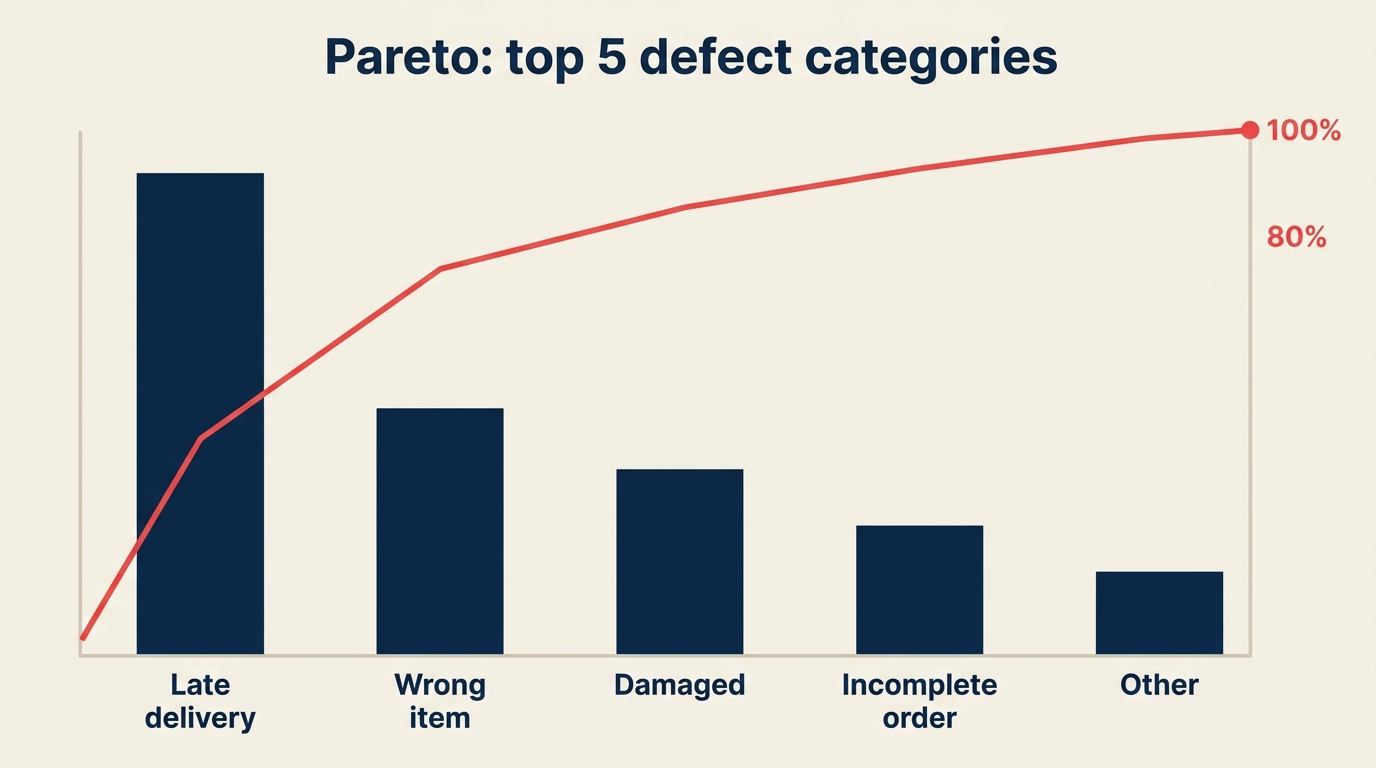
| Pareto chart | Analyze | Diagram batang yang diurutkan berdasarkan frekuensi; menunjukkan beberapa penyebab yang mendorong sebagian besar cacat (80/20) |
| Analisis regresi | Analyze | Mengukur hubungan antara variabel input dan mutu output; mengidentifikasi penggerak utama |
Contoh Six Sigma per Industri
| Industri | Masalah | Tingkat cacat sebelum | Perbaikan | Tingkat cacat sesudah | Perkiraan penghematan |
|---|---|---|---|---|---|
| Manufaktur | Cacat pengelasan pada rangka otomotif | 8.200 DPMO (sigma 3,9) | Jig fixture yang dirancang ulang; ditambahkan inspeksi visi dalam lini | 410 DPMO (sigma 4,7) | $2,1 juta/tahun dalam scrap dan pengerjaan ulang |
| Kesehatan | Kesalahan pemberian obat di ICU | 4.500 kesalahan/juta dosis | Pemindaian barcode di sisi tempat tidur; alur kerja apoteker yang diperbarui | 310 kesalahan/juta dosis | Menghindari perkiraan $1,8 juta dalam kewajiban kejadian yang merugikan |
| Dukungan SaaS | Tingkat salah routing tiket (tim yang salah menerima tiket) | 11% dari tiket masuk | Pengklasifikasi triase yang dilatih ulang; logika routing dibangun ulang dengan data dari audit 90 hari | 1,8% dari tiket masuk | 900 jam/tahun waktu pengerjaan ulang agen dipulihkan |
Angka-angka ini mewakili hasil industri yang terdokumentasi, bukan hipotesis. Polanya di ketiga kasus: ukur terlebih dahulu, temukan akar masalah, ubah sistemnya, kemudian ukur ulang.
Lean vs Six Sigma vs Lean Six Sigma
| Kerangka | Fokus utama | Pertanyaan inti | Alat tipikal |
|---|---|---|---|
| Lean | Kecepatan dan penghapusan pemborosan | Di mana waktu terbuang? | Value stream maps, 5S, Kanban, Kaizen |
| Six Sigma | Pengurangan cacat dan variasi | Di mana mutu gagal? | DMAIC, diagram kendali, uji hipotesis, FMEA |
| Lean Six Sigma | Keduanya | Di mana kita membuang waktu dan menghasilkan cacat? | Toolset gabungan dari keduanya |
Lean dan Six Sigma saling melengkapi, bukan bersaing. Lean mempercepat proses; Six Sigma membuatnya lebih akurat. Lean Six Sigma menerapkan kedua sudut pandang secara bersamaan, itulah mengapa sebagian besar organisasi besar saat ini menjalankan program gabungan daripada memilih salah satu. Ini berpasangan baik dengan kerangka BPM dan pendekatan terstruktur seperti siklus PDCA.
Manfaat dan Keterbatasan
Yang dilakukan Six Sigma dengan baik:
- Menciptakan bahasa umum untuk mutu di seluruh departemen dan geografi
- Memaksa ketelitian akar masalah, sehingga perbaikan mengatasi penyebab, bukan gejala
- Menghasilkan hasil yang terdokumentasi dan dapat diaudit dengan nilai keuangan yang melekat
- Membangun kapabilitas internal melalui sistem belt, sehingga keahlian tetap ada di dalam
- Berlaku dalam skala apa pun, dari tim operasi lima orang hingga perusahaan 50.000 orang
Di mana tim mengalami hambatan:
- Dokumentasi berat dan analisis statistik memperlambat proyek; tidak cocok untuk eksperimen siklus cepat
- Risiko "project theater" di mana tim menyelesaikan dokumen tanpa benar-benar mengubah proses
- Dapat terasa terlalu berat untuk organisasi kecil tanpa sumber daya Black Belt yang berdedikasi
- Kurang efektif ketika masalah tidak terdefinisi dengan baik atau data tidak dapat diandalkan
- Bekerja paling baik untuk proses yang berulang dan terukur; lebih sulit diterapkan pada pekerjaan kreatif atau berbasis pengetahuan
Memadukan Six Sigma dengan prinsip Lean dan model kematangan proses yang sehat mengatasi sebagian besar kesenjangan ini.
Pertanyaan yang Sering Diajukan
Berapa sigma yang "cukup baik"? Sebagian besar produsen menargetkan 4 sigma (6.210 DPMO) sebagai minimum praktis. Industri kritis keamanan (dirgantara, perangkat medis, farmasi) menargetkan 6 sigma. Untuk produk SaaS, "cukup baik" bergantung pada dampak pengguna: salah ketik dalam tooltip bukan kelas cacat yang sama dengan bug kehilangan data. Definisikan CTQ Anda terlebih dahulu, kemudian tetapkan target sigma.
Berapa lama sertifikasi Black Belt? Program Black Belt tipikal berlangsung empat hingga enam bulan pelatihan kelas dan online (160-200 jam), diikuti dengan menyelesaikan satu atau dua proyek nyata sebelum sertifikasi diberikan. Beberapa program dari ASQ, IASSC, atau Villanova berlangsung hingga setahun ketika persyaratan penyelesaian proyek disertakan. Persyaratan berbasis proyek itulah yang memisahkan sertifikasi bermakna dari sertifikasi di atas kertas saja.
Apakah Six Sigma masih relevan di perusahaan agile atau berbasis AI? Ya, meskipun penerapannya berubah. Sprint agile tidak menggantikan kebutuhan akan pengukuran proses; hanya mempersingkat siklus. Tim yang menjalankan continuous deployment masih memerlukan diagram kendali untuk tingkat cacat, error budget, dan kinerja SLA. Produk berbasis AI memperkenalkan jenis cacat baru (model drift, tingkat halusinasi, lonjakan latensi) yang ditangani dengan baik oleh logika pengukuran Six Sigma. Hierarki belt mungkin terasa berat dalam konteks startup, namun logika DMAIC yang mendasarinya dapat diskalakan ke bawah dengan bersih.
Apa perbedaan antara Six Sigma dan Lean? Six Sigma mengurangi variasi dan cacat melalui analisis statistik. Lean mengurangi pemborosan dan mempercepat aliran melalui manajemen visual dan perbaikan berkelanjutan (metodologi 5S, Kanban, value stream mapping). Keduanya meningkatkan mutu; keduanya menyerang akar masalah yang berbeda. Lean Six Sigma menggabungkan kedua toolset untuk organisasi yang menginginkan proses yang lebih cepat DAN lebih akurat.
Apakah Anda perlu sertifikasi untuk menerapkan Six Sigma? Tidak. Alat-alatnya (diagram fishbone, diagram kendali, analisis Pareto) terdokumentasi secara publik dan tersedia bebas. Sebuah tim dapat menjalankan proyek DMAIC tanpa sertifikasi formal apa pun. Sertifikasi penting ketika Anda memimpin proyek dalam skala besar, melatih orang lain, atau bekerja di industri di mana klien atau regulator mengharapkan kompetensi yang terdokumentasi. Untuk tim yang baru memulai, melatih satu orang ke tingkat Green Belt biasanya sudah cukup untuk menjalankan beberapa proyek pertama dengan baik.
Six Sigma telah bertahan selama empat dekade karena logika intinya sulit dibantah: ukur hal yang penting, temukan penyebab sebenarnya, perbaiki sistemnya, kemudian pantau untuk memastikan perbaikan bertahan. Apakah Anda menerapkannya dengan hierarki belt penuh atau sekadar meminjam struktur DMAIC untuk proyek tim kecil, disiplin data di atas opini adalah yang membuat perbedaan.

Senior Operations & Growth Strategist
On this page
- Apa Itu Six Sigma?
- Fakta Utama
- 5 Prinsip Inti Six Sigma
- Belt Six Sigma: Siapa yang Melakukan Apa
- DMAIC vs DMADV: Kapan Menggunakan Masing-Masing
- Cara Menjalankan Proyek DMAIC dalam 5 Fase
- Define
- Measure
- Analyze
- Improve
- Control
- Alat Inti Six Sigma
- Contoh Six Sigma per Industri
- Lean vs Six Sigma vs Lean Six Sigma
- Manfaat dan Keterbatasan
- Pertanyaan yang Sering Diajukan