Bahasa Indonesia
BPMN: Business Process Model and Notation Dijelaskan
Turn this article into takeaways for your work.
Each assistant summarizes the article only for you and suggests best practices for your work.
BPMN memberi Anda bahasa universal untuk menggambar proses bisnis yang dapat dibaca oleh analis bisnis maupun pengembang perangkat lunak tanpa memerlukan penerjemah. Business Process Model and Notation (BPMN) adalah notasi paling mendekati standar internasional dalam manajemen proses, dan merupakan notasi yang paling banyak diandalkan oleh platform BPM, alat otomasi workflow, dan tim perbaikan proses.
Apa Itu BPMN?
BPMN adalah standar notasi grafis untuk memodelkan proses bisnis. Dikelola oleh Object Management Group (OMG), badan standar yang sama di balik UML. Versi saat ini, BPMN 2.0, dirilis pada tahun 2011 dan menambahkan kemampuan agar diagram tidak hanya dapat dibaca oleh manusia tetapi juga dapat dieksekusi oleh mesin, artinya file BPMN 2.0 dapat diimpor langsung ke dalam mesin workflow dan dijalankan sebagai kode.
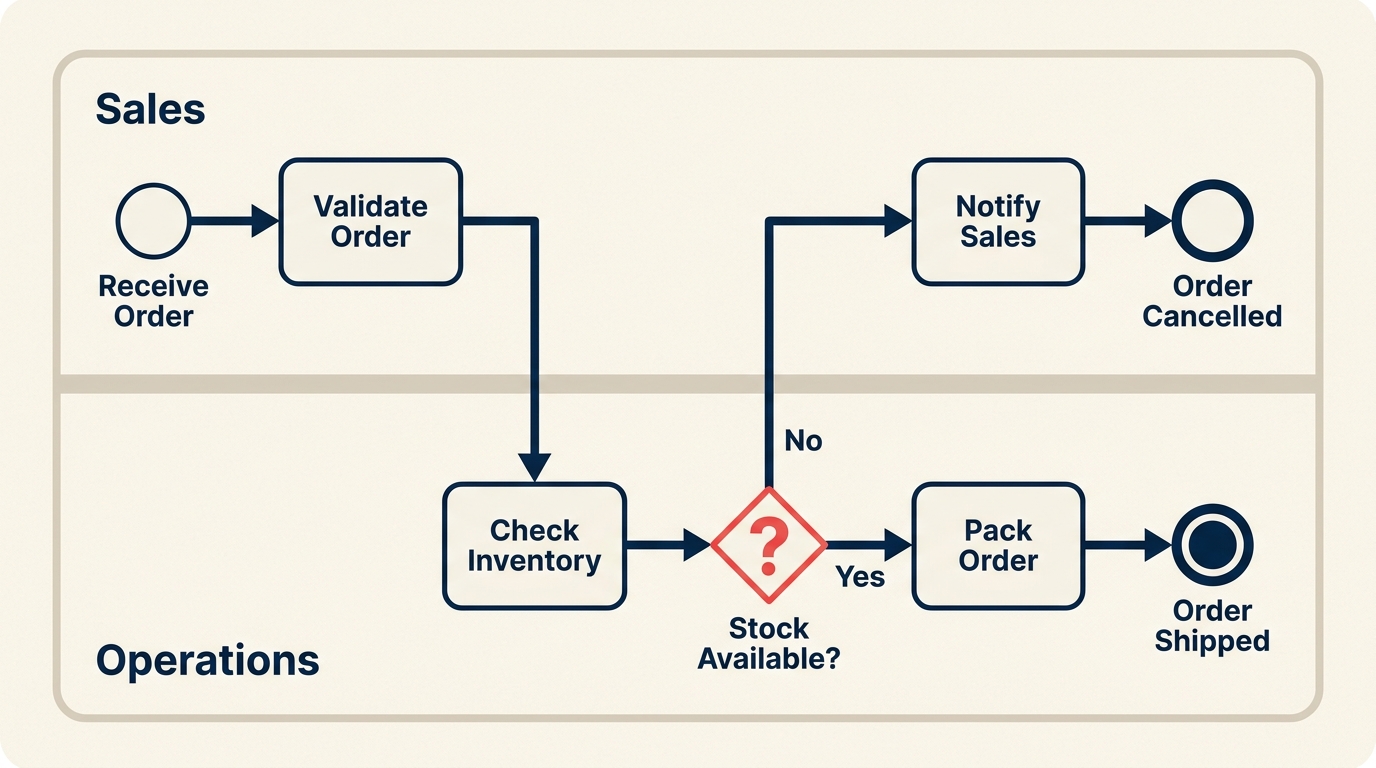
Pada intinya, BPMN menggambarkan proses sebagai urutan tugas, kejadian, dan keputusan yang dihubungkan oleh aliran, diorganisasikan ke dalam pool dan lane yang menunjukkan siapa bertanggung jawab atas apa. Notasi ini cukup tepat untuk menangkap penanganan pengecualian yang kompleks, eksekusi paralel, dan pesan antar-sistem, namun tetap cukup visual untuk dipahami kepala departemen dalam sebuah pertemuan.
Fakta Kunci
- Organisasi yang menstandarkan notasi proses seperti BPMN melaporkan 30% lebih sedikit miskomunikasi antara tim bisnis dan IT selama proyek otomasi proses (Gartner, 2023).
- BPMN 2.0 adalah standar ISO (ISO/IEC 19510:2013), mengkonfirmasi statusnya sebagai tolok ukur global untuk pemodelan proses (ISO, 2013).
- Survei 2022 oleh BPM Institute menemukan bahwa BPMN adalah notasi pemodelan yang paling banyak digunakan di antara organisasi yang menjalankan program perbaikan proses formal, disebutkan oleh 67% responden (BPM Institute, 2022).
Empat Kategori Elemen BPMN
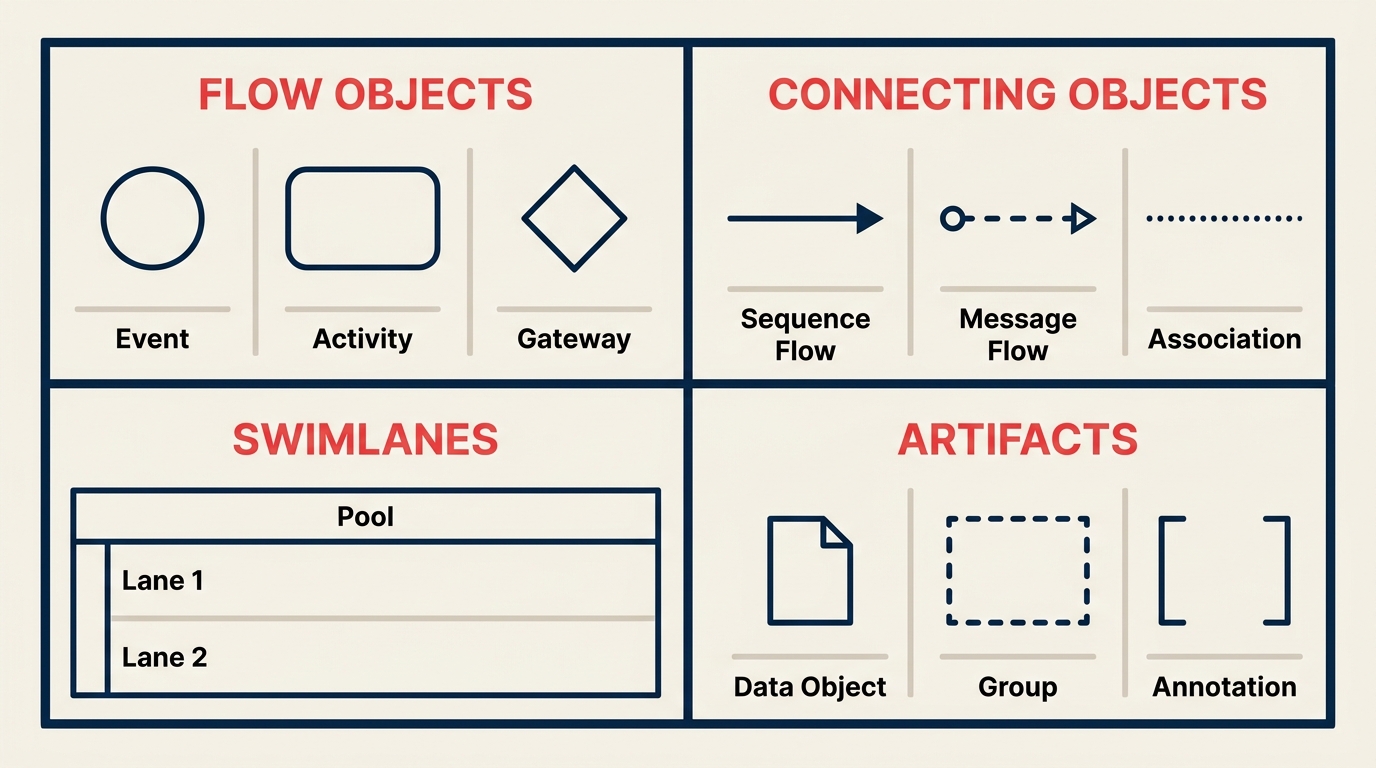
BPMN mengorganisir setiap simbol ke dalam empat kategori. Memahami struktur ini jauh lebih memudahkan pembelajaran notasi karena Anda tidak menghafal daftar datar bentuk-bentuk, melainkan sebuah sistem yang logis.
| Kategori | Elemen | Tujuan |
|---|---|---|
| Flow Objects | Events, Activities, Gateways | Blok bangunan utama yang mendefinisikan apa yang terjadi dalam proses |
| Connecting Objects | Sequence Flow, Message Flow, Association | Garis yang menghubungkan elemen dan menunjukkan arah pekerjaan atau komunikasi |
| Swimlanes | Pools, Lanes | Wadah yang menetapkan tanggung jawab kepada peserta atau departemen |
| Artifacts | Data Objects, Groups, Annotations | Informasi tambahan yang memperjelas tanpa mengubah logika proses |
Flow Objects adalah tempat sebagian besar aksi berlangsung. Events menandai hal-hal yang terjadi (proses dimulai, timer berbunyi, pesan tiba). Activities adalah pekerjaan yang sedang dilakukan. Gateways adalah titik keputusan dan logika percabangan.
Connecting Objects adalah garis-garis. Sequence Flow (panah padat) menunjukkan urutan aktivitas dalam satu proses. Message Flow (panah putus-putus) menunjukkan komunikasi antara dua pool yang terpisah. Associations menghubungkan artifact, seperti anotasi teks, ke suatu elemen.
Swimlanes layak mendapat penekanan tersendiri karena merekalah yang membuat BPMN begitu berguna untuk proses lintas fungsi. Pool mewakili satu peserta, sering kali sebuah organisasi atau sistem. Lane di dalam pool membagi tanggung jawab lebih lanjut, biasanya berdasarkan peran atau departemen. Inilah cara satu diagram BPMN dapat menampilkan pelanggan yang memesan, gudang yang memenuhi pesanan, dan sistem keuangan yang memproses pembayaran, semuanya dalam satu tampilan.
Artifacts tidak mengubah logika proses tetapi membuat diagram mudah dibaca. Data Object menunjukkan data yang digunakan atau dihasilkan oleh suatu tugas. Group mengelompokkan elemen-elemen yang terkait secara visual. Annotations memungkinkan Anda menambahkan catatan dalam bahasa biasa bagi peninjau yang membutuhkan konteks.
Simbol-Simbol Utama BPMN
Inilah simbol-simbol yang akan Anda gunakan di hampir setiap diagram BPMN. Kuasai ini dan Anda dapat membaca 90% diagram BPMN dunia nyata seketika.
Events
| Simbol | Jenis | Makna |
|---|---|---|
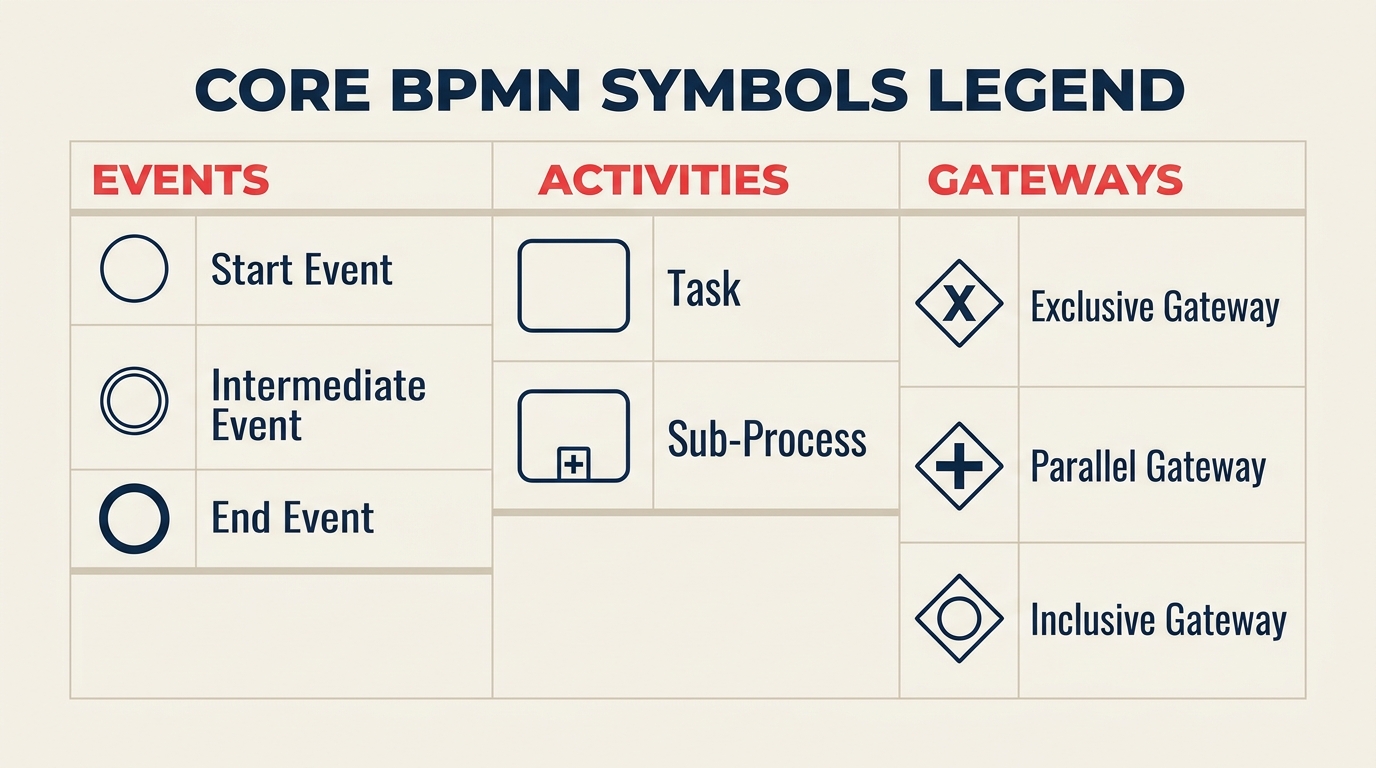
| Lingkaran dengan border tipis | Start Event | Proses dimulai di sini |
| Lingkaran dengan border ganda | Intermediate Event | Sesuatu terjadi di tengah proses (timer, pesan, error) |
| Lingkaran dengan border tebal | End Event | Proses berakhir di sini |
Events dapat membawa penanda di dalam lingkaran: amplop untuk event pesan, jam untuk event timer, petir untuk event error. Jenis penanda memberi tahu Anda apa yang memicu atau dihasilkan dari event tersebut.
Activities
| Simbol | Jenis | Makna |
|---|---|---|
| Persegi panjang membulat | Task | Satu unit pekerjaan atomik yang dilakukan oleh orang atau sistem |
| Persegi panjang membulat dengan tanda plus | Sub-Process | Proses yang diciutkan dengan aliran internalnya sendiri |
Task adalah elemen yang paling umum dalam diagram BPMN mana pun. Sub-Process memungkinkan Anda menyembunyikan kompleksitas: Anda melihat satu kotak di diagram induk, tetapi Anda dapat memperluasnya untuk mengungkapkan aliran BPMN lengkap di dalamnya.
Gateways
| Simbol | Jenis | Makna |
|---|---|---|
| Berlian dengan X | Exclusive Gateway (XOR) | Hanya satu jalur keluar yang diambil, berdasarkan kondisi |
| Berlian dengan plus | Parallel Gateway (AND) | Semua jalur keluar dieksekusi secara bersamaan |
| Berlian dengan lingkaran | Inclusive Gateway (OR) | Satu atau lebih jalur keluar diambil berdasarkan kondisi |
Gateway adalah tempat BPMN menjadi lebih tepat dari flowchart biasa. Berlian biasa dalam flowchart hanya berarti "keputusan." Dalam BPMN, jenis gateway memberi tahu Anda apakah Anda memilih satu jalur, menjalankan beberapa jalur secara paralel, atau mengaktifkan kombinasi jalur secara kondisional.
BPMN vs Flowchart vs UML
Ketiganya sering dikacaukan. Mereka memecahkan masalah yang terkait tetapi berbeda.
| Fitur | BPMN | Flowchart | UML Activity Diagram |
|---|---|---|---|
| Badan standar | OMG (BPMN 2.0) | ANSI X3.5 / ISO 5807 | OMG (UML 2.x) |
| Audiens utama | Analis bisnis, insinyur proses, pengembang | Siapa saja | Insinyur perangkat lunak |
| Dapat dieksekusi mesin | Ya (BPMN 2.0 XML) | Tidak | Tidak |
| Komunikasi lintas organisasi | Ya (pools, message flows) | Terbatas | Tidak |
| Jenis gateway | Beragam (XOR, AND, OR, berbasis event) | Berlian tunggal | Fork/join |
| Terbaik untuk | Proses kompleks, otomatis, atau lintas fungsi | Dokumentasi cepat, pelatihan | Perilaku perangkat lunak, desain sistem |
Perbedaan utamanya: flowchart adalah cara cepat dan informal untuk mendokumentasikan proses bagi pembaca manusia. BPMN adalah notasi formal yang dapat dikembangkan hingga skala otomasi kelas enterprise. UML Activity Diagram mirip dengan BPMN dalam ketepatan tetapi dirancang untuk perilaku sistem perangkat lunak daripada operasi bisnis.
Untuk sebagian besar pekerjaan dokumentasi proses, mulailah dengan flowchart atau peta proses bisnis. Ketika proses melintas batas organisasi, melibatkan penanganan pengecualian yang kompleks, atau perlu berjalan di dalam platform BPM, BPMN adalah alat yang tepat.
Manfaat dan Keterbatasan BPMN
Manfaat
Bahasa bersama lintas tim. Pemangku kepentingan bisnis dan IT dapat melihat diagram yang sama dan memahaminya. Ini mengurangi kesalahan penerjemahan yang menghancurkan proyek otomasi proses sebelum dimulai.
Presisi untuk otomasi. Diagram BPMN 2.0 dapat diekspor sebagai XML dan diimpor ke mesin eksekusi seperti Camunda, Activiti, atau IBM BPM. Diagram ITU ADALAH spesifikasinya. Tidak ada ambiguitas dalam penerjemahan dari dokumen ke kode.
Menangani kompleksitas dunia nyata. Jalur pengecualian, tugas paralel, event berbasis timer, dan pesan antar-sistem semuanya memiliki notasi eksplisit. BPMN tidak memaksa Anda menyederhanakan bagian yang rumit.
Ekosistem alat. Bizagi, Signavio, Camunda Modeler, ARIS, dan Lucidchart semuanya mendukung BPMN 2.0. Diagram dapat dipindahkan antar alat ini melalui format XML standar.
Keterbatasan
Kurva pembelajaran. BPMN memiliki lusinan simbol. Membuat tim menggunakannya secara konsisten memerlukan pelatihan. Diagram BPMN yang digambar dengan buruk dan konvensi campur aduk lebih sulit dibaca daripada flowchart sederhana.
Berlebihan untuk proses sederhana. Proses persetujuan tiga langkah tidak memerlukan pool, lane, gateway berbasis event, dan message flow. Proses yang lebih sederhana lebih cocok dalam format yang lebih sederhana.
Bukan pengganti dokumentasi proses. BPMN menunjukkan aliran. Ini tidak menangkap aturan bisnis, persyaratan sistem, definisi data, atau konteks kebijakan di sekitar suatu proses. Hal-hal tersebut masih memerlukan dokumentasi proses di samping diagram.
Cara Membuat Diagram BPMN
Langkah 1: Definisikan Ruang Lingkup dan Peserta
Beri nama proses dan identifikasi semua pihak yang terlibat: tim internal, organisasi eksternal, dan sistem apa pun yang berpartisipasi. Setiap organisasi atau sistem yang mengirim atau menerima aliran proses menjadi Pool. Tim atau peran dalam organisasi Anda menjadi Lane di dalam pool Anda.
Langkah 2: Identifikasi Event Awal dan Akhir
Tempatkan Start Event (lingkaran tipis) di mana pemicu terjadi. Tempatkan satu atau lebih End Event (lingkaran tebal) untuk setiap hasil. Proses pemenuhan pesanan, misalnya, mungkin memiliki dua end event: "Pesanan Dikirim" dan "Pesanan Dibatalkan." Mendapatkan jangkar-jangkar ini dengan benar terlebih dahulu membuat sisa diagram tidak melebar.
Langkah 3: Petakan Urutan Tugas
Daftar setiap aktivitas secara berurutan dan tempatkan sebagai Task (persegi panjang membulat) di lane yang sesuai. Bekerjalah dengan orang yang benar-benar melakukan pekerjaan, bukan hanya orang yang mengelolanya. Kesenjangan antara "bagaimana menurut kami cara kerjanya" dan "bagaimana sebenarnya cara kerjanya" adalah tempat sebagian besar masalah proses bersembunyi. Ini mencerminkan pendekatan dalam pemetaan proses bisnis.
Langkah 4: Tambahkan Gateway untuk Keputusan dan Percabangan
Tempatkan Exclusive Gateway di mana pun proses harus memilih satu jalur. Gunakan Parallel Gateway di mana pun beberapa hal terjadi pada saat yang bersamaan. Gunakan Intermediate Events untuk apa pun yang berbasis waktu, dipicu oleh pesan, atau didorong oleh error. Beri label setiap kondisi gateway pada sequence flow keluarannya agar pembaca tahu persis kondisi mana yang menuju ke mana.
Langkah 5: Hubungkan, Validasi, dan Sempurnakan
Hubungkan semua elemen dengan Sequence Flow di dalam setiap pool dan Message Flow antar pool. Kemudian tinjau diagram dengan pemangku kepentingan dan tanyakan: "Apakah setiap jalur memiliki end event? Apakah setiap gateway memiliki semua kondisinya yang diberi label? Apakah ada langkah yang terlewat?" Telusuri jalur bahagia terlebih dahulu, lalu lacak setiap cabang pengecualian ke end event-nya. Diagram BPMN yang valid tidak memiliki jalan buntu dan tidak ada jalur yang ambigu.
Contoh BPMN
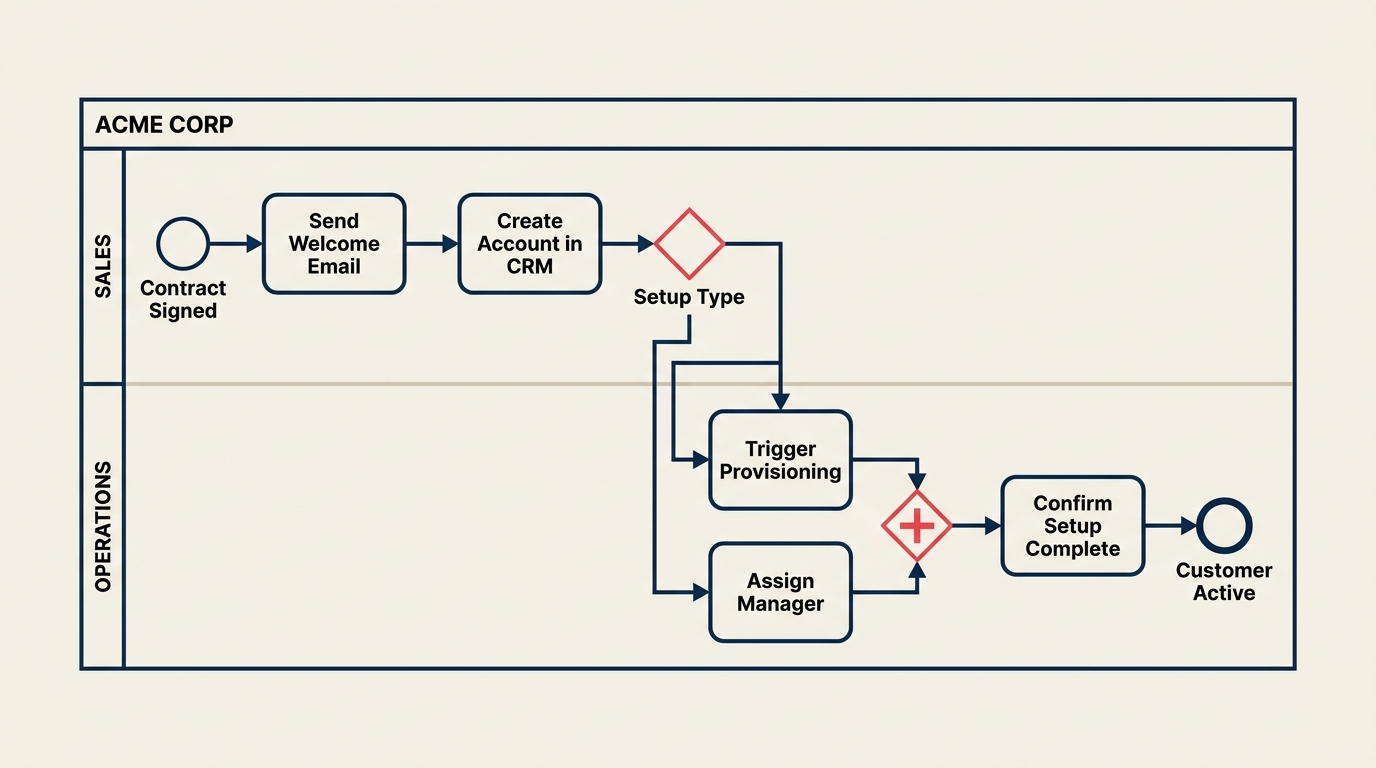
Inilah tampilan proses onboarding pelanggan dalam BPMN, menggunakan satu pool dengan dua lane: Sales dan Operations.
Pool: "Acme Corp" (peserta internal) Lanes: Sales, Operations
Aliran:
- Start Event (pesan): Kontrak Ditandatangani
- Task (lane Sales): Kirim email selamat datang
- Task (lane Sales): Buat akun di CRM
- Exclusive Gateway: Apakah setup manual atau otomatis?
- Jalur A (otomatis): Task (lane Operations): Picu provisi otomatis
- Jalur B (manual): Task (lane Operations): Tugaskan implementation manager, lalu Task: Jadwalkan kickoff call
- Kedua jalur bergabung di Parallel Gateway: Jalankan pengecekan latar belakang dan kirim survei onboarding secara bersamaan
- Task (lane Operations): Konfirmasi semua pengecekan selesai
- End Event: Pelanggan Aktif
Exclusive gateway di langkah 4 mencerminkan keputusan nyata yang dibuat tim Anda. Parallel gateway di langkah 7 mencerminkan pekerjaan yang benar-benar terjadi pada saat yang bersamaan. Keduanya tidak akan jelas dalam flowchart biasa dengan satu bentuk berlian.
Diagram ini dapat diimpor ke platform BPM dan digunakan untuk mengotomasi tugas provisi, memicu survei pada saat yang tepat, dan memberi tahu implementation manager ketika pengecekan latar belakang selesai. Itulah lompatan dari dokumentasi proses ke eksekusi yang dimungkinkan oleh BPMN.
Untuk konteks lebih luas tentang di mana BPMN cocok dalam program perbaikan lengkap, lihat apa itu process management dan business process management.
Praktik Terbaik
Mulai dengan jalur bahagia. Gambar skenario ideal dari awal hingga akhir sebelum menambahkan cabang pengecualian. Lebih mudah menambahkan kompleksitas daripada mengurai diagram yang mencoba menangani setiap kasus tepi sekaligus.
Beri label setiap output gateway. Setiap panah yang keluar dari gateway harus memiliki label kondisi, "Ya", "Tidak", "Jumlah > Rp10 juta", "Otomatis". Tanpa label, gateway menjadi ambigu.
Satu proses per pool, satu tanggung jawab per lane. Mencampur dua proses yang tidak terkait dalam satu pool atau menetapkan lane untuk orang dan sistem sekaligus menimbulkan kebingungan. Jaga agar batas tetap jelas.
Gunakan sub-process untuk mengelola kompleksitas. Ketika bagian diagram Anda menjadi padat, ciutkan menjadi Sub-Process. Pembaca melihat aliran tingkat tinggi; mereka yang membutuhkan detail dapat memperluasnya.
Pertahankan pool horizontal, lane diberi label dengan jelas. Konvensi di sebagian besar alat adalah aliran kiri-ke-kanan dengan pool horizontal. Orientasi yang konsisten membuat diagram mudah dipindai.
Hubungkan BPMN ke standard operating procedures Anda. Diagram BPMN menunjukkan aliran. SOP menyimpan aturan bisnis, nama alat, dan penanganan kasus tepi. Hubungkan keduanya secara eksplisit agar tidak ada dokumen yang terpencil.
Validasi dengan eksekusi, bukan hanya tinjauan. Jika platform BPM Anda dapat menjalankan diagram, jalankan pada data uji. Kesalahan dalam diagram BPMN yang hanya terdeteksi dalam tinjauan pemangku kepentingan jauh lebih mahal daripada kesalahan yang terdeteksi dalam uji coba.
Pertanyaan yang Sering Diajukan
Apa perbedaan antara BPMN dan flowchart?
Flowchart adalah diagram informal dan serbaguna untuk menunjukkan langkah dan keputusan dalam suatu proses. BPMN adalah standar formal dengan aturan tepat untuk jenis gateway, pemicu event, komunikasi pool, dan eksekusi mesin. Perbedaan praktis utamanya adalah file BPMN 2.0 dapat diimpor ke dalam mesin workflow dan dieksekusi langsung, sementara flowchart tidak bisa. Untuk dokumentasi internal sederhana, flowchart lebih cepat. Untuk otomasi, workflow lintas tim, atau definisi proses tingkat kepatuhan, BPMN adalah pilihan yang tepat.
Apa perbedaan pool dan lane dalam BPMN?
Pool mewakili peserta terpisah dalam proses, biasanya seluruh organisasi, departemen, atau sistem eksternal. Lane adalah subdivisi di dalam pool, biasanya mewakili peran, tim, atau fungsi tertentu. Semua aktivitas dalam pool berbagi proses yang sama. Message Flow melintas antar pool untuk menunjukkan komunikasi. Sequence Flow tetap berada di dalam pool. Bayangkan pool sebagai arena renang dan lane sebagai jalur renang masing-masing perenang di dalamnya.
Apa yang ditambahkan BPMN 2.0 dibandingkan versi sebelumnya?
BPMN 2.0 memperkenalkan format XML terstandarisasi yang membuat diagram dapat dibaca dan dieksekusi mesin. Ini juga memformalkan semantik setiap elemen, sehingga dua alat BPMN 2.0 menginterpretasikan diagram yang sama secara identik. Versi sebelumnya terutama merupakan standar visual tanpa model eksekusi. Versi 2.0 inilah yang mengubah BPMN dari format dokumentasi menjadi fondasi otomasi workflow.
Alat mana yang mendukung BPMN 2.0?
Alat yang paling banyak digunakan meliputi Camunda Modeler (gratis, open source), Bizagi Modeler (gratis untuk pemodelan), Signavio (enterprise), ARIS (enterprise), Lucidchart (berbasis web), dan draw.io (gratis). Semuanya mengekspor format XML BPMN 2.0 standar. Camunda adalah pilihan paling umum bagi tim yang juga membutuhkan mesin eksekusi BPMN di samping alat pemodelan.
Kapan saya harus menggunakan SIPOC daripada BPMN?
Gunakan diagram SIPOC ketika Anda perlu mendefinisikan ruang lingkup dan batas suatu proses pada level tinggi, terutama di awal proyek Six Sigma atau perbaikan. SIPOC memberi tahu Anda apa yang dilakukan proses, siapa yang terlibat, dan apa input dan outputnya. Gunakan BPMN ketika Anda perlu memodelkan bagaimana proses bekerja langkah demi langkah, termasuk keputusan, pengecualian, dan otomasi. SIPOC adalah alat pelingkupan. BPMN adalah alat pemodelan. Keduanya bekerja dengan baik secara berurutan.
Di Mana BPMN Cocok dalam Toolkit Proses yang Lebih Luas
BPMN tidak menggantikan pemetaan proses bisnis, value stream mapping, atau praktik total quality management. BPMN melengkapinya. Anda mungkin menggunakan SIPOC untuk mendefinisikan ruang lingkup, peta proses untuk mendapatkan keselarasan pemangku kepentingan, dan BPMN ketika Anda siap mengotomasi atau menyerahkan spesifikasi ke tim rekayasa.
Notasi hanya sebaik pemikiran proses di baliknya. Mulailah dengan memahami proses melalui percakapan dan standard operating procedures. Kemudian gunakan BPMN untuk membuat pemahaman itu tepat, dapat dibagikan, dan dapat dieksekusi.
Bacaan Terkait
- Business Process Mapping - fondasi visual sebelum BPMN
- What is a Flowchart? - alternatif lebih sederhana untuk dokumentasi dasar
- Value Stream Mapping - analisis proses berfokus lean dengan data waktu
- SIPOC Diagram - definisi ruang lingkup sebelum pemodelan
- Standard Operating Procedure - dokumen pendamping untuk diagram BPMN mana pun
- What is Process Management? - disiplin yang lebih luas yang dilayani BPMN
- Total Quality Management - metodologi perbaikan yang menggunakan model proses sebagai input

Senior Operations & Growth Strategist
On this page
- Apa Itu BPMN?
- Empat Kategori Elemen BPMN
- Simbol-Simbol Utama BPMN
- Events
- Activities
- Gateways
- BPMN vs Flowchart vs UML
- Manfaat dan Keterbatasan BPMN
- Manfaat
- Keterbatasan
- Cara Membuat Diagram BPMN
- Langkah 1: Definisikan Ruang Lingkup dan Peserta
- Langkah 2: Identifikasi Event Awal dan Akhir
- Langkah 3: Petakan Urutan Tugas
- Langkah 4: Tambahkan Gateway untuk Keputusan dan Percabangan
- Langkah 5: Hubungkan, Validasi, dan Sempurnakan
- Contoh BPMN
- Praktik Terbaik
- Pertanyaan yang Sering Diajukan
- Di Mana BPMN Cocok dalam Toolkit Proses yang Lebih Luas
- Bacaan Terkait