Net Revenue Retention (NRR): Formula and Benchmarks
Turn this article into takeaways for your work.
Each assistant summarizes the article only for you and suggests best practices for your work.
Net revenue retention (NRR) tells you whether your existing customer base is growing, holding steady, or quietly shrinking on its own. It's the single metric that separates SaaS companies that can scale efficiently from those that are quietly leaking revenue.
What is net revenue retention (NRR)?
Net revenue retention (NRR) measures the percentage of recurring revenue retained from an existing cohort of customers over a given period, after accounting for expansion revenue (upsells, cross-sells, seat additions), contractions (downgrades), and full cancellations (churn). New-logo revenue is explicitly excluded.
NRR is also called net dollar retention (NDR), and the two terms are interchangeable. Some vendors prefer NDR to avoid confusion with gross revenue retention (GRR), but the formula and interpretation are identical.
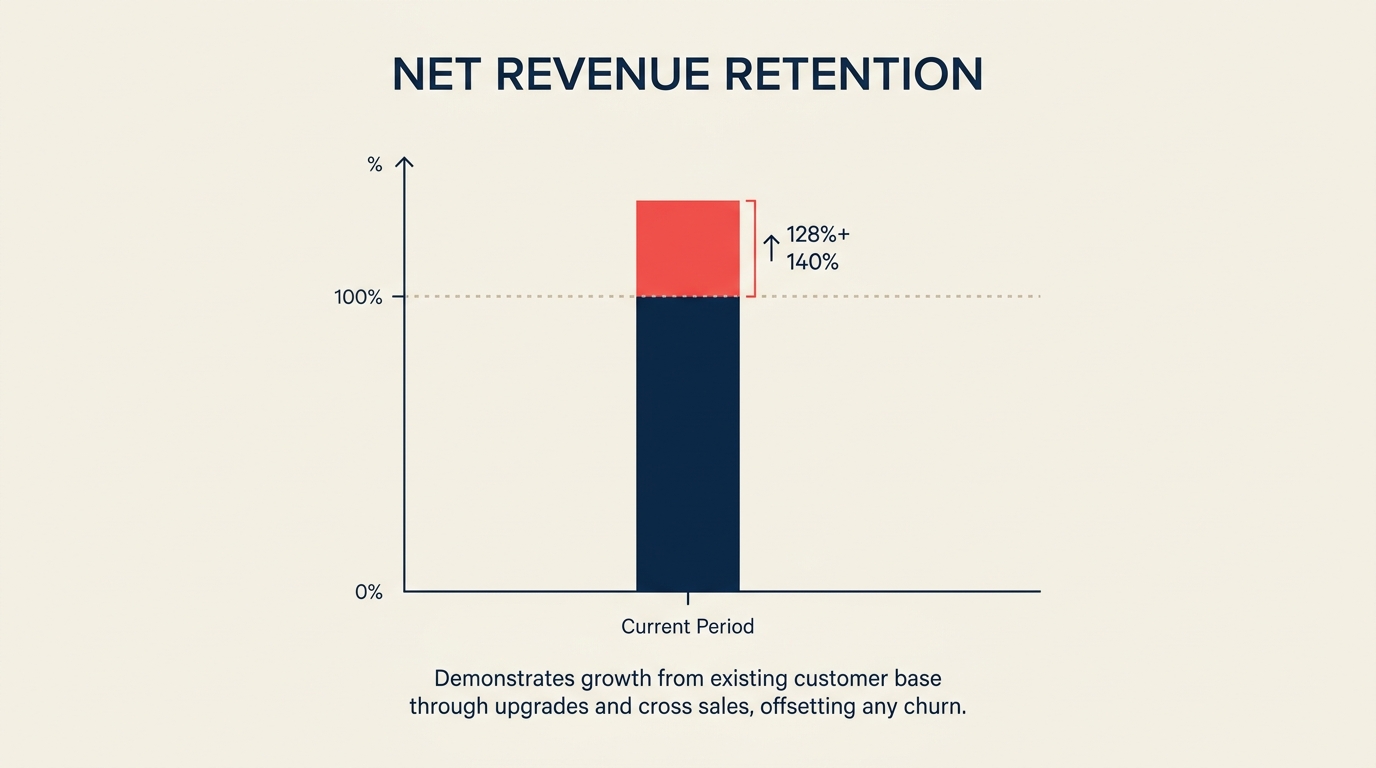
A result above 100% means expansion more than offset any losses. The customer base is growing even without a single new sale. That's the goal every subscription business aims for, because it means your annual recurring revenue compounds from the base you've already built.
Key terms:
- Expansion MRR/ARR: revenue added from existing customers (plan upgrades, additional seats, add-on products)
- Contraction MRR/ARR: revenue lost when customers downgrade to a cheaper plan
- Churned MRR/ARR: revenue lost when customers cancel entirely
- Starting MRR/ARR: the recurring revenue from a cohort at the beginning of the measurement period
Key Facts
- The median NRR across publicly traded SaaS companies sits around 106%, while top-quartile companies exceed 120% (KeyBanc Capital Markets SaaS Survey, 2023).
- Companies with NRR above 120% can sustain long-term growth with significantly less new customer acquisition spending compared to those at 90% (Bessemer Venture Partners, State of the Cloud, 2023).
- During economic downturns, NRR is the first metric institutional investors examine, often before ARR growth rate, because it signals product stickiness and customer health (Tomasz Tunguz, 2023).
Net revenue retention formula
The formula is straightforward:
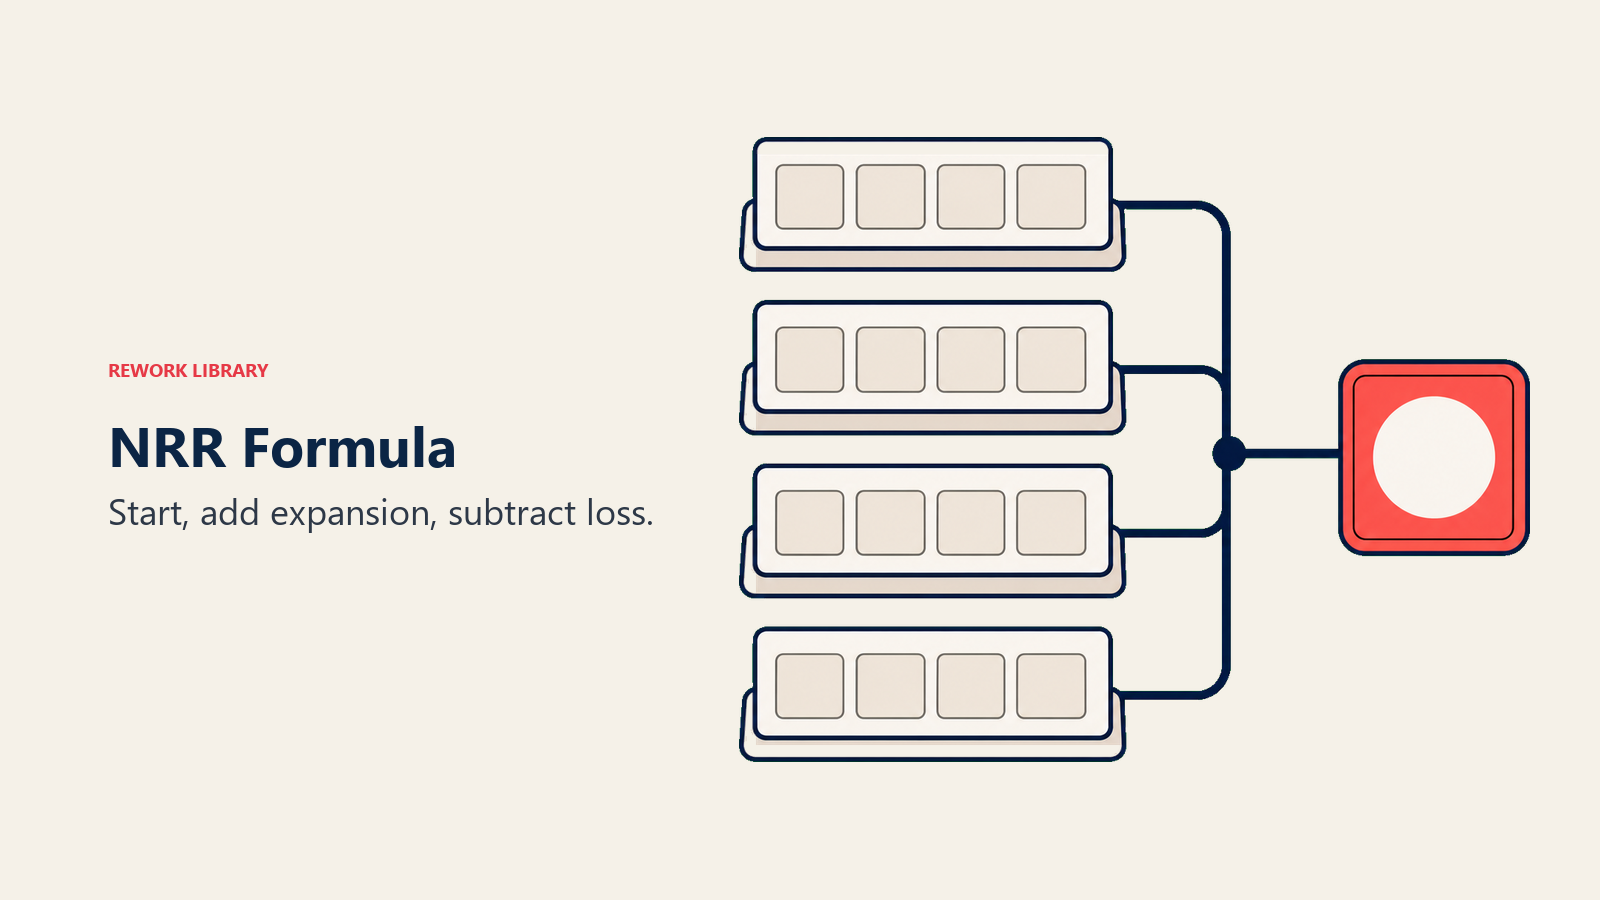
NRR = (Starting MRR + Expansion MRR - Contraction MRR - Churned MRR) / Starting MRR x 100
Or expressed as an equation:
NRR = [(Starting MRR + Expansion - Contraction - Churn) / Starting MRR] × 100
Worked example
Suppose your SaaS business starts January with the following numbers from its existing customer cohort:
| Component | Amount |
|---|---|
| Starting MRR (Jan 1) | $200,000 |
| Expansion MRR (upsells/cross-sells added in Jan) | $30,000 |
| Contraction MRR (downgrades in Jan) | $8,000 |
| Churned MRR (cancellations in Jan) | $12,000 |
| Ending MRR from cohort (Jan 31) | $210,000 |
NRR = ($200,000 + $30,000 - $8,000 - $12,000) / $200,000 x 100 = 105%
That 105% means for every dollar of recurring revenue you started with, you ended with $1.05 from that same group of customers. No new logos needed.
The same formula applies at the annual level using ARR figures. Many finance teams calculate NRR monthly, then report it as a trailing-twelve-month (TTM) average to smooth seasonal noise.
NRR vs GRR (gross revenue retention)
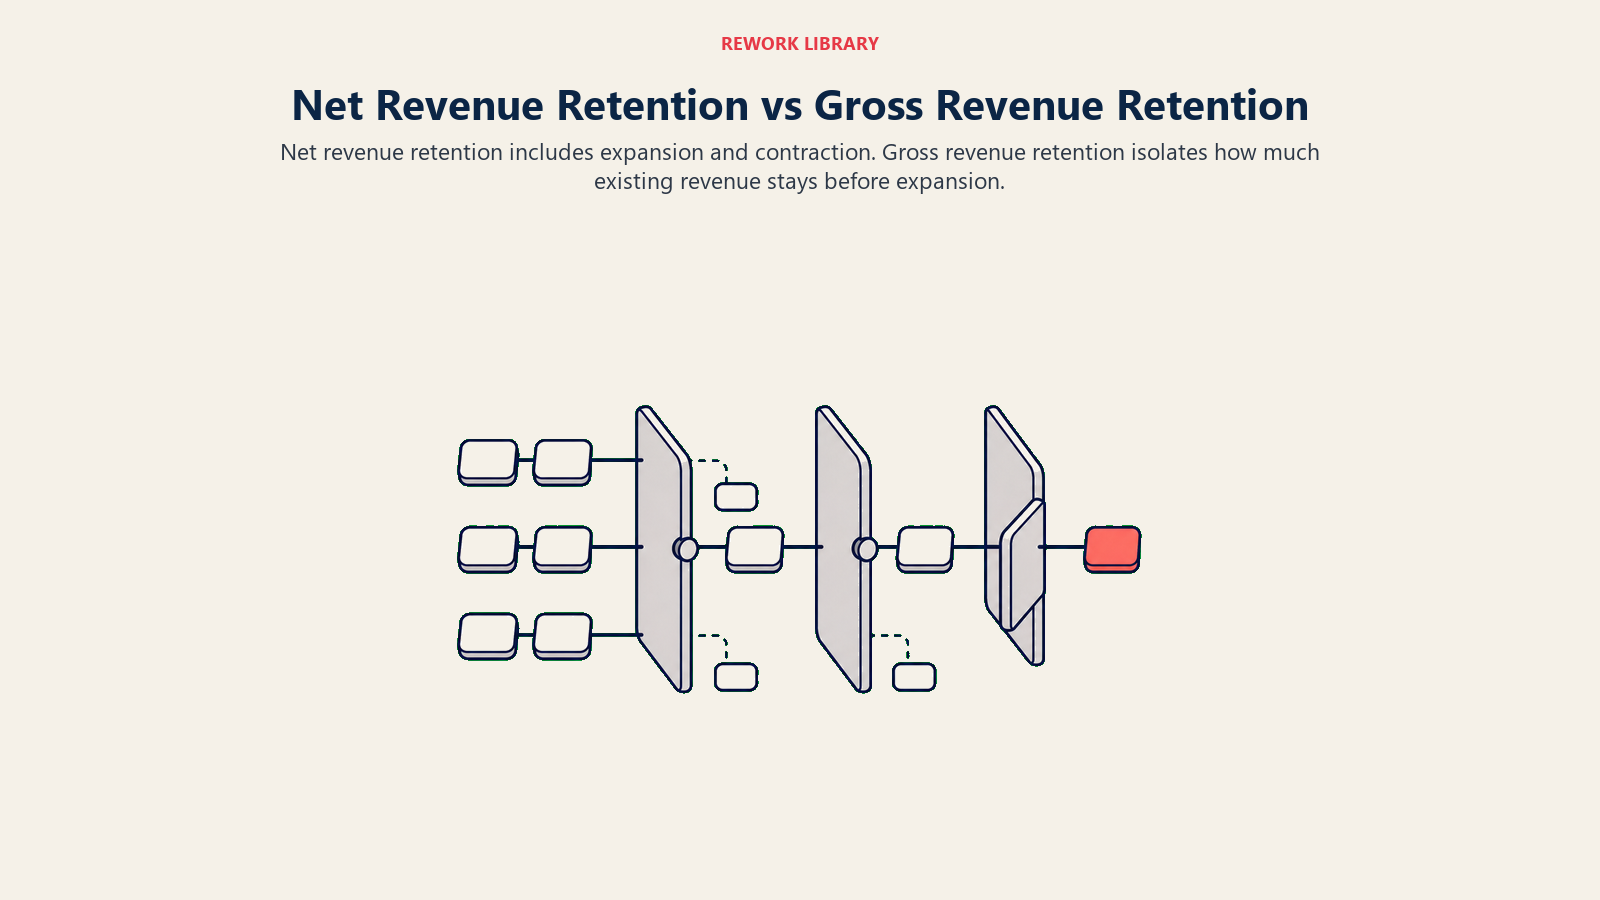
NRR and GRR both track revenue from existing customers, but they answer different questions.
| Metric | What it includes | Maximum possible value | What it signals |
|---|---|---|---|
| NRR (Net Revenue Retention) | Expansion + contraction + churn | Unlimited (can exceed 100%) | Net growth potential from existing base |
| GRR (Gross Revenue Retention) | Contraction + churn only (no expansion) | 100% (can never exceed) | Ability to keep what you have |
GRR is a ceiling: it can never be above 100% because you're only counting losses. NRR is where expansion shows up, which is why it can exceed 100%.
You need both numbers. A company with 95% GRR and 115% NRR has strong upsell motion that covers its churn. But if that upsell motion slows, the 95% GRR is an underlying problem waiting to surface. GRR answers "how leaky is the bucket?", while NRR answers "is the bucket growing or shrinking overall?"
For context on how these metrics feed into broader pipeline metrics, GRR is generally the more conservative signal investors use for floor-scenario modeling.
NRR benchmarks
Benchmarks shift by company stage and market segment. Enterprise-focused companies tend to show higher NRR because expansion via seat growth and platform add-ons is more natural in large accounts.
| Stage / Context | Good NRR | Great NRR | Best-in-class |
|---|---|---|---|
| Seed / Early-stage startup | 90%+ | 100%+ | 110%+ |
| Series B / Growth stage | 100%+ | 110%+ | 120%+ |
| Public SaaS (median) | 106% | 115%+ | 130%+ |
| Enterprise-focused SaaS | 110%+ | 120%+ | 140%+ |
| SMB-focused SaaS | 90-95% | 100%+ | 110%+ |
| Usage-based / consumption pricing | 105%+ | 120%+ | 150%+ |
A few widely cited reference points:
- Snowflake has reported NRR above 165% in its high-growth phase, driven almost entirely by consumption expansion.
- Veeva Systems consistently runs NRR above 120%, fueled by land-and-expand within pharma accounts.
- HubSpot has maintained NRR in the 100-105% range, impressive for an SMB-heavy mix where churn risk is structurally higher.
For earlier-stage companies, crossing 100% is the first meaningful milestone. It means you've built enough product value that customers want more of it. Reaching 120%+ puts a company in the top quartile regardless of stage, and that's the threshold most growth-stage investors consider "best-in-class."
NRR ties directly to how investors model your LTV/CAC ratio. A higher NRR stretches lifetime value without increasing customer acquisition cost, compressing the ratio in your favor.
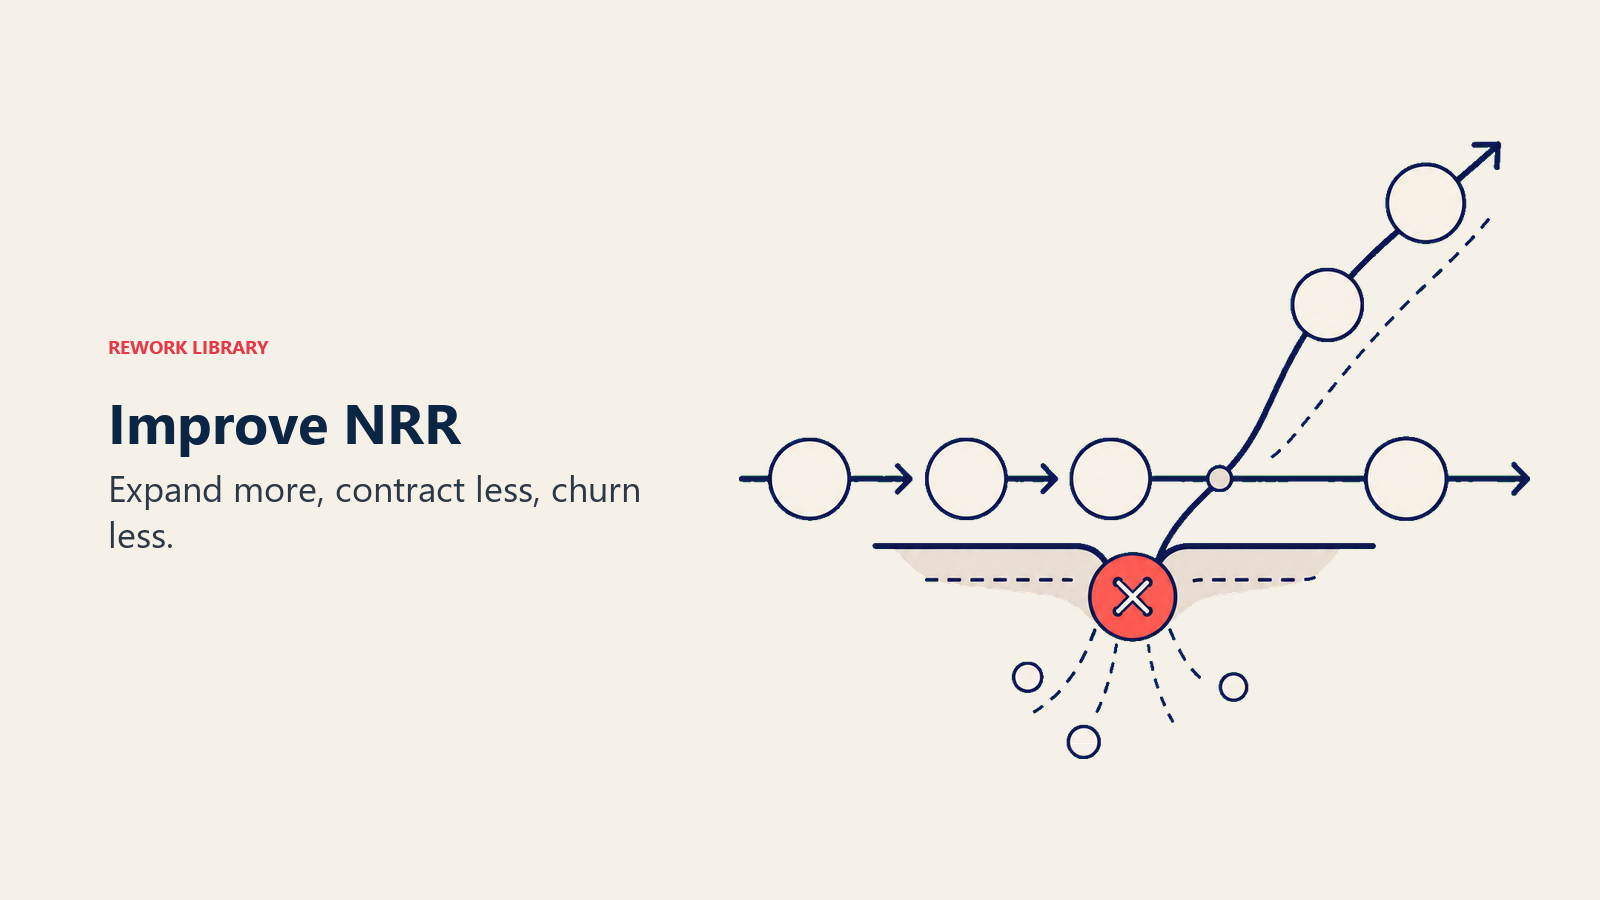
How to improve net revenue retention
NRR moves through four levers: increase expansion, reduce contraction, reduce churn, or some combination. Here's how to work each one.
Step 1: Build a structured expansion motion
Expansion doesn't happen by accident. The companies with 120%+ NRR treat upsell and cross-sell as a formal motion with dedicated owners, triggers, and quotas (see sales quota for how to think about setting expansion targets).
Start by mapping your product's natural expansion paths. Do customers add seats as their teams grow? Do they upgrade when they hit a usage threshold? Do they buy adjacent modules? Map those paths, then assign a customer success or account management owner to each trigger. Automate alerts when a customer is approaching a limit or showing high engagement with a premium feature.
Step 2: Fix churn before it registers
Churn is a lagging indicator. By the time a customer cancels, the real problem happened weeks or months earlier. Build leading indicators: track feature adoption, login frequency, support ticket sentiment, and health scores. Companies with strong revenue predictability typically have churn detection running 60-90 days ahead of renewal dates.
Step 3: Segment by churn risk and expansion potential
Not all customers deserve the same attention. Build a 2x2: high health score + large contract = priority for expansion outreach. Low health score + large contract = immediate intervention. Low health + small contract = automated re-engagement sequence. High health + small contract = upgrade campaign.
Step 4: Tighten the onboarding-to-value window
Churn clusters around two moments: 30-60 days post-signup (customers who never got value) and at first renewal (customers who got some value but not enough to justify the cost). A faster time-to-value shortens the first churn window. Make sure your onboarding drives customers to the one or two features that correlate with long-term retention.
Step 5: Price for expansion
If your pricing model charges a flat annual fee with no usage component, you've removed the natural mechanism for expansion. Usage-based pricing, seat-based pricing, and tiered feature gating all create expansion surface area. Audit your pricing model for whether it rewards customers who get more value, or caps them.
Step 6: Run monthly NRR reviews with the full revenue team
NRR is a cross-functional number. Sales, customer success, product, and finance all affect it. Run a monthly review where you break down expansion, contraction, and churn by segment, cohort, and product line. When everyone sees the same number and owns a slice of it, behavior shifts.
Common mistakes
Mixing new logos into the calculation. NRR is for existing customers only. New ARR belongs in a separate line. Blending the two inflates the number and masks underlying retention problems.
Measuring NRR on too short a window. A single month of NRR can be skewed by one large renewal or one large churn event. Use a trailing 12-month average to see the real trend.
Ignoring GRR alongside NRR. A company can paper over bad churn with aggressive upselling for a while. But that's not sustainable. Always report GRR and NRR together.
Treating 100% as the target. Some teams celebrate hitting 100% NRR. But 100% just means you're flat. Unless you're managing a highly mature, stable enterprise book of business, 100% should be the floor, not the ceiling.
Not cohort-segmenting the data. Aggregate NRR hides a lot. The NRR for your enterprise segment might be 130% while your SMB segment is at 85%. Without segmentation, you don't know where to focus.
Setting quotas without tying them to NRR. If your account managers are only measured on new ARR, they'll deprioritize expansion and ignore churn signals. Tie compensation to net revenue retained, not just new bookings.
Best practices
The companies that sustain high NRR over multiple years tend to share a few habits.

They define NRR consistently across teams. Finance, sales ops, and customer success use the same formula, the same cohort definitions, and the same data source. When teams use different definitions, the number becomes political rather than operational.
They report NRR by cohort vintage. A 2023 cohort's NRR looks different from a 2024 cohort's. Tracking by vintage reveals whether recent customers are retaining at the same rate as older ones, which is a leading indicator of future NRR.
They link product roadmap decisions to NRR drivers. When a product team understands which features correlate with expansion and which correlate with churn, prioritization becomes cleaner. Features that drive adoption in high-NRR customer segments move to the top.
They use NRR as a hiring signal. Headcount in customer success is often justified by NRR lift. If you can show that a CSM managing a given book of business improves NRR by 8 points, the unit economics of that hire are clear.
They share NRR publicly with their board. Not just total ARR growth, but the components: expansion rate, churn rate, contraction rate, and the resulting NRR. Boards that see this breakdown ask better questions and provide better guidance.

Senior Operations & Growth Strategist
On this page
- What is net revenue retention (NRR)?
- Net revenue retention formula
- Worked example
- NRR vs GRR (gross revenue retention)
- NRR benchmarks
- How to improve net revenue retention
- Step 1: Build a structured expansion motion
- Step 2: Fix churn before it registers
- Step 3: Segment by churn risk and expansion potential
- Step 4: Tighten the onboarding-to-value window
- Step 5: Price for expansion
- Step 6: Run monthly NRR reviews with the full revenue team
- Common mistakes
- Best practices