Pipeline Bottleneck Analysis: Identifying and Resolving Flow Constraints
Turn this article into takeaways for your work.
Each assistant summarizes the article only for you and suggests best practices for your work.
You're reviewing your pipeline dashboard and something looks off. Twenty deals stacked up in the proposal stage. Fifteen more stuck waiting for technical validation. Your forecast says you'll hit quota, but none of these deals are moving.
This isn't a forecasting problem. It's a bottleneck problem.
Pipeline bottlenecks are where deals go to die slowly. They're the stages where opportunities pile up, conversion rates plummet, and what should take days stretches into weeks. And here's what makes them dangerous: they're often invisible until they've already cost you the quarter.
If you're running sales operations or leading a revenue team, you need systematic bottleneck analysis. Not quarterly reviews where someone notices deals aren't moving. Daily operational visibility that identifies constraints before they cascade into missed numbers. Understanding what is sales pipeline at a fundamental level helps you recognize when flow is constrained.
What are Pipeline Bottlenecks?
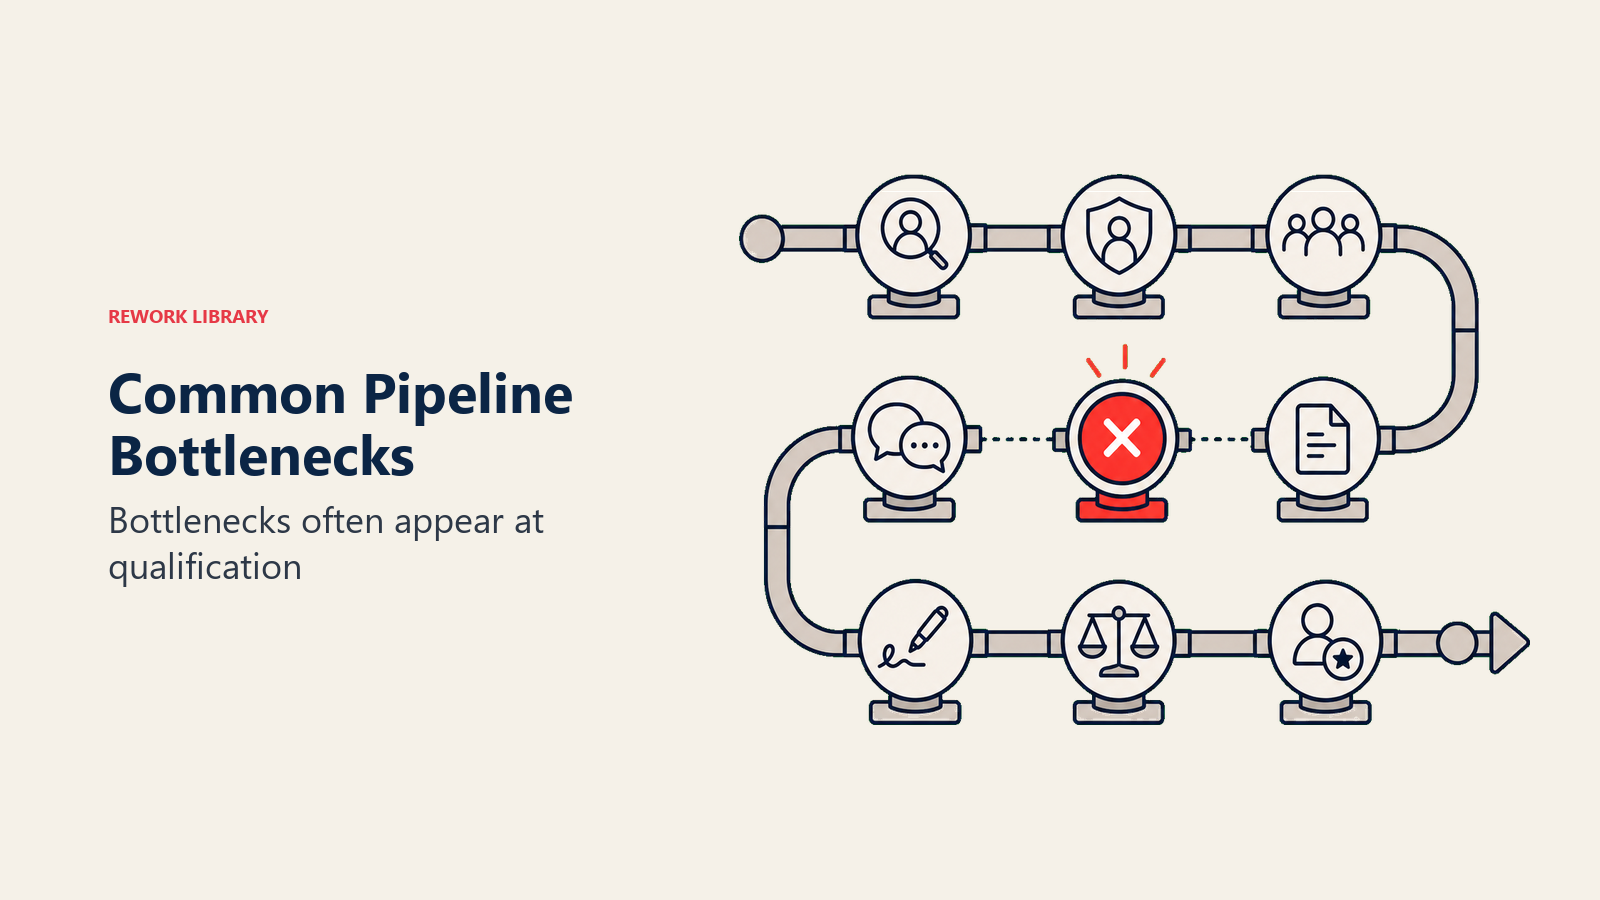
A pipeline bottleneck is any point in your sales cycle where deals slow down or pile up. Simple as that.
Think about a factory assembly line. Raw materials go in one end, finished products come out the other. If one workstation can only process 10 units per hour while every other station handles 50, that slow point becomes the bottleneck. The whole production line moves only as fast as the slowest station.
Your sales pipeline works the same way. Deals enter at the top, move through qualification, discovery, proposal, negotiation, and close. When one stage lacks capacity, has unclear processes, or hits organizational barriers, deals start piling up there. Your overall conversion rate drops, and suddenly everyone's wondering why nothing's moving. Proper pipeline stages design can help prevent many structural bottlenecks from forming in the first place.
The Three Bottleneck Characteristics
Real bottlenecks share three traits:
Accumulation: Deals pile up compared to other stages. If most of your stages hold 8-12 opportunities but one consistently holds 25-30, you've found your constraint.
Extended duration: Deals spend way longer in this stage than planned. Your typical discovery takes 12 days, but deals in proposal average 31 days. That's not variance. That's a bottleneck.
Conversion drop: Fewer deals make it to the next stage. If 65% of qualified opportunities normally reach proposal, but only 38% of proposals reach negotiation, your bottleneck is in the proposal stage.
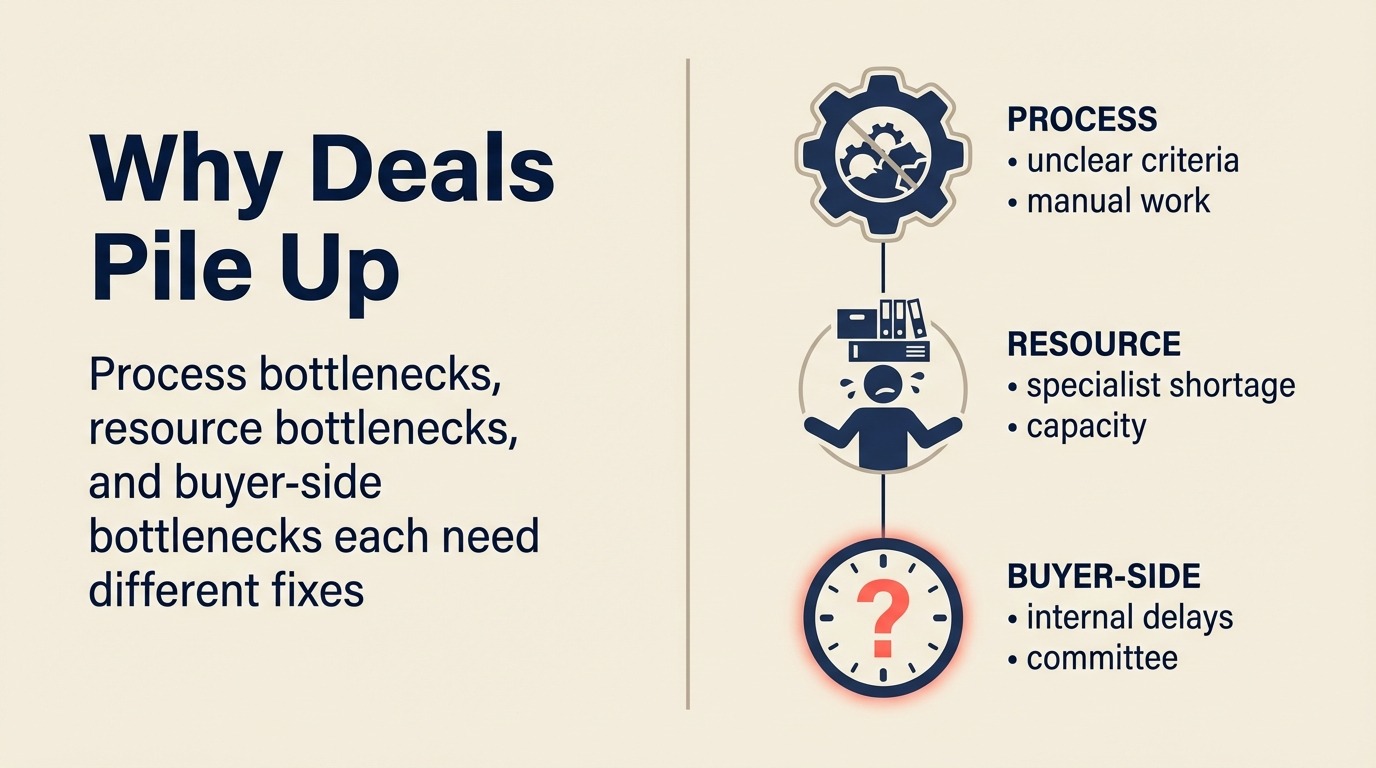
Why Deals Pile Up: The Root Causes
Deals pile up when stage criteria, buyer commitment, rep behavior, or approval steps stop movement without making risk visible.
Bottlenecks don't appear randomly. They form when demand (incoming deals) exceeds capacity (ability to process those deals) at a specific stage. Understanding the root cause determines your resolution strategy.
Process Bottlenecks
These occur when the work itself is inefficient or undefined. Common patterns:
Unclear stage exit criteria mean reps don't know when a deal is ready to advance, so opportunities sit while reps gather "just one more thing." You see deals lingering 2-3x longer than necessary because nobody's sure what "done" looks like. Implementing clear stage gate criteria eliminates this ambiguity.
Manual, repetitive work creates processing delays. If every proposal requires 6 hours of custom formatting, copy-pasting pricing tables, and manual approval routing, your proposal stage becomes a constraint regardless of how many people you throw at it.
Approval complexity turns simple decisions into multi-week odysseys. Three-layer approval chains where each approver takes 3-5 days means your negotiation stage has a built-in 9-15 day delay.
Resource Bottlenecks
These happen when you don't have enough people, tools, or attention to handle the volume of deals entering a stage.
Specialist constraints are the most common. You have 8 sales reps closing deals but only 2 solutions engineers doing technical validation. Every deal needs SE time, so technical validation becomes your constraint point.
Leadership capacity creates executive-level bottlenecks. Deals over $100K require VP approval, but your VP can only review 2-3 deals per week. You now have a hard capacity limit on large deals.
Tool limitations manifest as system bottlenecks. Your contract generation system can only process one document at a time, creating a queue during high-volume periods.
Skill Bottlenecks
These emerge when the people doing the work lack the capability to do it efficiently.
Discovery skill gaps show up as extended qualification stages where reps spend 4-5 calls trying to understand what a competent discovery would capture in one meeting. Strong opportunity qualification skills prevent these delays.
Negotiation inexperience creates proposal stage bottlenecks where reps get stuck on objections, pricing questions, or competitive positioning they don't know how to handle.
Technical knowledge deficits manifest when reps can't confidently answer product questions, requiring constant hand-offs to technical teams for answers that should be table stakes.
Buyer-Side Bottlenecks
Sometimes the constraint isn't internal, it's on the customer side.
Multi-stakeholder decisions naturally slow deals as buyers work through internal consensus-building. Your deal stalls in negotiation because the champion needs to convince finance, IT, operations, and legal.
Budget cycle timing creates seasonal bottlenecks. Deals entering your pipeline in November suddenly hit a wall because customers won't make purchase decisions until the next fiscal year starts in January.
Implementation readiness blocks closes when buyers need to complete infrastructure work, get internal approvals, or allocate resources before they can onboard your solution.
Organizational Bottlenecks
These are structural issues in how your company operates.
Cross-functional dependencies create delays when sales needs marketing to create custom content, legal to review contracts, finance to approve non-standard terms, or product to confirm feature availability.
Siloed communication slows deals when critical information lives in different systems, channels, or people's heads. Your AE doesn't know the SE already identified a technical blocker, so deals sit while parallel work streams unknowingly conflict.
Misaligned incentives create subtle bottlenecks. If your deal desk is measured on risk reduction, they'll slow every non-standard deal for additional review, even when speed matters more than marginal risk mitigation.
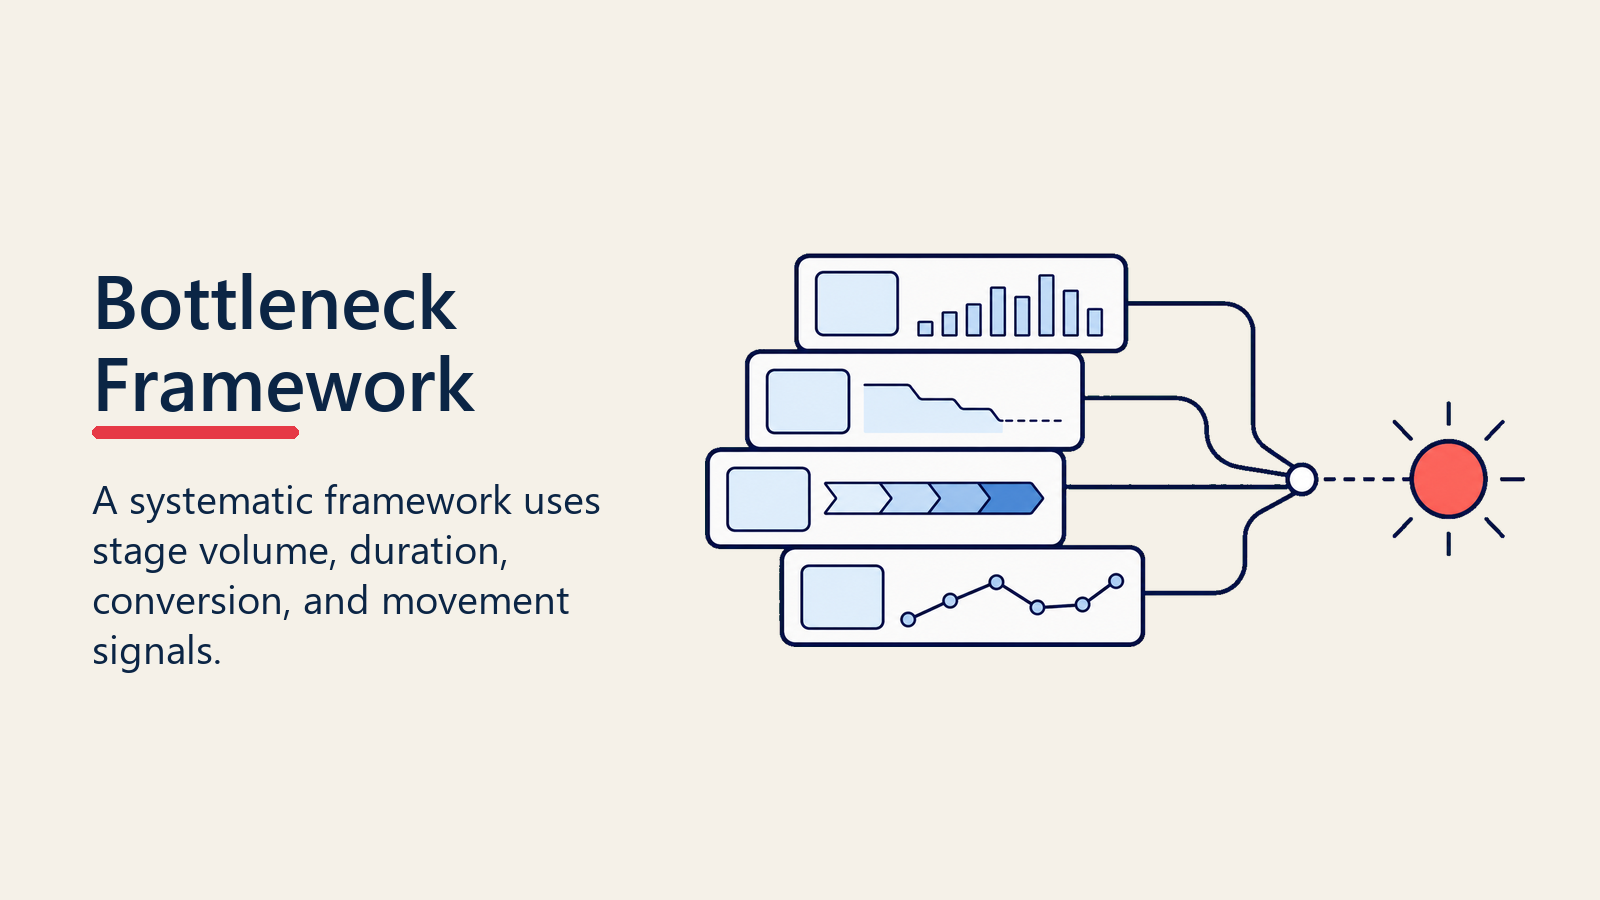
Identifying Bottlenecks: A Systematic Framework
Finding bottlenecks requires actual analysis, not gut feel. Sales leaders often think they know where deals are stuck based on war stories and recent memory. The data usually tells a different story. Regular pipeline reviews provide the structured forum to surface these issues.
Stage Concentration Analysis
Calculate the percentage of total pipeline value and count in each stage. Healthy pipelines show relatively balanced distribution with a natural taper as deals progress and some drop out.
How to calculate: For each stage, divide the number of deals by your total pipeline count, and divide stage value by total pipeline value. If Discovery holds 18% of deals and 22% of value, that's normal. If Proposal holds 38% of deals and 41% of value, you've found your bottleneck.
What to look for: Any stage holding more than 30% of your pipeline count warrants investigation. Any stage where the percentage has grown more than 10 points month-over-month signals an emerging constraint.
Stage Duration Analysis
Track how long deals actually spend in each stage versus your planned stage duration.
How to calculate: For closed-won deals in the last 90 days, calculate median days in each stage. Compare to your target cycle time for that stage. If your qualification target is 10 days but actual median is 19 days, qualification is your bottleneck.
What to look for: Stages where actual duration exceeds planned duration by more than 50% indicate systematic issues, not normal variance. Look at both median (typical case) and 75th percentile (slower deals) to understand the distribution.
Conversion Rate Analysis
Measure the percentage of deals successfully advancing from each stage to the next.
How to calculate: For deals that entered Stage A in the last quarter, what percentage progressed to Stage B? If 100 deals entered Discovery and 68 reached Proposal, your Discovery-to-Proposal conversion is 68%.
What to look for: Significant drops compared to your baseline conversion rates. If most stages convert at 60-70% but one stage converts at 38%, that's your bottleneck. Also watch for declining conversion trends over time, a stage that converted 65% last quarter but only 51% this quarter is becoming a constraint.
Deal Accumulation Patterns
Track how long deals have been sitting in each stage right now.
How to calculate: For all open opportunities, categorize by how long they've been in their current stage: 0-14 days, 15-30 days, 31-60 days, 60+ days. A healthy stage has most deals in the 0-14 day bucket. A bottleneck has disproportionate deals in the 31+ day buckets. Effective deal aging management helps you track and act on these patterns.
What to look for: Stages where more than 40% of deals have been sitting for longer than your target duration. This indicates active congestion, not just historical slowness.
Common Bottleneck Locations
While every sales process is unique, certain stages predictably become bottlenecks across industries and deal complexities.
Technical Validation Stage
This is where prospects evaluate whether your solution actually works for their specific requirements. Common bottleneck drivers:
POC complexity: Proof-of-concept projects that require extensive setup, custom configuration, or prolonged testing periods create natural bottlenecks. A 6-week technical validation naturally constrains how many deals can move through this stage.
SE capacity: Solutions engineers are typically a scarce resource. When every deal needs 15-20 hours of SE time and you only have 2 SEs supporting 8 reps, technical validation becomes a mathematical constraint.
Environment dependencies: Deals stall waiting for customer environments to be provisioned, access credentials to be granted, or technical stakeholders to make time for validation activities.
Proposal/Pricing Stage
This stage encompasses creating proposals, pricing deals, and presenting options to prospects. Bottleneck drivers:
Customization burden: Every proposal requiring bespoke scope documents, custom pricing models, and unique terms creates processing delays. High-touch proposal work doesn't scale.
Pricing authority: Reps who lack authority to discount or configure pricing must escalate every deal that deviates from list price, creating delays and queue backlogs.
Approvals complexity: Multi-layer approval chains for non-standard terms, discounts over certain thresholds, or deals with specific characteristics add days to every proposal.
Legal/Contract Negotiation
Once a customer agrees to move forward, legal and contractual details must be finalized. Bottleneck drivers:
Redline complexity: Customers with extensive legal requirements submit marked-up contracts that require internal legal review, back-and-forth negotiation, and executive approval before execution.
Legal capacity: Small legal teams supporting high deal volumes create queues. When legal can only review 5 contracts per week but sales closes 12 deals per week, you have a structural bottleneck.
Non-standard terms: Every deal requiring custom terms, unique SLAs, or special provisions slows the legal process compared to standard paper.
Executive Approval
Large deals, strategic accounts, or non-standard arrangements often require executive sign-off. Bottleneck drivers:
Calendar constraints: Executives with limited availability create wait times. If your VP reviews deals once per week and each review takes a week to schedule, you've added 7-14 days to every large deal.
Information gaps: Executives who require extensive context, supporting documentation, or answers to detailed questions before approving deals extend the approval cycle.
Risk aversion: Conservative executive decision-making that requires additional validation, proof points, or risk mitigation slows approval velocity.
Champion Development
In complex B2B sales, you need an internal champion who sells on your behalf. Bottleneck drivers:
Multi-stakeholder complexity: Deals stall in discovery or proposal while your champion works to build consensus among finance, IT, operations, and other stakeholders who each have veto power.
Political dynamics: Internal politics, competing priorities, or organizational resistance slow your champion's ability to drive the deal forward.
Champion capability: Weak champions who lack credibility, political capital, or selling skills can't effectively navigate their organization, causing deals to stall indefinitely.
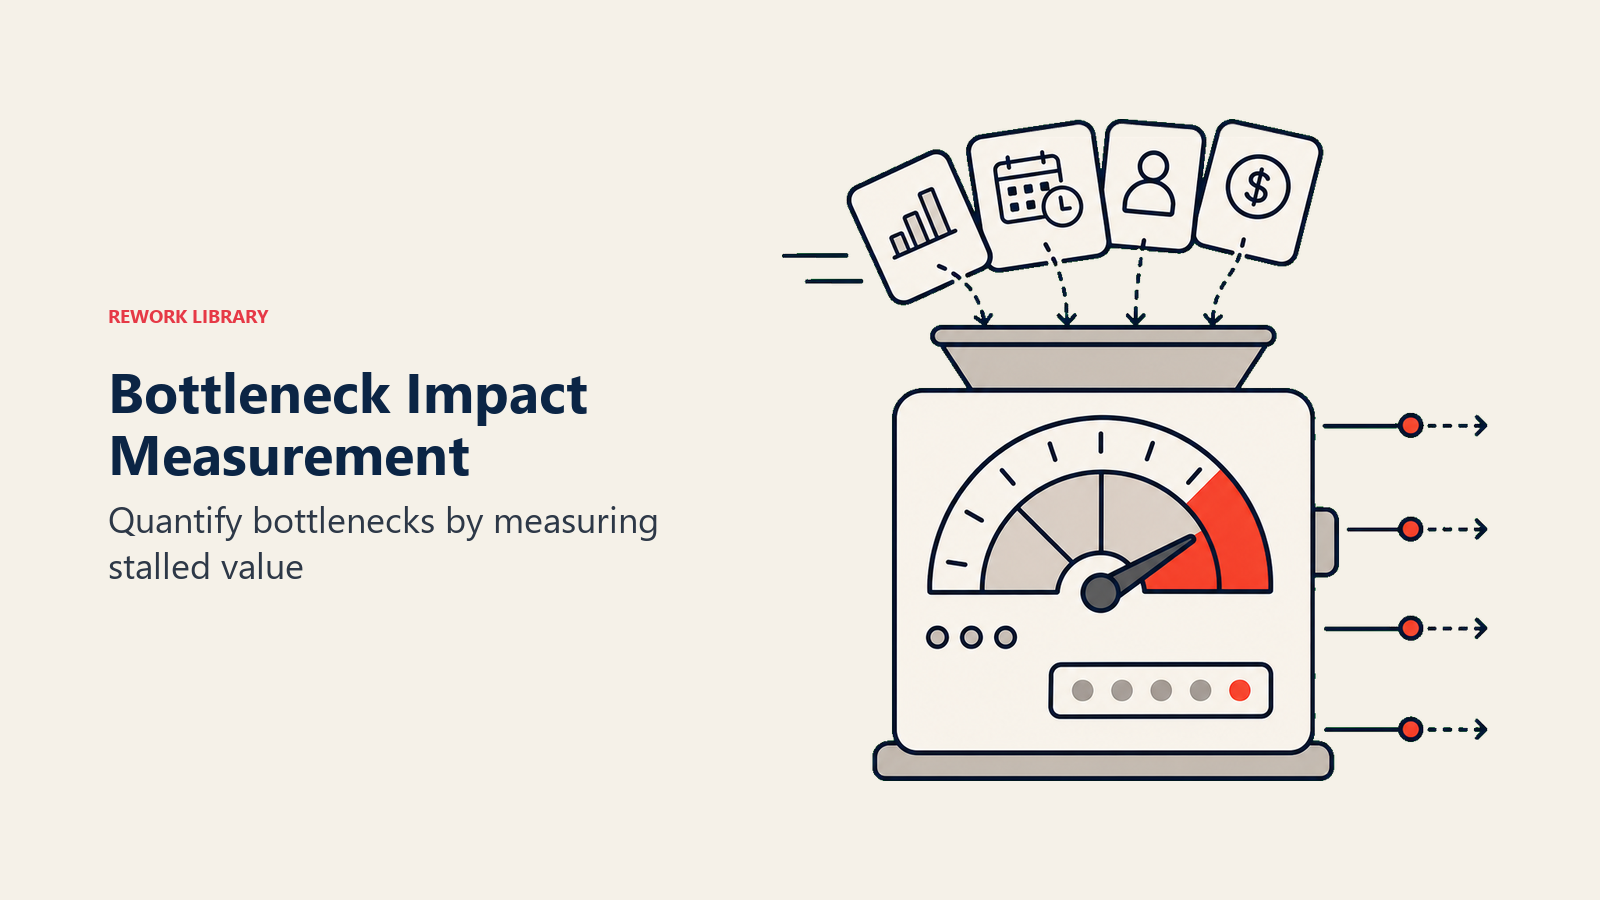
Quantifying Bottleneck Impact
Identifying bottlenecks isn't enough. You need to quantify their impact to prioritize resolution efforts and justify resource investments. This connects directly to your pipeline metrics overview and helps you communicate issues to leadership.
Revenue Delay Calculation
Calculate how much revenue is delayed by a bottleneck.
Formula: (Average deal size) × (Number of deals in bottleneck) × (Excess days beyond target) × (Daily cost of delay)
Example: 25 deals stuck in proposal at $50K average value, spending 32 days vs. 15-day target = 25 deals × $50K × 17 excess days × $0.08 daily cost (assumes 30% annual opportunity cost) = $170K in delayed revenue.
Capacity Utilization
Measure how much constraint a bottleneck creates on your overall pipeline capacity.
Formula: (Current bottleneck throughput per period) ÷ (Required throughput to meet targets)
Example: Your SE team validates 16 deals per month, but hitting quota requires 28 validated deals per month. Your capacity utilization is 16 ÷ 28 = 57%. You're operating at 43% below required capacity.
Conversion Loss
Calculate how many deals you're losing because of bottleneck-induced delays.
Formula: (Deals entering bottleneck stage) × (Current conversion rate - Baseline conversion rate)
Example: 100 deals enter proposal stage monthly. Current conversion to negotiation is 42%, but your baseline is 64%. You're losing 22 deals per month (100 × 0.22) due to proposal stage issues. At $50K average deal size and 35% close rate, that's $385K in lost monthly pipeline.
Resolution Strategies by Root Cause
Resolution should match the root cause, because coaching, process redesign, and qualification changes solve different bottlenecks.
Different bottleneck types require different solutions. Process problems need process fixes. Resource constraints need capacity investments. Skill gaps need enablement.
Process Optimization Solutions
Define clear stage exit criteria: Document exactly what must be true for a deal to advance. Use checklists that reps complete before progressing opportunities. Remove ambiguity about what "done" looks like.
Automate repetitive work: Build proposal templates, automate pricing calculations, create self-service approval workflows. Turn manual multi-hour work into automated 15-minute processes.
Simplify approvals: Raise rep discount authority from 10% to 20%. Give managers final approval on deals under $100K instead of requiring VPs. Remove approval layers that add delay without proportionate risk reduction.
Parallel processing: Re-sequence activities so work happens concurrently instead of serially. Start legal review while pricing is being finalized rather than waiting for full proposal completion.
Resource Allocation Solutions
Add specialist capacity: Hire additional solutions engineers, bring in contract support, expand deal desk headcount. Direct capacity increases are often the fastest path to resolving resource bottlenecks.
Redistribute work: Balance workload more evenly by reassigning accounts, creating specialist teams, or implementing load-balancing routing rules that prevent concentration with specific individuals.
Create leverage: Build tiered support models where junior resources handle standard cases and specialists focus on complex situations. A solutions consultant can handle simple technical questions, reserving SEs for detailed architectural reviews.
Outsource overflow: Engage contract resources, external consultants, or temporary support during peak periods to prevent backlogs during seasonal spikes.
Training and Enablement Solutions
Skill-specific training: Provide targeted training on negotiation techniques, discovery frameworks, technical product knowledge, or objection handling based on the identified skill gaps.
Sales playbooks: Document proven approaches for handling common scenarios. Turn tribal knowledge into repeatable processes that newer reps can execute confidently.
Coaching programs: Pair weaker performers with top performers for deal reviews, call shadowing, and real-time coaching on live opportunities. Structured pipeline coaching accelerates skill development and reduces bottlenecks caused by inexperience.
Certification requirements: Establish minimum competency standards before reps can progress deals through certain stages. A rep must demonstrate technical proficiency before running POCs unsupervised.
Buyer Education Solutions
Stakeholder mapping: Help buyers identify all decision-makers early, build consensus-building plans, and proactively address concerns from finance, legal, IT, and operations.
Business case development: Provide templates, ROI calculators, and supporting materials that champions can use to sell internally. Make it easier for buyers to justify the purchase to their stakeholders.
Executive alignment: Engage your executives with their executives to remove organizational barriers, address strategic concerns, and accelerate internal approvals.
Implementation planning: Co-create implementation roadmaps that address buyer concerns about readiness, resource requirements, and change management, removing "we're not ready" objections.
Executive Escalation and Organizational Change
Dedicated deal review time: Block executive calendars for weekly deal reviews with published SLAs. "VP reviews all deals over $100K within 48 hours" eliminates scheduling delays.
Delegated authority: Empower managers to approve deals below certain thresholds, reserving executive review for strategic accounts or unusually risky situations.
Cross-functional SLAs: Establish service level agreements with legal (contracts reviewed in 3 business days), finance (pricing approvals in 24 hours), and other functions that create dependencies.
Process ownership: Assign clear owners for end-to-end deal flow who have authority to break logjams, escalate issues, and coordinate across departments.
Prevention: Designing Bottleneck-Resistant Pipelines
The best bottleneck strategy is preventing them from forming in the first place. Understanding the relationship between pipeline vs forecast helps you design systems that support both flow and predictability.
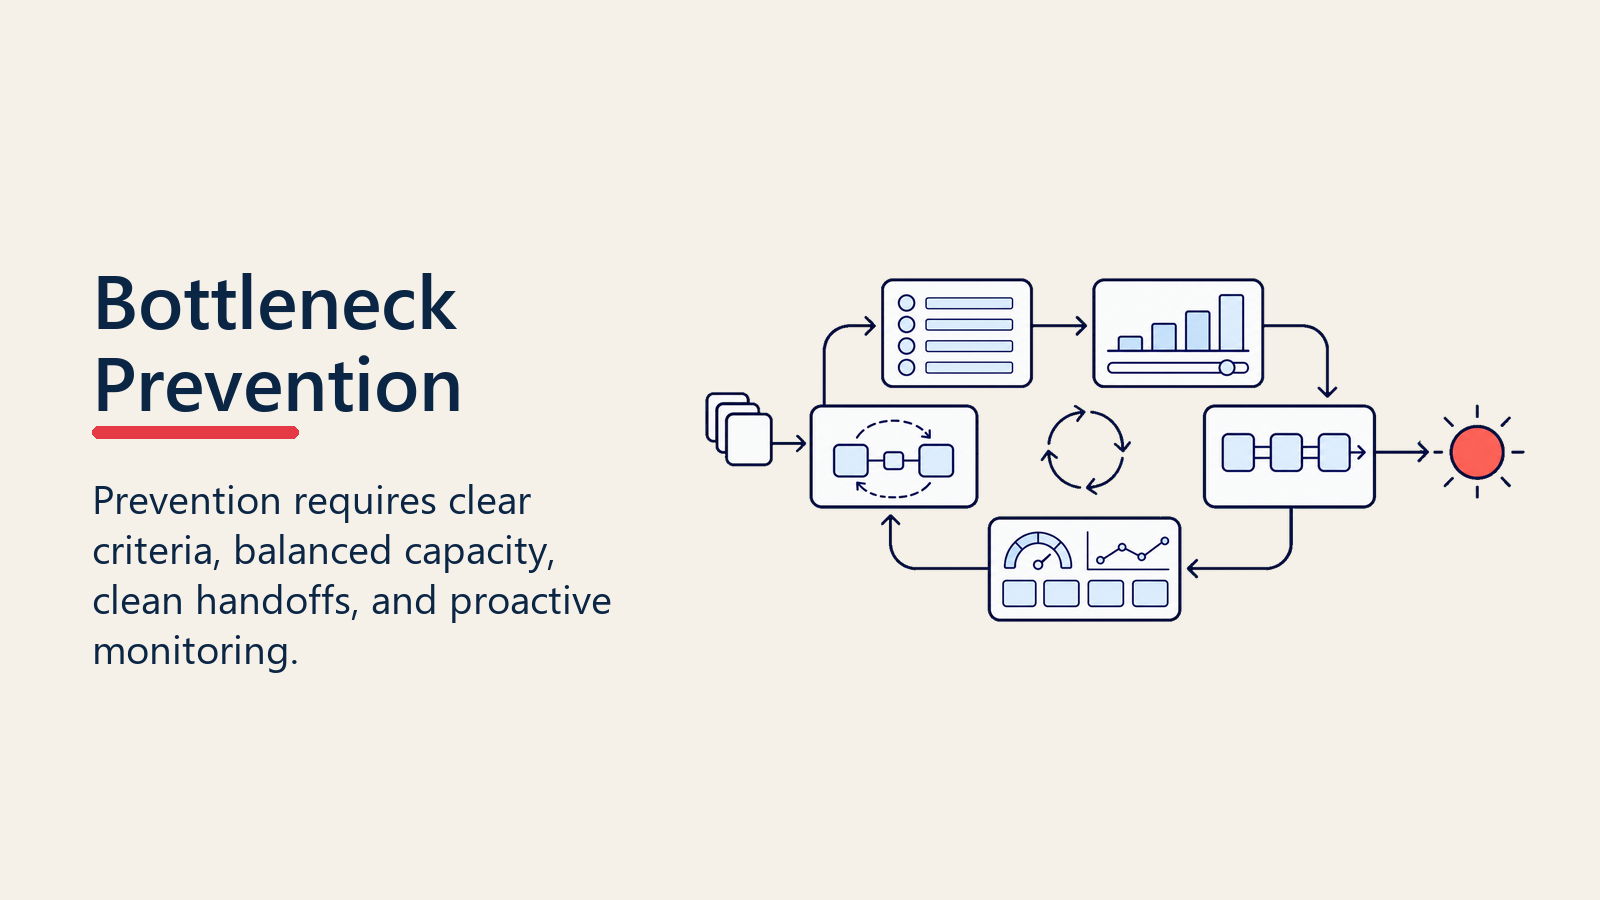
Stage Design Principles
Balanced capacity: Design stages with relatively equivalent processing capacity. Don't create a qualification process that can handle 100 deals per month feeding into a discovery process that can only handle 40.
Clear ownership: Every stage has an identified owner responsible for deals progressing on time. Ambiguous ownership creates accountability gaps where deals stall.
Limited work-in-progress: Set maximum capacity for each stage. When proposal hits 25 active deals, no new deals enter until some exit. This prevents unlimited accumulation.
Explicit handoffs: Define exactly what happens when deals move between stages, who's responsible for what, and what information must transfer. Poor handoffs create mini-bottlenecks at every transition.
Capacity Planning
Calculate stage capacity: Understand the maximum throughput each stage can handle based on available resources and typical processing time.
Forecast demand: Project how many deals will enter each stage based on historical patterns, upcoming campaigns, and seasonal factors.
Identify capacity gaps early: When forecasted demand exceeds stage capacity by more than 20%, you have 60-90 days to add resources, optimize processes, or adjust expectations before bottlenecks form. Strong pipeline coverage analysis helps you anticipate these capacity needs.
Build capacity buffers: Maintain 15-20% excess capacity in critical stages to absorb unexpected volume spikes without creating backlogs.
Early Intervention Systems
Stage duration alerts: Automatically flag deals that have been in a stage for longer than the 75th percentile. These are early indicators of stalling before they become bottlenecks.
Accumulation warnings: Generate alerts when any stage exceeds its planned capacity threshold (e.g. "Proposal stage has 23 active deals, target maximum is 18").
Conversion rate monitoring: Track weekly conversion rates between stages. A 15% drop from baseline signals emerging issues before they compound into full bottlenecks.
Manager dashboards: Give frontline managers real-time visibility into deals at risk of stalling, enabling proactive intervention instead of reactive rescue efforts.
Monitoring: Ongoing Bottleneck Detection
Bottleneck analysis isn't a one-time exercise. Markets change, processes evolve, teams grow, and new constraints emerge. Continuous monitoring catches bottlenecks early. Good pipeline hygiene practices support this ongoing monitoring.
Key Metrics to Track
Stage concentration percentage: What percentage of total pipeline sits in each stage? Track weekly. Any stage consistently above 25% deserves investigation.
Median stage duration: How long deals typically spend in each stage. Track monthly. Look for stages where median duration is increasing over time.
Stage-to-stage conversion rates: What percentage of deals progress from each stage to the next? Track monthly. Declining conversion rates signal emerging problems.
Deals over age threshold: How many deals in each stage have been there longer than your target duration? Track weekly. Rising counts indicate growing bottlenecks.
Dashboard Configuration
Build a pipeline health dashboard that shows:
- Stage distribution (bar chart showing deal count and value per stage)
- Stage duration trends (line chart showing median days in stage over time)
- Conversion funnel (waterfall chart showing drop-off between stages)
- Aging deals (heat map showing deal count by stage and age bucket)
- Bottleneck alerts (automatic highlights when metrics exceed thresholds)
Update frequency: Dashboard should refresh daily with live data, not monthly snapshots that hide emerging issues.
Access: Visible to sales reps (see their own deals), managers (see team performance), and leadership (see organizational trends).
Recommended Review Cadence
Daily: Sales managers review aged deals and stage concentration in their teams. Identify deals at risk of stalling and intervene proactively.
Weekly: Operations reviews pipeline health metrics across all teams. Identify emerging bottlenecks and alert affected managers.
Monthly: Leadership reviews bottleneck trends, conversion rate changes, and capacity utilization. Make resourcing and process decisions based on data.
Quarterly: Comprehensive bottleneck audit assessing all stages, updating baseline metrics, and recalibrating thresholds based on business growth.
Case Studies: Common Bottlenecks and Solutions
Case Study 1: The Technical Validation Constraint
Situation: SaaS company with 12 enterprise AEs but only 3 solutions engineers. Technical validation becoming a bottleneck as deal volume increased.
Analysis: Stage concentration analysis showed 34% of pipeline stuck in technical validation, up from 18% six months prior. Average validation duration was 23 days vs. 12-day target. SE utilization analysis showed 98% capacity, mathematically maxed out.
Solution: Three-part approach:
- Created junior solutions consultant role to handle simpler technical questions
- Built self-service demo environment reducing SE involvement in early validation
- Hired two additional senior SEs, increasing capacity by 67%
Result: Technical validation concentration dropped to 21% within 60 days. Average duration decreased to 14 days. Pipeline velocity improved 31%, contributing to 22% increase in quarterly bookings. Understanding and improving win rate improvement metrics was a direct outcome of this initiative.
Case Study 2: The Proposal Generation Bottleneck
Situation: Professional services firm where every proposal required extensive custom scoping, pricing, and formatting. Proposal generation took 12-18 hours per deal.
Analysis: Deals spent median 19 days in proposal stage vs. 8-day target. Stage duration analysis revealed most time wasn't in decision-making, it was in document creation. 78% of proposals shared 60-80% common content despite being "custom."
Solution:
- Built modular proposal library with pre-approved content blocks
- Created pricing calculator that automatically generated pricing tables
- Implemented proposal automation tool reducing generation time from 12 hours to 2 hours
Result: Proposal stage duration dropped to 9 days. Sales capacity increased by 25% as reps spent less time on administrative work. Proposal win rate increased 8% due to faster response times.
Case Study 3: The Executive Approval Bottleneck
Situation: B2B company where all deals over $75K required VP approval. VP reviewed deals once per week, creating 5-10 day delays.
Analysis: 19 deals stuck awaiting executive approval, representing $1.4M in delayed revenue. Quarter-end forecast at risk. Root cause: volume of deals requiring approval exceeded VP's realistic capacity.
Solution:
- Raised approval threshold from $75K to $150K for standard deals
- Delegated approval authority to directors for deals between $75K-$150K
- Created fast-track approval process for standard terms deals
Result: Executive approval backlog cleared within one week. Deals requiring VP approval dropped from 24 per month to 8 per month. Average approval time decreased from 8 days to 2 days. Quarter closed at 104% of quota.
Conclusion: Bottleneck Analysis as Operational Discipline
Pipeline bottlenecks aren't anomalies. They're inevitable in any complex sales operation. Deals will pile up. Stages will slow down. Conversion rates will drop. The question isn't whether bottlenecks will form, but whether you'll spot and fix them before they crater your quarter.
The difference between sales teams that consistently hit targets and those that struggle? Operational discipline. Teams that win have systematic bottleneck analysis that catches constraints before they compound. Teams that miss rely on anecdotes, gut feel, and quarterly fire drills.
When you treat bottleneck analysis as an ongoing practice, not a quarterly review, you build a predictable revenue engine. You see constraints forming weeks before they hit your forecast. You quantify the impact and prioritize solutions based on actual data. You fix root causes, not symptoms.
Ignore bottlenecks until deals stop closing, and you're accepting unnecessary revenue delays, capacity constraints, and missed quotas as just "how sales works." Wrong. Bottlenecks are solvable when you identify, analyze, and systematically fix them.
The tools and frameworks exist. What's required is commitment to continuous pipeline health monitoring and the willingness to act on what the data tells you.
Ready to optimize your pipeline flow? Learn how pipeline velocity and conversion rate analysis work together to identify constraints before they impact revenue.
Related reading:

Senior Operations & Growth Strategist
On this page
- What are Pipeline Bottlenecks?
- The Three Bottleneck Characteristics
- Why Deals Pile Up: The Root Causes
- Process Bottlenecks
- Resource Bottlenecks
- Skill Bottlenecks
- Buyer-Side Bottlenecks
- Organizational Bottlenecks
- Identifying Bottlenecks: A Systematic Framework
- Stage Concentration Analysis
- Stage Duration Analysis
- Conversion Rate Analysis
- Deal Accumulation Patterns
- Common Bottleneck Locations
- Technical Validation Stage
- Proposal/Pricing Stage
- Legal/Contract Negotiation
- Executive Approval
- Champion Development
- Quantifying Bottleneck Impact
- Revenue Delay Calculation
- Capacity Utilization
- Conversion Loss
- Resolution Strategies by Root Cause
- Process Optimization Solutions
- Resource Allocation Solutions
- Training and Enablement Solutions
- Buyer Education Solutions
- Executive Escalation and Organizational Change
- Prevention: Designing Bottleneck-Resistant Pipelines
- Stage Design Principles
- Capacity Planning
- Early Intervention Systems
- Monitoring: Ongoing Bottleneck Detection
- Key Metrics to Track
- Dashboard Configuration
- Recommended Review Cadence
- Case Studies: Common Bottlenecks and Solutions
- Case Study 1: The Technical Validation Constraint
- Case Study 2: The Proposal Generation Bottleneck
- Case Study 3: The Executive Approval Bottleneck
- Conclusion: Bottleneck Analysis as Operational Discipline