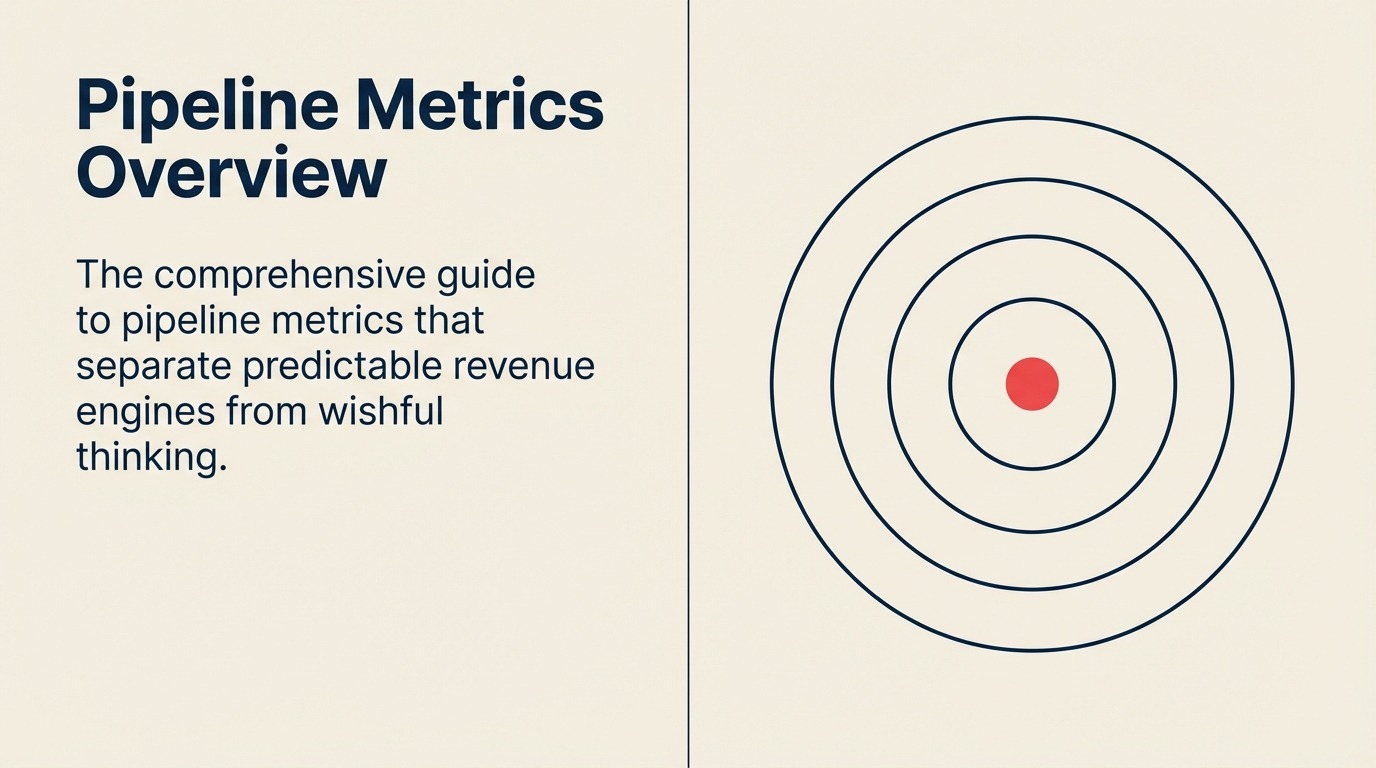
Pipeline Metrics Overview: The Dashboard for Revenue Health
Turn this article into takeaways for your work.
Each assistant summarizes the article only for you and suggests best practices for your work.
Peter Drucker got it right: "What gets measured gets managed."
But here's the uncomfortable truth: most revenue leaders are measuring the wrong things. Or too many things. Or things that tell you what happened three months ago instead of what's coming next quarter.
Pipeline metrics are more than numbers on a dashboard. They reveal whether your revenue engine is firing on all cylinders or quietly breaking down. Companies that consistently hit targets versus those that scramble every quarter? The difference isn't luck. It's measurement discipline.
Building predictable revenue means understanding which metrics actually matter, how to calculate them correctly, and what they tell you about your pipeline health.
What Makes a Pipeline Metric Actually Useful?
Not all metrics are created equal. The best pipeline metrics share three characteristics:
They're actionable. Good metrics tell you what to do differently, not just what happened. "Pipeline created this month is 30% below target" triggers action. "Total opportunities in Salesforce" doesn't.
They're leading indicators. Lagging metrics (closed revenue, win rate) tell you what already happened. Leading metrics (new pipeline creation, early-stage conversion) predict what's about to happen. You need both, but leading indicators give you time to intervene.
They're comparable. Metrics you can segment by rep, region, product, or time period enable meaningful analysis. "Overall win rate is 25%" is interesting. "Win rate dropped from 32% to 18% for deals under $50K in the Northeast" demands investigation.
The Four Categories That Cover Everything
Pipeline metrics are easier to manage when grouped into volume, quality, velocity, and conversion.
Every pipeline metric falls into one of four categories. Master these, and you understand the complete health picture.
Volume Metrics: Quantity and Flow
Volume metrics measure how much pipeline you have and how it's moving through your system. Think of this as checking the water level and flow rate in your revenue reservoir.
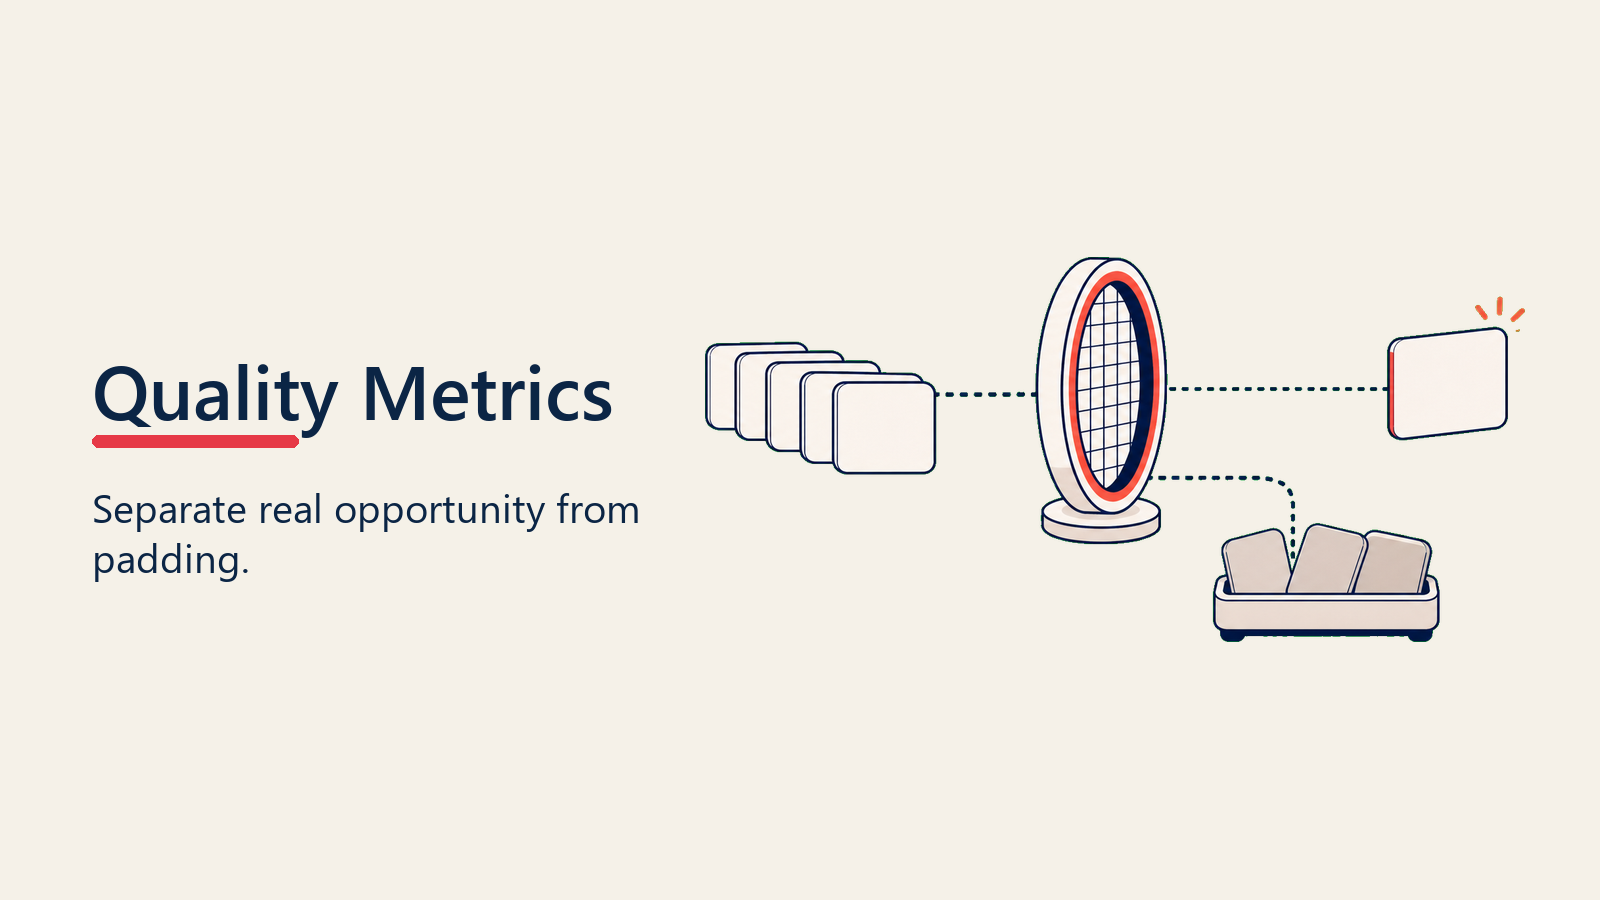
Quality Metrics: Conversion and Win Rates
Quality metrics reveal whether your pipeline is full of real opportunities or false hope. They separate serious buyers from tire-kickers and tell you which types of deals actually close.
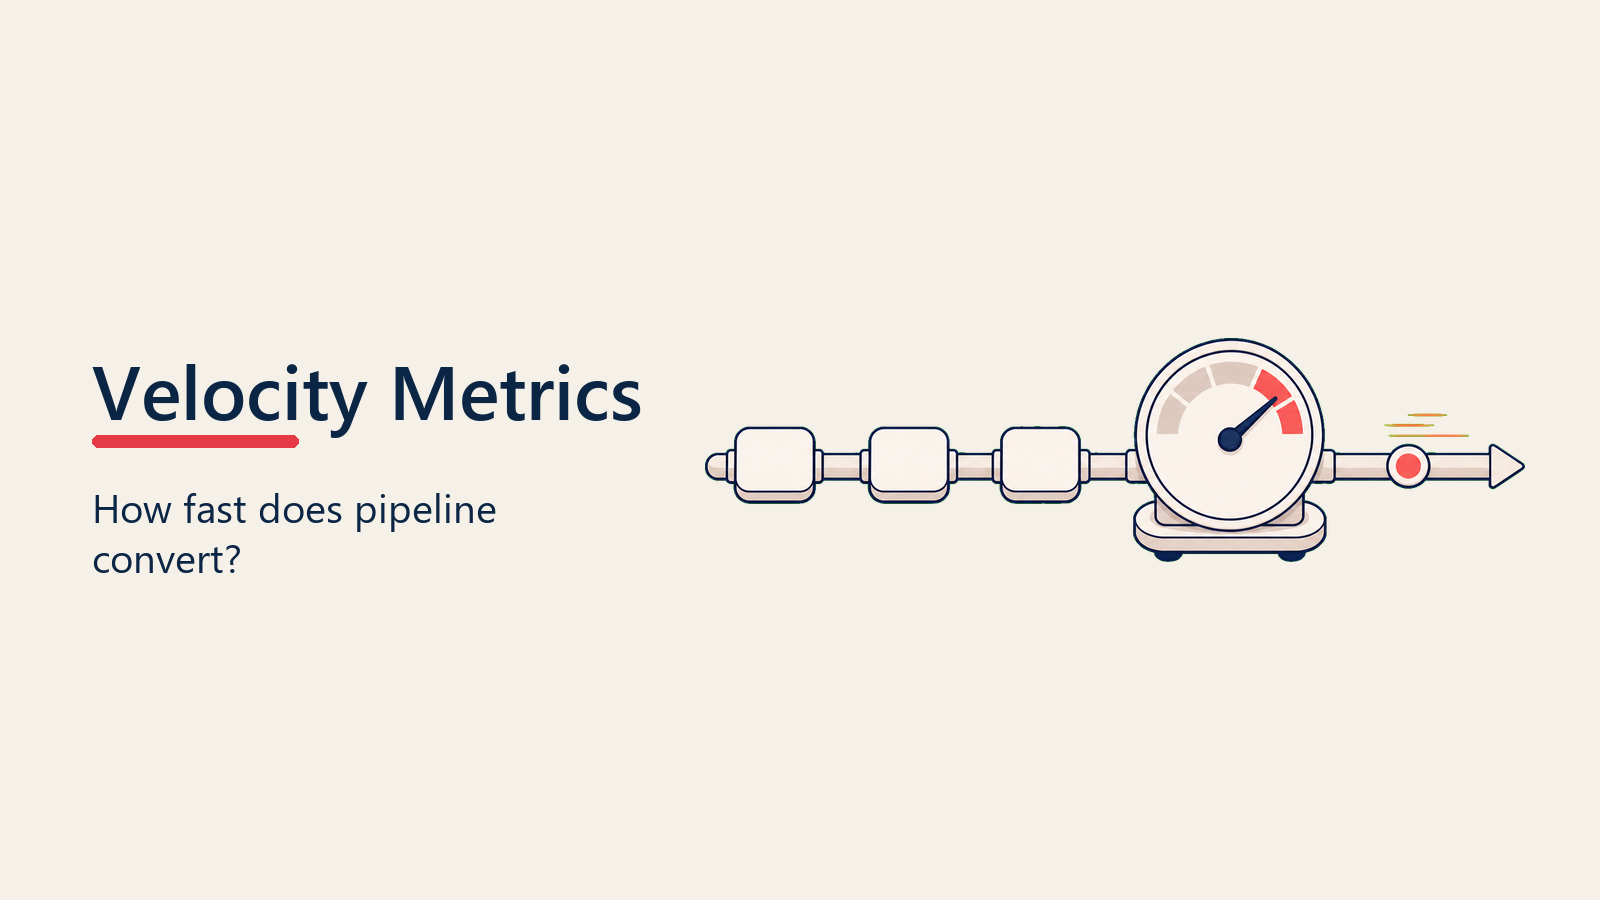
Velocity Metrics: Speed and Efficiency
Velocity metrics track how fast deals move through your pipeline. Faster isn't always better, but understanding your natural pace reveals bottlenecks and forecasting patterns.
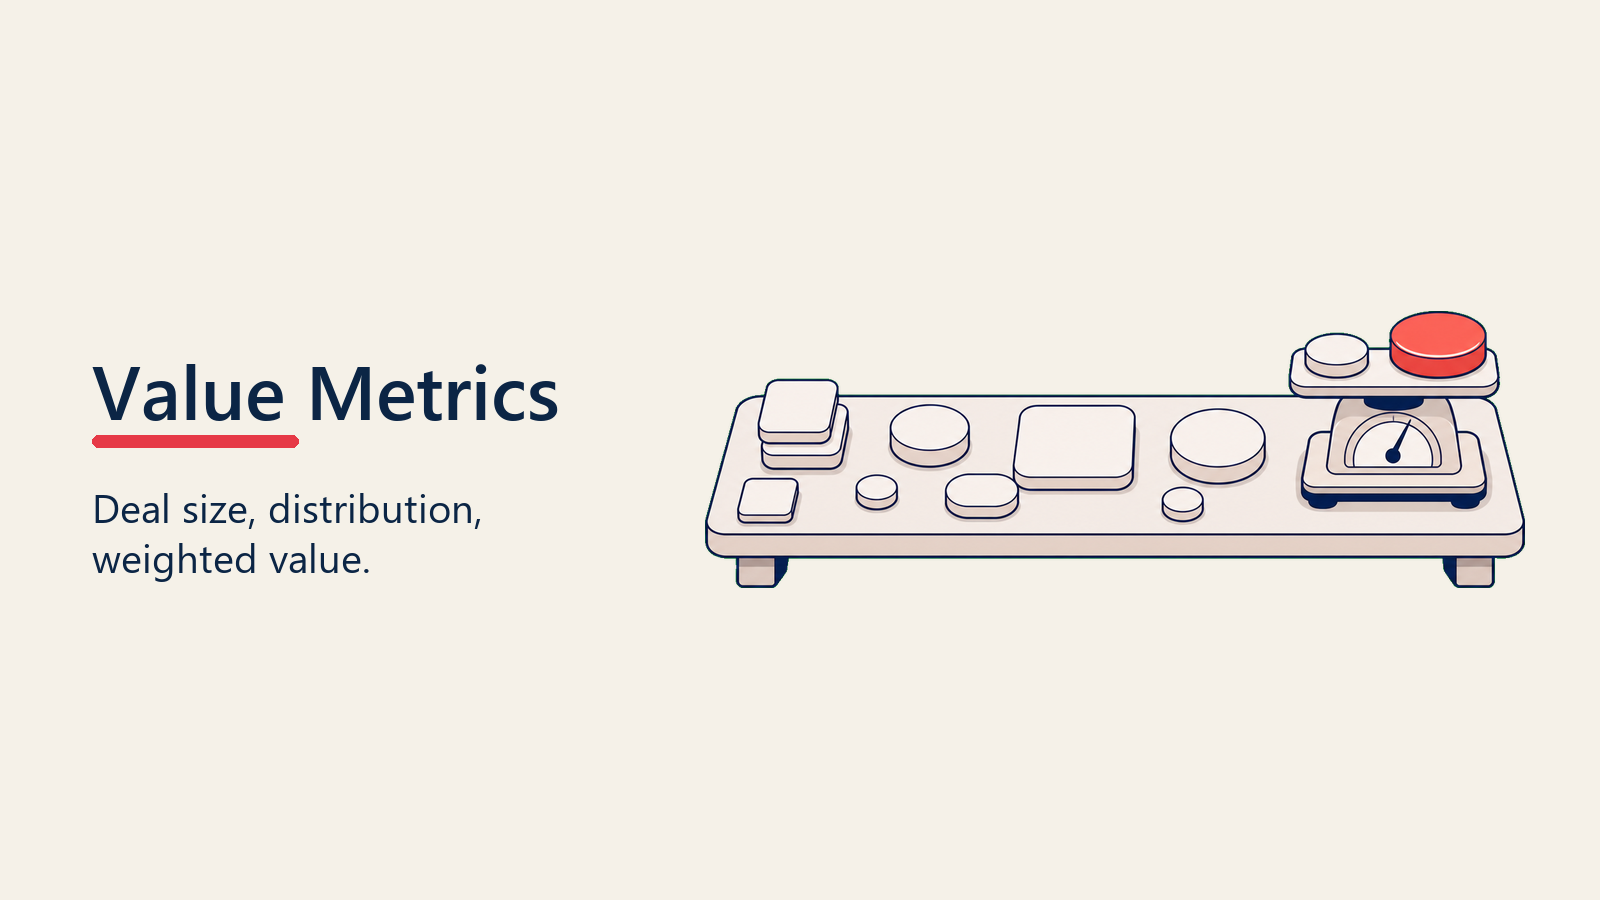
Value Metrics: Size and Revenue Potential
Value metrics measure deal economics: average sizes, distribution patterns, and probability-adjusted revenue expectations. This is where volume meets reality.
Volume Metrics: Understanding Pipeline Quantity
Volume metrics answer the fundamental question: "Do we have enough pipeline?"

Total Pipeline Value
The sum of all open opportunities in your pipeline, regardless of stage or probability.
Why it matters: This is your gross opportunity universe. While not probability-adjusted, it sets your maximum revenue potential for a given period.
Calculation: Sum of all opportunity amounts where Status = Open
Benchmark ranges:
- B2B SaaS: 3-5x quarterly revenue target
- Enterprise software: 4-6x quarterly revenue target
- Transactional sales: 2-3x monthly revenue target
Warning sign: Total pipeline less than 3x your target means you're one bad month away from missing goals.
Pipeline by Stage
Pipeline value broken down by each stage in your sales process.
Why it matters: This distribution reveals whether your pipeline is healthy throughout or concentrated in early/late stages. Unbalanced pipelines create forecasting problems and missed targets.
Ideal distribution (7-stage pipeline):
- Early stages (1-3): 40-50%
- Middle stages (4-5): 30-35%
- Late stages (6-7): 20-25%
Understanding how to design effective pipeline stages helps establish meaningful distribution targets.
Warning signs:
- Over 60% in early stages = conversion problem
- Under 15% in late stages = near-term revenue risk
- Over 40% in late stages = sandbagging or stalled deals
New Pipeline Created (Period Over Period)
The value of new opportunities added to your pipeline in a specific time period.
Why it matters: This is the leading indicator that predicts future revenue. Declining new pipeline creation today means missed targets next quarter.
Calculation: Sum of opportunity amounts where Created Date falls within period
Benchmark ranges:
- Should equal or exceed closed revenue + pipeline decay
- Healthy: 100-125% of quarterly target created each quarter
- High-growth: 150-200% of target
Tracking frequency: Weekly for tactical adjustments, monthly for strategic planning
Pipeline Adds vs Exits
Net change in pipeline value, accounting for new opportunities added and opportunities that exited (won, lost, or disqualified).
Why it matters: Total pipeline can hide problems. Adding $2M but losing $2.5M each month? Your pipeline is shrinking even if the headline number looks stable.
Calculation:
Net Pipeline Change = New Opportunities Created
                      + Won Opportunities
                      - Lost Opportunities
                      - Disqualified Opportunities
Healthy pattern: Positive net change with wins accounting for 20-30% of exits
Warning sign: Negative net change for two consecutive periods signals demand generation issues
Open Opportunities Count
Total number of open opportunities in your pipeline.
Why it matters: Combined with total pipeline value, this reveals average deal size and rep capacity. A rep with 80 open opportunities has a very different workload than one with 15.
Benchmark ranges:
- Enterprise AE: 15-30 active opportunities
- Mid-market AE: 30-50 active opportunities
- SMB AE: 50-100+ active opportunities
Warning signs:
- Too many: Spreading attention thin, lack of prioritization
- Too few: Demand generation problems or overly aggressive qualification
Quality Metrics: Measuring Conversion and Win Rates
Quality metrics separate real opportunities from pipeline padding. They reveal whether your volume metrics are built on solid ground or wishful thinking. Strong opportunity qualification practices directly improve these metrics.
Stage-to-Stage Conversion Rates
The percentage of opportunities that advance from one stage to the next.
Why it matters: Overall win rate is a lagging indicator. Stage-to-stage conversion shows exactly where deals get stuck, revealing specific coaching opportunities and process problems.
Calculation: (Opportunities advancing to next stage ÷ Opportunities entering current stage) × 100
Benchmark ranges (B2B SaaS):
- Discovery → Qualification: 60-70%
- Qualification → Proposal: 50-60%
- Proposal → Negotiation: 60-70%
- Negotiation → Closed-Won: 70-80%
Analysis technique: Track these weekly. A 15% drop in any stage-to-stage conversion is an early warning signal worth investigating immediately.
Overall Win Rate
The percentage of opportunities that close successfully.
Why it matters: Win rate reveals whether your targeting, qualification, and sales execution are working. It's the ultimate quality metric for your entire pipeline.
Calculation: (Closed-Won Opportunities ÷ Total Closed Opportunities) × 100
Benchmark ranges:
- Enterprise B2B: 25-35%
- Mid-market B2B: 30-40%
- Transactional B2B: 40-50%
- High-velocity SaaS: 20-25%
Important: Always measure win rate from qualified opportunities, not raw leads. Including unqualified opportunities artificially deflates the metric. Focus on win rate improvement strategies once you have reliable baseline measurements.
Win Rate by Segment, Rep, and Product
Win rate broken down by meaningful categories.
Why it matters: Overall win rate masks important patterns. You might have 30% overall win rate but 45% in enterprise and 18% in SMB, revealing a targeting problem.
Critical segments to track:
- Company size (employee count, revenue)
- Industry vertical
- Geographic region
- Product/solution type
- Sales representative
- Lead source
- Deal size band
Action triggers:
- 20%+ variance between segments → Targeting or resource allocation issue
- 30%+ variance between reps → Coaching or territory quality issue
- Declining trend in any segment → Market fit or competitive pressure
Loss Analysis and Reasons
Categorized reasons why opportunities close-lost.
Why it matters: "We lost to competition" doesn't help you improve. "Lost to Competitor X on price in deals under $50K" gives you something specific to solve.
Standard loss categories:
- Lost to named competitor
- Lost to status quo (no decision)
- Budget/timing issues
- Product fit/features
- Pricing/value perception
- Champion departure or org change
Benchmark ranges:
- Lost to competition: 30-40%
- Lost to status quo: 25-35%
- Budget/timing: 15-25%
- Product/pricing: 10-15%
Analysis technique: Track loss reasons monthly. If "lost to Competitor X" jumps from 15% to 30% in a quarter, competitive positioning has changed. Conducting systematic lost deal analysis reveals actionable patterns you can address.
Deal Quality Score
A composite score indicating opportunity health based on multiple factors.
Why it matters: Not all pipeline is equal. A $100K deal with engaged stakeholders, competitive evaluation, and near-term timing is completely different from a $100K deal with sporadic contact and vague timeline.
Common scoring factors:
- Stakeholder engagement (frequency, seniority)
- Competitive landscape (incumbent, evaluation status)
- Budget confirmation
- Timeline clarity
- Decision process understanding
- Pain severity
- Champion strength
Benchmark approach: Score 0-100, with 70+ indicating high-quality opportunities. Track the percentage of your pipeline above 70.
Target: 40-60% of late-stage pipeline should score 70+
Velocity Metrics: Tracking Speed and Efficiency
Velocity metrics reveal how efficiently your pipeline converts. Faster isn't always better, but understanding your natural pace enables better forecasting and reveals hidden bottlenecks.
Average Sales Cycle Length
The mean time from opportunity creation to close (won or lost).
Why it matters: Sales cycle length drives cash flow, forecasting accuracy, and rep capacity planning. A 180-day cycle means decisions made today affect revenue six months out.
Calculation: Average of (Close Date - Created Date) for all closed opportunities
Benchmark ranges:
- Enterprise B2B: 6-18 months
- Mid-market B2B: 3-6 months
- SMB B2B: 1-3 months
- High-velocity SaaS: 15-45 days
Analysis tips:
- Segment by deal size (larger deals take longer)
- Track trend over time (lengthening cycles signal problems)
- Compare won vs lost cycle length (faster losses = qualification issue)
Time in Each Stage
Average days opportunities spend in each pipeline stage.
Why it matters: Aggregate sales cycle length hides important patterns. A 120-day average cycle looks fine until you realize deals spend 90 days in one stage. That's your bottleneck.
Calculation: Average of (Stage Exit Date - Stage Entry Date) by stage
Benchmark approach: Establish your baseline, then track variance. A stage that normally takes 14 days suddenly taking 28 days signals a problem.
Warning signs:
- Early stages taking too long = qualification issues
- Late stages dragging = negotiation problems or stalled deals
- Middle stages stuck = value proposition or champion issues
Implementing stage gate criteria helps ensure deals progress through stages efficiently.
Pipeline Velocity
A composite metric combining deal value, win probability, and cycle length.
Why it matters: This single metric captures whether your pipeline is efficiently converting into revenue. Higher velocity means more revenue in less time.
Calculation:
Pipeline Velocity = (Number of Opportunities × Average Deal Value × Win Rate) ÷ Sales Cycle Length (days)
Example:
(100 opportunities × $50,000 × 30% win rate) ÷ 90 days = $16,667 per day
Benchmark approach: Establish baseline, then track monthly. Focus on trend, not absolute value.
Improvement levers:
- Increase number of opportunities (demand gen)
- Increase average deal value (targeting, packaging)
- Increase win rate (qualification, sales execution)
- Decrease cycle length (remove bottlenecks)
Learn more: Pipeline Velocity: The Metric That Combines Volume, Value, and Speed
Deal Acceleration and Deceleration
Opportunities that are moving faster or slower than historical averages for their stage.
Why it matters: Accelerating deals signal strong buyer intent and should get extra attention. Decelerating deals are at risk and need intervention.
Calculation:
- Compare current stage duration to historical average
- Flag deals 20%+ faster (accelerating) or slower (decelerating)
Action triggers:
- Accelerating deals: Prioritize, ensure resources available
- Decelerating deals: Rep check-in, identify blockers
Stagnant Deal Percentage
Opportunities that haven't had meaningful activity or stage movement in a defined period.
Why it matters: Stagnant deals are zombie pipeline. They inflate your total pipeline value but aren't likely to close. This metric forces pipeline hygiene.
Calculation: (Opportunities with no activity or stage change in 30+ days ÷ Total Open Opportunities) × 100
Benchmark: Should be under 20% of total pipeline
Warning sign: Over 30% stagnant deals means your pipeline is padded and your forecast is wrong
Action: Implement monthly pipeline review requiring reps to qualify, progress, or disqualify stagnant deals. Regular deal aging management practices keep your pipeline healthy and accurate.
Value Metrics: Understanding Deal Economics
Value metrics reveal the economic characteristics of your pipeline: deal sizes, distributions, and probability-adjusted revenue expectations.
Average Deal Size
Mean closed-won deal value.
Why it matters: Deal size affects everything: sales cycle, win rate, rep capacity, and revenue predictability. Tracking this reveals drift in targeting or product mix.
Calculation: Total Closed-Won Revenue ÷ Number of Closed-Won Deals
Benchmark approach: Establish baseline by segment (enterprise, mid-market, SMB), then track monthly variance.
Warning signs:
- Declining trend: Downmarket drift or discounting pressure
- Increasing variance: Inconsistent targeting
- Segment compression: Market saturation in sweet spot
Focused deal size optimization efforts can systematically improve this metric.
Deal Size Distribution
Pipeline value broken into deal size bands.
Why it matters: Average deal size masks distribution patterns. A $10M average looks great, but what if half your deals are under $1M and half are over $20M? Those require completely different sales motions.
Standard bands:
- Enterprise: <$50K, $50K-$250K, $250K-$1M, $1M+
- Mid-market: <$10K, $10K-$50K, $50K-$100K, $100K+
- SMB: <$5K, $5K-$25K, $25K-$50K, $50K+
Ideal distribution: 60-70% of deals in your target segment, 20-30% above, 10-20% below
Action trigger: If over 40% of pipeline falls outside target segment, you have a targeting problem
Weighted Pipeline Value
Pipeline value adjusted by win probability at each stage.
Why it matters: Total pipeline treats every deal equally. Weighted pipeline accounts for the reality that early-stage deals are less likely to close than late-stage deals.
Calculation: Sum of (Opportunity Value × Stage Win Probability)
Example:
- Discovery (20% probability): $1M × 0.20 = $200K
- Proposal (50% probability): $500K × 0.50 = $250K
- Negotiation (75% probability): $400K × 0.75 = $300K
- Total Weighted Pipeline: $750K
Benchmark: Weighted pipeline should be 100-125% of quarterly target for confident forecast
Learn more: Weighted Pipeline: Beyond Gross Pipeline Value
Pipeline Coverage Ratio
The ratio of total pipeline value to revenue target.
Why it matters: This single metric answers, "Do we have enough pipeline to hit our number?" It's the first thing revenue leaders check.
Calculation: Total Pipeline Value ÷ Revenue Target
Benchmark ranges:
- Enterprise: 4-6x coverage
- Mid-market: 3-4x coverage
- SMB/transactional: 2-3x coverage
Warning signs:
- Below 3x: Serious pipeline gap, unlikely to hit target
- Above 7x: Padding, poor qualification, or sandbag
Learn more: Pipeline Coverage Analysis: How Much Pipeline Do You Really Need?
Expected Revenue (Probability-Adjusted)
Sum of weighted pipeline value in a specific time period.
Why it matters: This is your statistical forecast, what you should expect to close based on historical conversion patterns.
Calculation: Sum of (Opportunity Value × Win Probability) for opportunities closing in period
Benchmark: Should match 80-90% of your committed forecast
Variance analysis:
- Expected revenue > Forecast = Conservative (or sandbag)
- Expected revenue < Forecast by 10%+ = Aggressive (or pipeline problem)
Leading vs Lagging Indicators: What Predicts vs What Reports
Leading indicators help predict future revenue, while lagging indicators explain what already happened.
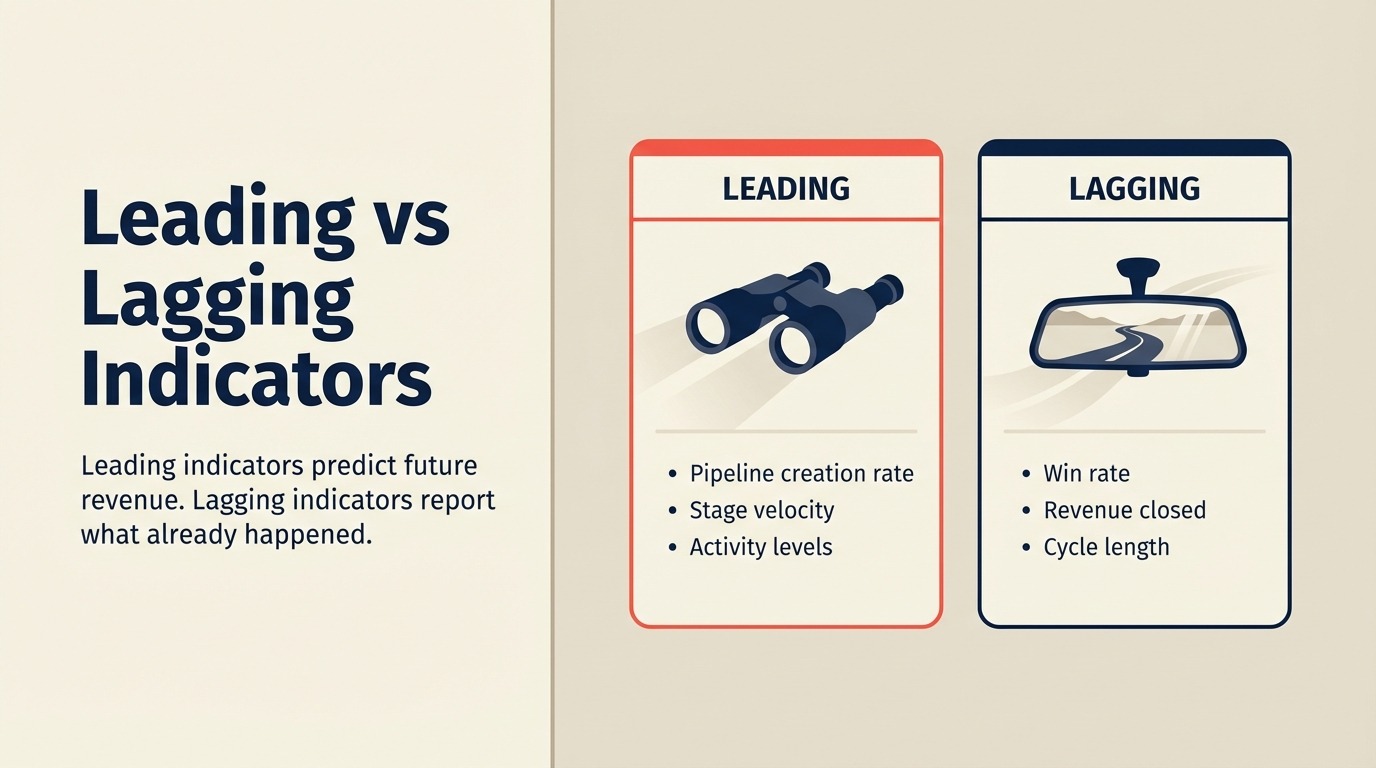
Understanding the difference between leading and lagging indicators is critical for proactive pipeline management.
Leading Indicators: What's About to Happen
Leading indicators predict future performance. They give you time to intervene.
New pipeline creation: Today's pipeline creation drives next quarter's revenue. New pipeline drops 30% this month? You'll miss targets in 60-90 days.
Early-stage conversion rates: Changes in Discovery to Qualification conversion show up in closed revenue 90-180 days later.
Activity levels: Completed discovery calls, sent proposals, and scheduled demos predict pipeline health 30-60 days out.
Deal quality scores: Rising quality scores in early stages predict higher win rates 60-90 days later.
Pipeline coverage trend: Declining coverage ratio predicts missed targets one quarter out. Effective pipeline generation strategy addresses coverage gaps before they become revenue shortfalls.
Lagging Indicators: What Already Happened
Lagging indicators report results. They're essential for understanding outcomes but don't give you time to fix problems.
Win rate: Tells you what already closed. By the time win rate drops, you've already lost the deals.
Closed revenue: The ultimate lagging indicator. Helpful for performance evaluation, useless for intervention.
Average deal size: Reflects completed deals. Useful for pattern analysis, not proactive management.
Sales cycle length: Shows past performance. Actionable only if you segment and analyze by current in-progress deals.
The Balanced Dashboard Approach
Effective pipeline dashboards balance leading and lagging indicators:
- 60% leading indicators for proactive management
- 40% lagging indicators for performance accountability
Example balanced metric set:
- Leading: New pipeline created, early conversion rates, pipeline coverage, activity metrics
- Lagging: Win rate, closed revenue, average deal size
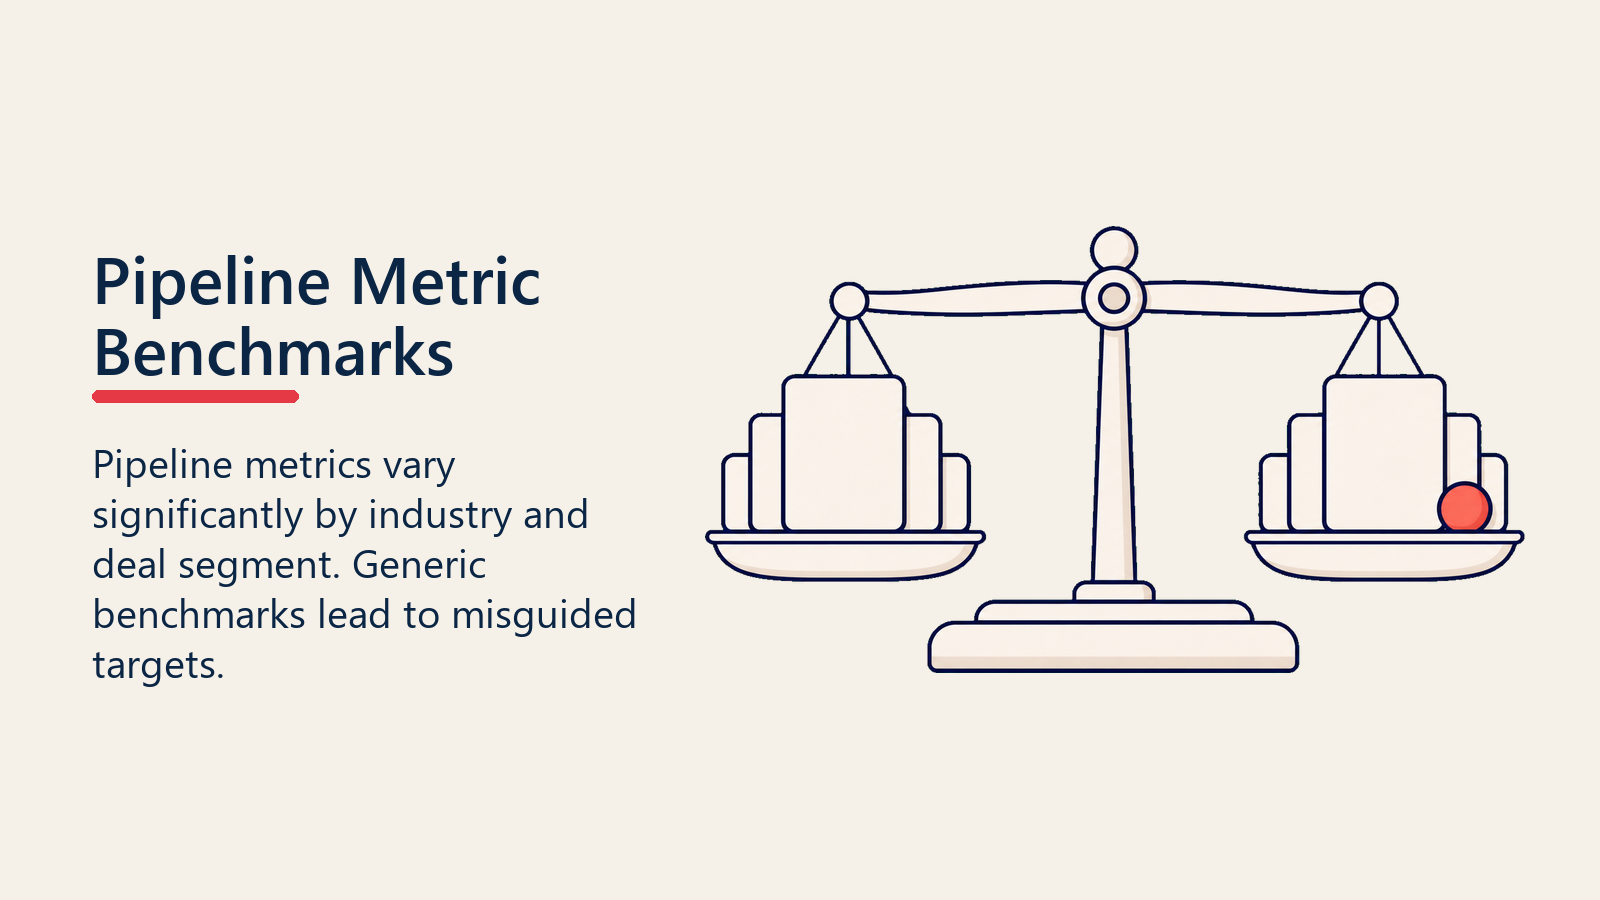
Metric Benchmarks by Industry and Segment
Pipeline metrics vary significantly by industry and deal segment. Generic benchmarks lead to misguided targets.
B2B SaaS Benchmarks
Enterprise SaaS ($100K+ ACV):
- Win rate: 25-30%
- Sales cycle: 6-12 months
- Pipeline coverage: 4-5x
- Stage-to-stage conversion: 50-60%
Mid-market SaaS ($10K-$100K ACV):
- Win rate: 30-35%
- Sales cycle: 3-6 months
- Pipeline coverage: 3-4x
- Stage-to-stage conversion: 55-65%
SMB SaaS (<$10K ACV):
- Win rate: 35-45%
- Sales cycle: 1-3 months
- Pipeline coverage: 2-3x
- Stage-to-stage conversion: 60-70%
Enterprise Software and Services
Complex enterprise deals ($500K+):
- Win rate: 20-25%
- Sales cycle: 9-18 months
- Pipeline coverage: 5-6x
- Stage-to-stage conversion: 45-55%
Professional services:
- Win rate: 30-40%
- Sales cycle: 2-4 months
- Pipeline coverage: 3-4x
- Stage-to-stage conversion: 60-70%
Industry Variations
Financial services: Longer cycles (compliance), higher win rates (relationship-driven)
Healthcare: Extended cycles (procurement), moderate win rates (clinical validation required)
Technology: Shorter cycles (faster decision), lower win rates (competitive)
Manufacturing: Moderate cycles (evaluation periods), higher win rates (fewer alternatives)
Action: Benchmark against companies in your specific industry and deal segment, not generic software averages.
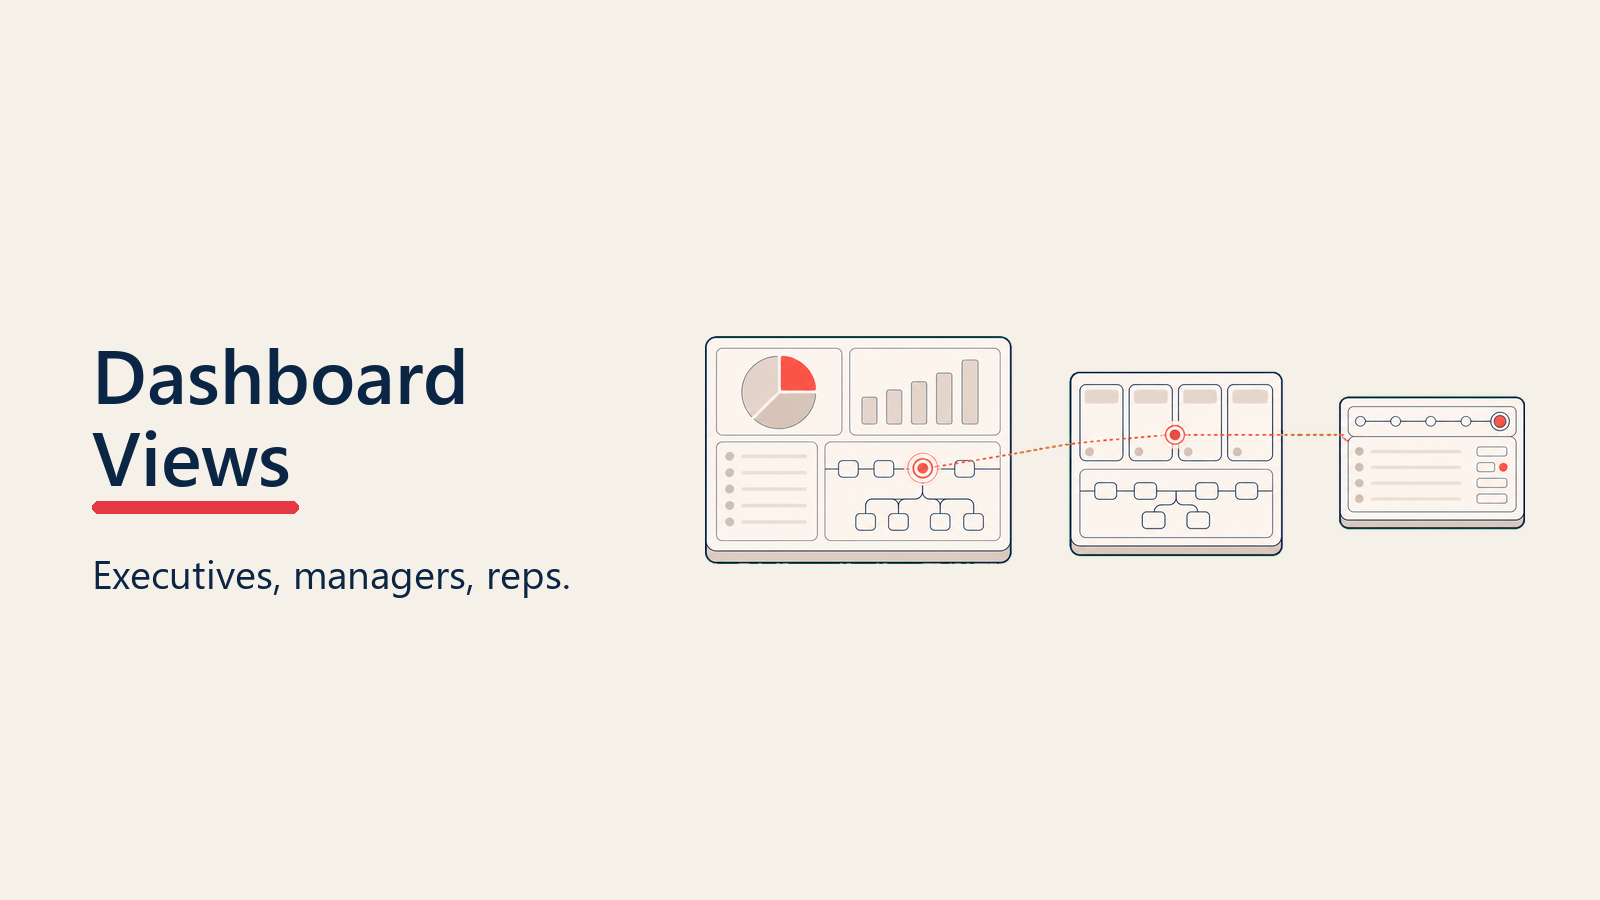
Dashboard Design: Three Views for Three Audiences
Effective pipeline metrics require purpose-built dashboards for different audiences. One dashboard can't serve everyone.
Executive View: Strategic Health
Audience: CEO, CRO, Board
Update frequency: Monthly (some metrics weekly)
Key metrics:
- Closed revenue vs target (current and trend)
- Pipeline coverage ratio
- New pipeline created (period over period)
- Weighted pipeline value
- Win rate (overall and by segment)
- Sales velocity trend
Design principles:
- High-level summary with drill-down capability
- Trend lines showing 6-12 month history
- RAG status indicators (Red/Amber/Green)
- Minimal clutter, maximum signal
Action focus: Strategic resource allocation, demand generation investment, market positioning
Manager View: Team Performance
Audience: Sales managers, sales operations
Update frequency: Weekly
Key metrics:
- Pipeline by rep (total and weighted)
- Win rate by rep and segment
- Stage-to-stage conversion rates
- Average sales cycle by rep
- Activity metrics (calls, meetings, proposals)
- Stagnant deal percentage
- New pipeline creation by rep
Design principles:
- Comparative view (rep vs rep, team vs target)
- Drill-down to individual opportunity lists
- Weekly trends and variance from baseline
- Exception reporting (underperformers highlighted)
Action focus: Coaching opportunities, deal reviews, resource allocation, performance management. Regular pipeline reviews transform these metrics into actionable team improvements.
Rep View: Individual Accountability
Audience: Individual sales representatives
Update frequency: Daily/real-time
Key metrics:
- Personal pipeline value (total and weighted)
- Open opportunity count by stage
- Deals requiring action today
- Stage duration for in-progress deals
- Personal win rate and quota attainment
- Pipeline coverage for current quarter
- Activity completion (against targets)
Design principles:
- Action-oriented (what to do today)
- Mobile-friendly
- Real-time updates
- Gamification elements (progress bars, achievements)
Action focus: Daily prioritization, deal progression, activity completion, quota tracking
Metric Pitfalls: What to Avoid
Even good metrics can be misused. Watch for these common pitfalls:

Vanity Metrics
Metrics that look impressive but don't drive decisions.
Examples:
- Total pipeline value without context
- Number of activities without conversion tie-in
- Deal count without value or quality consideration
Fix: Always pair volume metrics with quality and conversion metrics.
Gaming the System
Metrics can drive bad behavior when reps optimize for measurement instead of outcomes.
Examples:
- Sandbagging (holding deals back to make next quarter easier)
- Pipeline padding (inflating deal values or adding unlikely deals)
- Premature stage advancement (moving deals forward before qualifying)
Fix:
- Measure leading and lagging indicators together
- Implement pipeline hygiene requirements (age limits, activity requirements)
- Weight metrics properly (win rate matters more than pipeline volume)
Over-Optimization
Focusing so heavily on one metric that others suffer.
Examples:
- Obsessing over response time → Quantity over quality follow-up
- Optimizing win rate → Cherry-picking deals, missing volume targets
- Maximizing pipeline coverage → Accumulating junk pipeline
Fix: Implement balanced scorecards that measure across categories (volume, quality, velocity, value).
Measurement Without Action
Tracking metrics religiously but never acting on insights.
Examples:
- Noticing declining conversion rates but not investigating root causes
- Seeing pipeline coverage drop but not adjusting demand gen
- Identifying rep variance but not coaching
Fix: Every metric dashboard should trigger defined actions at specific thresholds.
Ignoring Segmentation
Aggregate metrics mask important patterns.
Examples:
- Overall win rate when enterprise and SMB perform very differently
- Average sales cycle when product lines have distinct patterns
- Total pipeline when different regions are in different states
Fix: Always segment by relevant dimensions (segment, rep, product, region, source). Thoughtful pipeline segmentation enables meaningful comparative analysis.
Conversion Rate Analysis: The Deep Dive
While covered briefly in quality metrics, conversion rate analysis deserves special attention as one of the highest-leverage analytical practices.
Learn more: Conversion Rate Analysis: Finding the Leak in Your Pipeline
Conclusion: Measure What Moves Revenue
Pipeline metrics aren't academic exercises. They're diagnostic tools that reveal exactly where your revenue engine is succeeding and where it's breaking down.
Companies that consistently hit targets don't have magic sales teams or lucky timing. They have measurement discipline: tracking the right metrics, segmenting them properly, and acting on what they reveal.
Start with the fundamentals:
- Volume metrics answer "Do we have enough?"
- Quality metrics answer "Is it real?"
- Velocity metrics answer "Are we efficient?"
- Value metrics answer "What's it worth?"
Build dashboards for your three audiences. Executives need strategic signals, managers need performance analytics, reps need daily accountability.
Most importantly, avoid measurement theater. Track metrics because they drive decisions, not because they look good in board decks.
The pipeline metrics you measure determine the revenue outcomes you achieve. Choose wisely.
Ready to optimize your pipeline metrics? Explore how what is sales pipeline fundamentals connect to measurement frameworks, and learn how pipeline coverage analysis reveals whether you have enough pipeline to hit your targets.
Learn more:
- Pipeline Velocity: The Metric That Combines Volume, Value, and Speed
- Weighted Pipeline: Beyond Gross Pipeline Value
- Conversion Rate Analysis: Finding the Leak in Your Pipeline
- Forecasting Fundamentals: Building Accurate Revenue Predictions
- Pipeline Bottleneck Analysis: Identifying and Resolving Constraints

Senior Operations & Growth Strategist
On this page
- What Makes a Pipeline Metric Actually Useful?
- The Four Categories That Cover Everything
- Volume Metrics: Quantity and Flow
- Quality Metrics: Conversion and Win Rates
- Velocity Metrics: Speed and Efficiency
- Value Metrics: Size and Revenue Potential
- Volume Metrics: Understanding Pipeline Quantity
- Total Pipeline Value
- Pipeline by Stage
- New Pipeline Created (Period Over Period)
- Pipeline Adds vs Exits
- Open Opportunities Count
- Quality Metrics: Measuring Conversion and Win Rates
- Stage-to-Stage Conversion Rates
- Overall Win Rate
- Win Rate by Segment, Rep, and Product
- Loss Analysis and Reasons
- Deal Quality Score
- Velocity Metrics: Tracking Speed and Efficiency
- Average Sales Cycle Length
- Time in Each Stage
- Pipeline Velocity
- Deal Acceleration and Deceleration
- Stagnant Deal Percentage
- Value Metrics: Understanding Deal Economics
- Average Deal Size
- Deal Size Distribution
- Weighted Pipeline Value
- Pipeline Coverage Ratio
- Expected Revenue (Probability-Adjusted)
- Leading vs Lagging Indicators: What Predicts vs What Reports
- Leading Indicators: What's About to Happen
- Lagging Indicators: What Already Happened
- The Balanced Dashboard Approach
- Metric Benchmarks by Industry and Segment
- B2B SaaS Benchmarks
- Enterprise Software and Services
- Industry Variations
- Dashboard Design: Three Views for Three Audiences
- Executive View: Strategic Health
- Manager View: Team Performance
- Rep View: Individual Accountability
- Metric Pitfalls: What to Avoid
- Vanity Metrics
- Gaming the System
- Over-Optimization
- Measurement Without Action
- Ignoring Segmentation
- Conversion Rate Analysis: The Deep Dive
- Conclusion: Measure What Moves Revenue