Churn Rate: How to Calculate and Reduce It
Turn this article into takeaways for your work.
Each assistant summarizes the article only for you and suggests best practices for your work.
Churn rate is the percentage of customers (or revenue) your business loses over a given period. It's one of the most consequential metrics in SaaS because even a small monthly churn, left unchecked, quietly erodes growth that took months to build.
Key Facts
- The average monthly churn rate for SaaS companies is 3-8%, which translates to losing 31-65% of the customer base annually (Recurly Research, 2023).
- Companies with strong customer success programs see churn rates 23% lower than peers without dedicated retention programs (Totango State of CS, 2023).
- A 5% improvement in customer retention can increase profits by 25-95% because retained customers buy more and cost less to serve (Bain & Company, 2020).
What is churn rate?
Churn rate (also called attrition rate) measures how many customers stopped paying you during a defined period, expressed as a percentage of the customers you had at the start of that period. A high churn rate means you're losing customers faster than you're replacing them. A low churn rate signals that customers find enough value to stay.
Churn rate is a lagging indicator: by the time it shows up in your report, the customer has already decided to leave. The real work of reducing churn happens upstream, in onboarding, adoption, and ongoing value delivery.
You'll see churn measured in two primary ways: customer churn (how many accounts left) and revenue churn (how much recurring revenue disappeared). Both matter, and they tell different stories.
Customer churn vs revenue churn
| Dimension | Customer churn | Revenue churn |
|---|---|---|
| What it counts | Number of accounts lost | Monthly recurring revenue lost |
| Formula | Customers lost / starting customers | MRR lost / starting MRR |
| Best for | Tracking retention at the account level | Understanding financial impact of churn |
| Blind spots | Ignores deal size (a $5k/yr loss = same as $500k/yr loss) | Can look better than it is if small accounts leave |
| Sub-types | N/A | Gross revenue churn, Net revenue churn |
Revenue churn breaks down further:
- Gross revenue churn (GRC): MRR lost from cancellations and downgrades, before counting any expansion revenue.
- Net revenue churn (NRR): GRC minus expansion MRR (upsells, cross-sells, seat adds). If expansion revenue exceeds losses, NRR goes negative, which is a sign of a healthy growth engine.
Net revenue retention (the inverse: 100% minus net revenue churn) is one of the strongest predictors of long-term SaaS health. See Net Revenue Retention for a full breakdown.
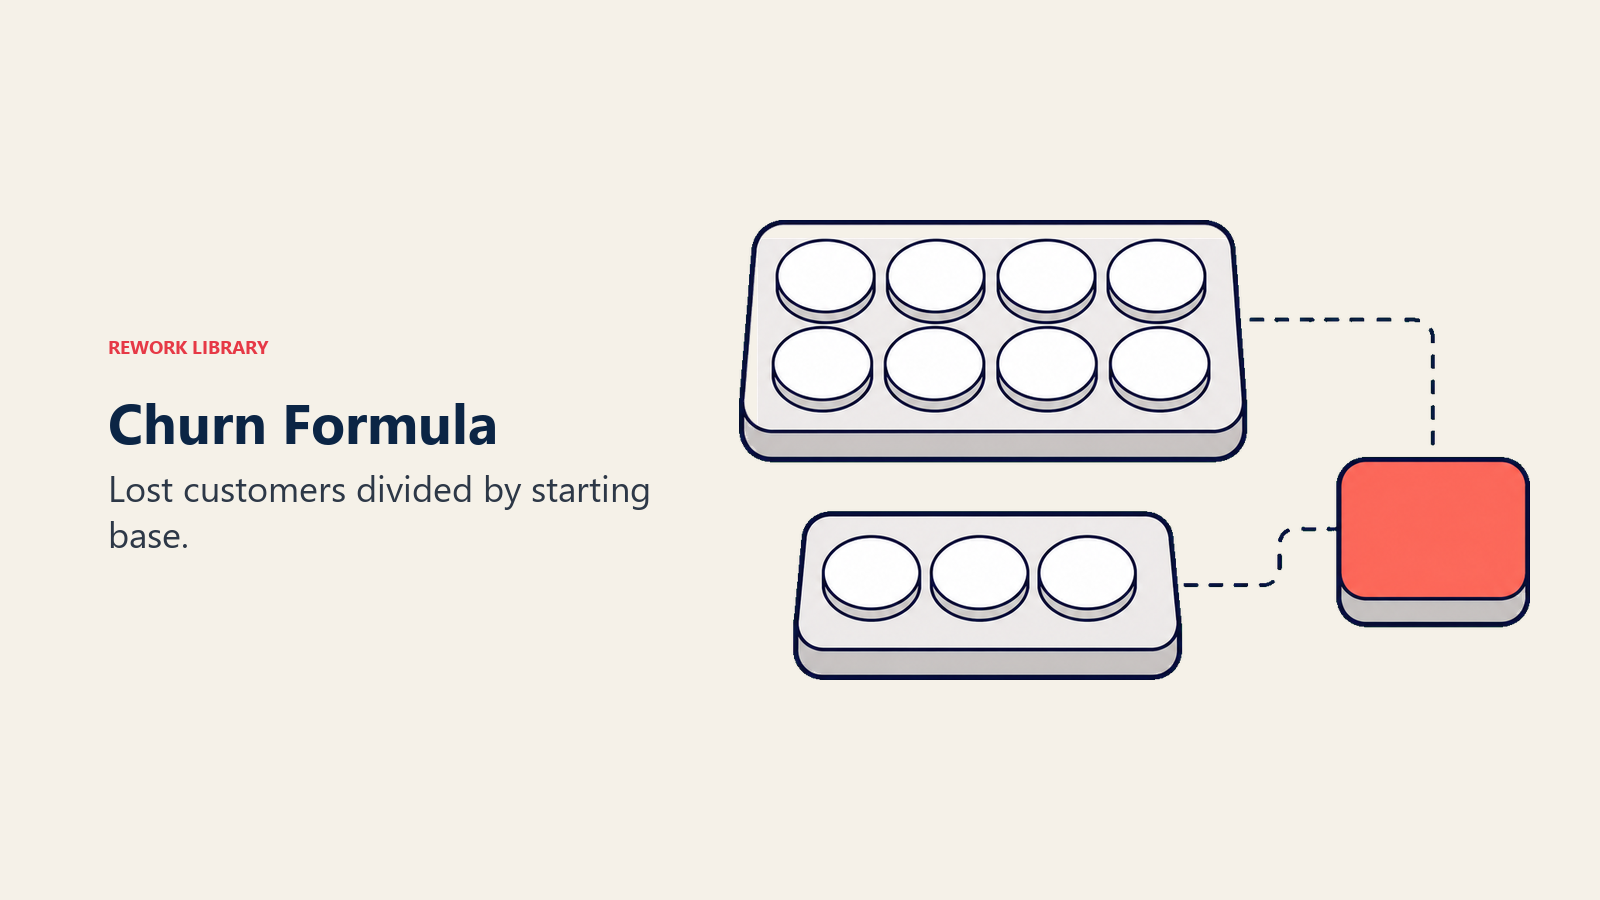
Churn rate formula
Customer churn rate
Customer Churn Rate = (Customers Lost During Period / Customers at Start of Period) x 100
Revenue churn rate (gross)
Gross Revenue Churn Rate = (MRR Lost from Cancellations + Downgrades) / MRR at Start of Period x 100
Net revenue churn rate
Net Revenue Churn Rate = (MRR Lost - MRR Gained from Expansion) / MRR at Start of Period x 100
Worked example
A SaaS company starts January with 500 customers and $200,000 MRR. During January:
- 20 customers cancel (4% customer churn)
- Those cancellations represent $6,000 in lost MRR
- 3 customers downgrade, losing $1,500 MRR
- Existing customers expand by $4,000 MRR
| Metric | Calculation | Result |
|---|---|---|
| Customer churn rate | 20 / 500 x 100 | 4.0% |
| Gross revenue churn rate | ($6,000 + $1,500) / $200,000 x 100 | 3.75% |
| Net revenue churn rate | ($7,500 - $4,000) / $200,000 x 100 | 1.75% |
The customer churn rate (4%) looks worse than the net revenue churn (1.75%) because the customers who expanded were higher-value accounts. That distinction shapes where you invest retention resources.
You can connect churn math to broader metrics like Annual Recurring Revenue and LTV:CAC Ratio to model the full revenue impact.
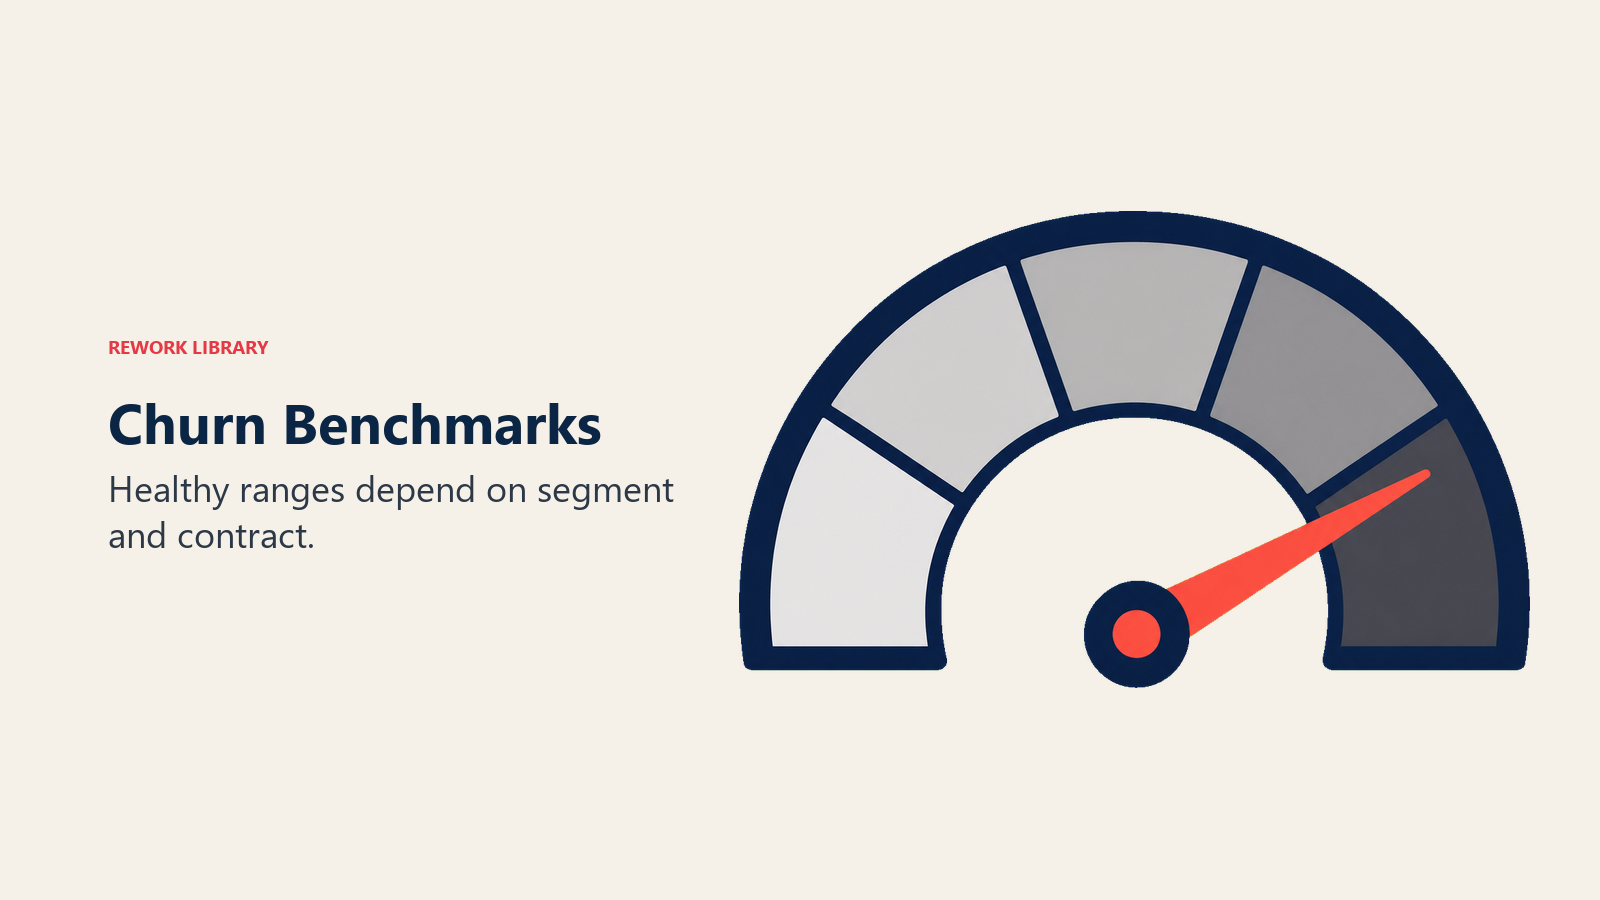
Churn rate benchmarks
Benchmarks vary widely by contract length, segment size, and product category. Use these as directional guides, not hard targets.
| Segment | Monthly customer churn | Annual customer churn | Notes |
|---|---|---|---|
| SMB (< 100 employees) | 3-7% | 36-60% | Higher churn typical; shorter contracts, tighter budgets |
| Mid-Market (100-999 employees) | 1-3% | 12-32% | More structured procurement, but still discretionary |
| Enterprise (1,000+ employees) | 0.5-1.5% | 6-17% | Multi-year contracts anchor retention |
| Consumer / PLG | 5-10%+ | Varies | Freemium trial-to-paid compounds churn complexity |
| Annual contract SaaS | < 1% monthly | 5-10% annually | Renewal events concentrate risk |
Monthly vs annual measurement: Monthly churn compounds. A 3% monthly churn does not equal 36% annual churn. The actual formula is:
Annual Churn = 1 - (1 - Monthly Churn Rate)^12
At 3% monthly, you lose 30.6% of customers annually. At 5% monthly, the annual figure is 46%. That compounding is why even "acceptable" monthly numbers demand attention.
For context on how churn affects pipeline health, see Pipeline Metrics Overview and Revenue Predictability.
Why churn compounds
Churn doesn't just subtract customers. It taxes growth. Imagine you add 50 new customers per month but lose 5% of your base each month. With 500 customers starting, Month 1 nets you 25 customers (50 new, 25 churned). But as the base grows, so does the absolute number of churners. Eventually, your gross additions barely outpace losses.
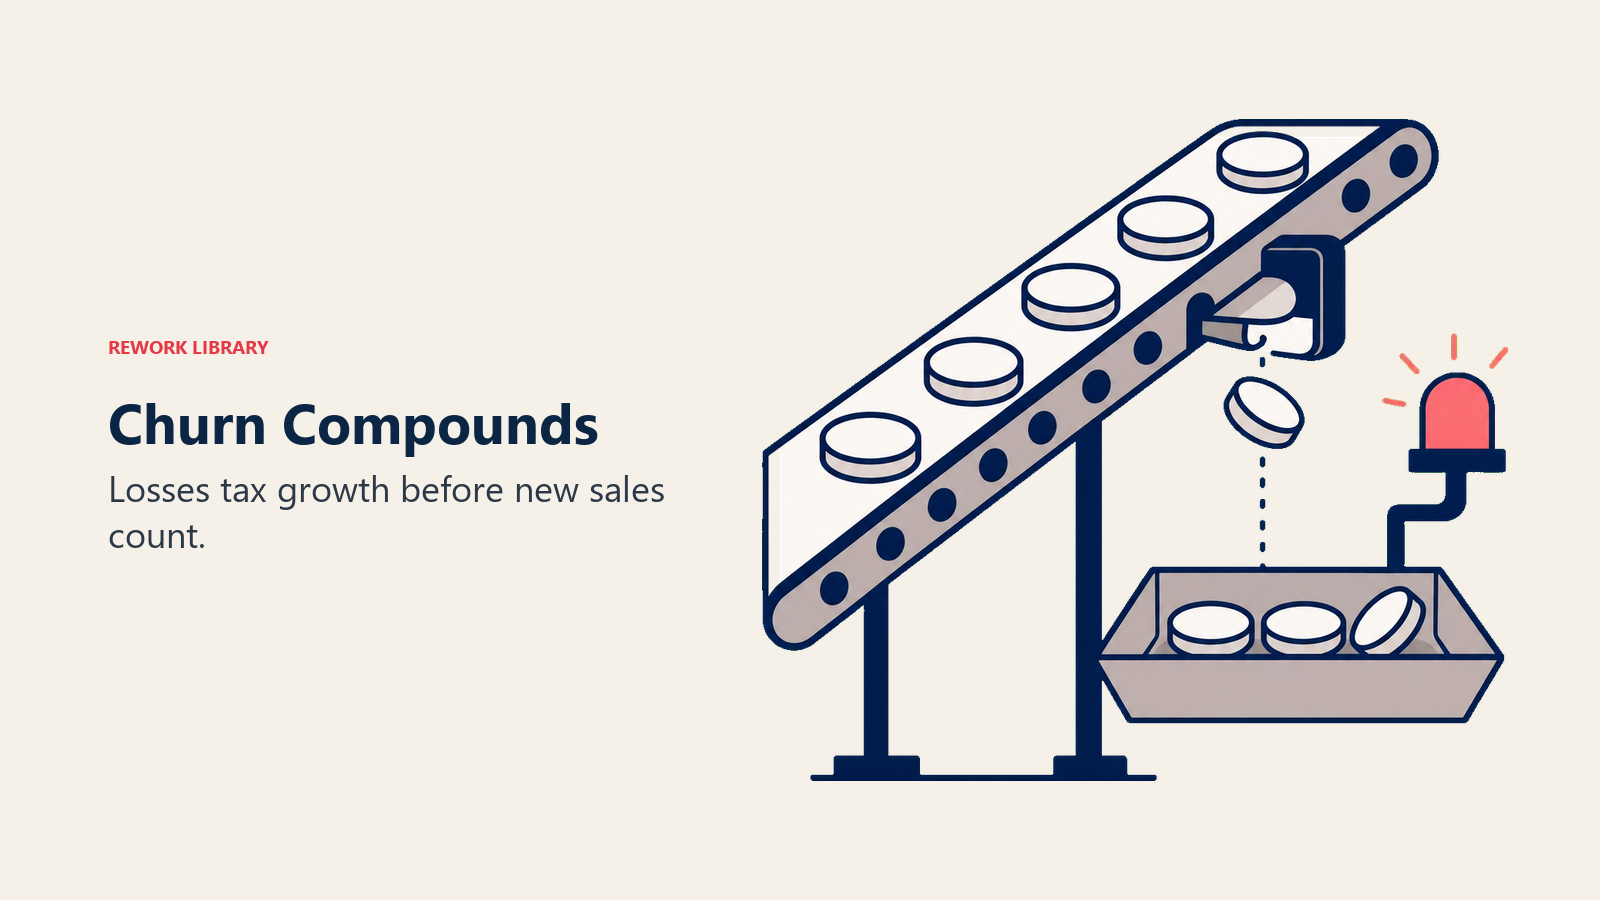
This is the "leaky bucket" problem. New customer acquisition costs roughly 5-25x more than retaining an existing customer (Harvard Business Review), so every churned customer requires multiple new logos just to maintain flat revenue. That makes churn a direct multiplier on Customer Acquisition Cost.
How to reduce churn rate
Step 1: Identify the leading indicators early
Churn doesn't happen overnight. Customers typically show warning signs 30-90 days before they cancel:
- Login frequency drops below baseline
- Key features go unused (especially those tied to the core value proposition)
- Support ticket volume spikes, especially around the same issues
- Executive sponsor changes or goes dark
- Renewal date approaches with no engagement from the account
Build a customer health score that weights these signals. Automate alerts when a score drops below a threshold. At this stage, the customer is reachable.
Step 2: Fix onboarding before anything else
The biggest driver of early churn (months 1-3) is a weak onboarding experience. Customers who don't reach their first "aha moment" within the first two weeks are far more likely to cancel. Map the fastest path to value realization, remove any friction in that path, and assign a human touchpoint for accounts above a minimum contract value.
Specific tactics:
- Define a clear activation milestone (the action that correlates with retention)
- Trigger in-app guidance for accounts that haven't hit it within 7 days
- Schedule a success call at day 14 for mid-market and above
Step 3: Run health-score-based save plays
Not all at-risk customers need the same intervention. Segment your at-risk cohort:
| Health tier | Signal | Save play |
|---|---|---|
| Yellow (score 60-75) | Declining engagement | Automated check-in email + resource send |
| Orange (score 40-59) | Multiple red flags | CS rep outreach, usage review call |
| Red (score < 40) | Near-certain churn | Executive sponsor call, custom success plan |
The goal of a save play is not to offer a discount. It's to re-establish the business case for staying. Ask what outcomes they expected, which ones they got, and which ones they didn't. Then build a 30-day plan to close the gap.
Step 4: Align expansion and retention motions
Customers who expand their contract are statistically the most likely to renew. Identify your highest-engagement accounts and build upsell plays around natural usage inflection points (seat limits reached, feature adoption completing, contract anniversary approaching). Expansion revenue also improves net revenue churn, as shown in the formula above, and strengthens the metrics that matter to investors who track Net Revenue Retention.
Step 5: Close the feedback loop from churned customers
Run structured exit interviews or surveys with churned accounts. Most companies skip this step. But churned customers are your most honest source of product and process feedback. Ask:
- What value did you expect to get?
- What did you actually get?
- What would have had to be true for you to stay?
Feed those answers into product, onboarding, and CS playbooks. This turns churn into organizational learning.
Common mistakes
Measuring churn monthly when contracts are annual. Annual contract businesses should measure churn at the renewal cohort level, not monthly. Monthly fluctuations on an annual book of business generate noise, not signal.
Confusing customer churn and revenue churn. A company can have 10% customer churn and negative net revenue churn at the same time (if the accounts that left were small and expansions from remaining accounts more than offset the loss). Always track both.
Ignoring early churn in a segment. Many teams focus retention resources on highest-ACV accounts and let SMB churn run high, assuming it's structural. But SMB churn at 7%+ monthly is often a product-market fit signal, not a segment characteristic.
Offering discounts as the default save play. Discounts train customers to cancel to get a better price. They don't address the root cause. Use discounts only as a last resort, with a clear path to value realization attached.
Conflating churn reduction with churn prevention. Churn reduction (save plays) addresses customers already at risk. Churn prevention (onboarding, health scores, value delivery) addresses the conditions that create risk. Both matter, but prevention is a higher-leverage investment.
Best practices
Segment your churn data. Aggregate churn hides the real story. Slice by cohort (signup month), segment (SMB vs enterprise), contract type (monthly vs annual), geography, and product tier. Each slice may have a different root cause and a different fix.
Set retention goals by cohort, not by period. Instead of targeting "3% monthly churn," target "85% of accounts signed in Q1 2026 still active at month 12." Cohort-based retention goals create accountability at the team level and connect individual accounts to long-term outcomes.
Treat QBRs as retention tools. A quarterly business review done well re-anchors the customer on ROI, previews the product roadmap, and surfaces risks before they become cancellations. Companies that run consistent QBRs see materially lower churn in enterprise segments.
Monitor time-to-value across cohorts. If a recent cohort takes 30% longer to hit activation than prior cohorts, you've likely introduced friction in onboarding or the product. Catch it before it shows up in churn data.
Churn reduction connects directly to the revenue metrics in LTV:CAC Ratio and affects the forecast models described in Revenue Predictability.
Frequently Asked Questions about Churn Rate
What is a good churn rate for SaaS?
For B2B SaaS with annual contracts, a gross revenue churn rate below 5% annually is considered healthy. Monthly churn below 1% is a strong target for mid-market and enterprise. SMB-focused products with monthly billing often run 3-7% monthly, which is high but common for the segment. The most important benchmark is your own trend: is it improving quarter over quarter?
How is churn rate different from retention rate?
They're complementary. Retention rate = 100% minus customer churn rate. A 5% monthly churn rate means a 95% monthly retention rate. Retention rate is often used to communicate good news (high retention), while churn rate is used to highlight the problem (accounts being lost). Both measure the same underlying dynamic.
Should I use monthly or annual churn?
Use the period that matches your contract length. Annual contracts measured monthly create false volatility. Monthly contracts measured annually obscure fast-moving problems. When comparing to benchmarks or investors, most SaaS companies report annual churn on an annual-contract basis, or monthly churn on a monthly-contract basis.
What causes sudden spikes in churn?
Common causes: a product change that removed a feature customers relied on, a pricing increase without sufficient value communication, a competitor offering better pricing or functionality, economic pressure on the customer's business, or a change in the customer's internal champion. Each cause requires a different response, so always segment a churn spike by the reason codes from exit surveys.
How does churn affect valuation?
Investors in SaaS businesses typically apply a revenue multiple to ARR, and that multiple is heavily influenced by net revenue retention. A business with 110% NRR (meaning it expands existing customers faster than it loses them) commands a significantly higher multiple than a business with 85% NRR. Reducing churn and growing expansion revenue are the two most direct levers on enterprise value.
Churn rate is one of those metrics that looks simple and hides complexity. Getting the calculation right is the easy part. The real work is building the systems, from onboarding to health scoring to save plays, that make a low churn rate the natural result of how your business operates. Start by measuring both customer and revenue churn, segment the data by cohort, and build one intervention for your highest-risk tier. The compounding math works in your favor once retention improves.

Senior Operations & Growth Strategist
On this page
- What is churn rate?
- Customer churn vs revenue churn
- Churn rate formula
- Customer churn rate
- Revenue churn rate (gross)
- Net revenue churn rate
- Worked example
- Churn rate benchmarks
- Why churn compounds
- How to reduce churn rate
- Step 1: Identify the leading indicators early
- Step 2: Fix onboarding before anything else
- Step 3: Run health-score-based save plays
- Step 4: Align expansion and retention motions
- Step 5: Close the feedback loop from churned customers
- Common mistakes
- Best practices