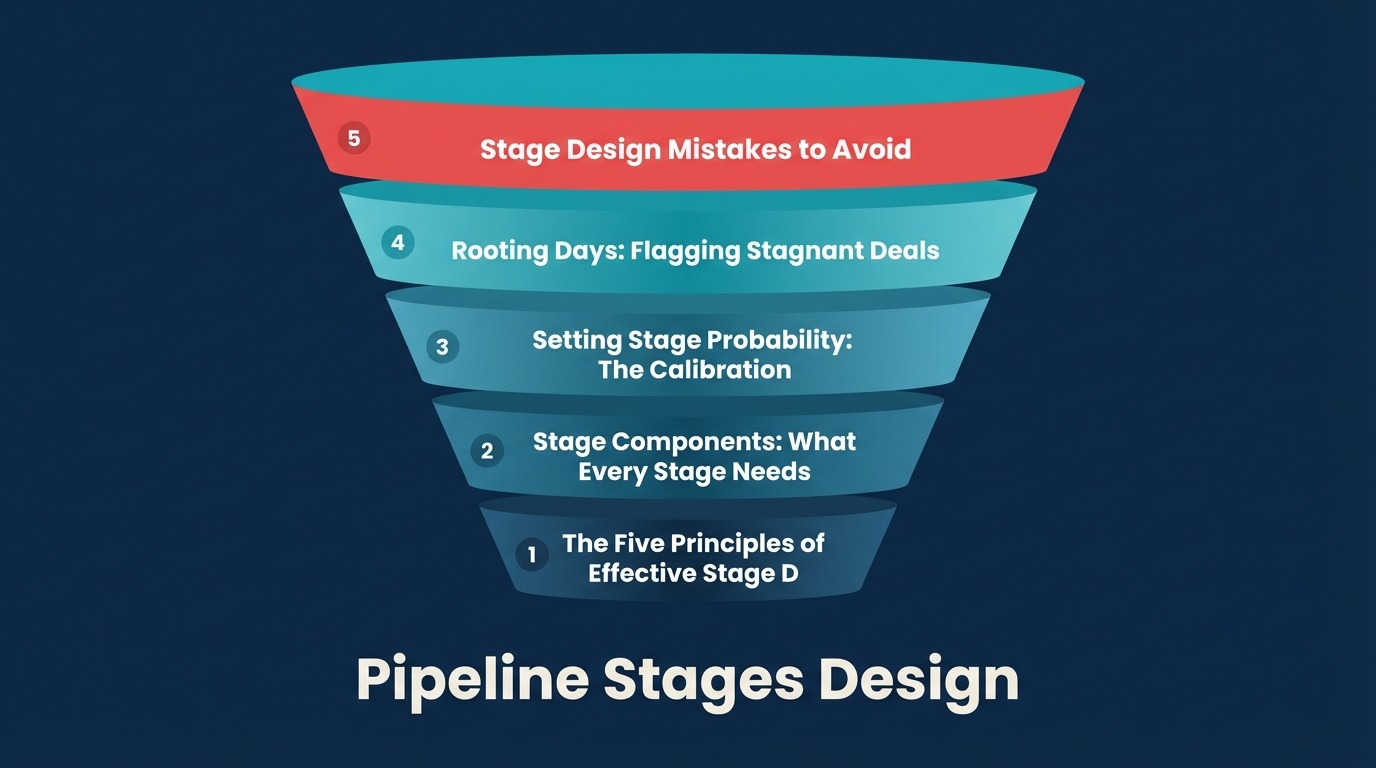
Pipeline Stages Design: Crafting the Revenue Progression Framework
Turn this article into takeaways for your work.
Each assistant summarizes the article only for you and suggests best practices for your work.
Here's the uncomfortable truth: most pipeline stages are theater.
They're named after what the sales team does, "Demo Scheduled," "Proposal Sent," "Negotiation", not what the buyer actually accomplished. And that's why your forecasts are consistently off by 30-40%, your sales cycles are unpredictable, and your revenue operations feel like controlled chaos.
If you're running revenue operations or building a predictable sales engine, you need to understand this: pipeline stages aren't just labels in your CRM. They're the foundation of your entire forecasting system. The difference between companies with accurate forecasts and those constantly missing targets? How rigorously they design their stages.
What Makes Pipeline Stages Fail?
Before we talk about good stage design, let's diagnose why most pipelines fail.
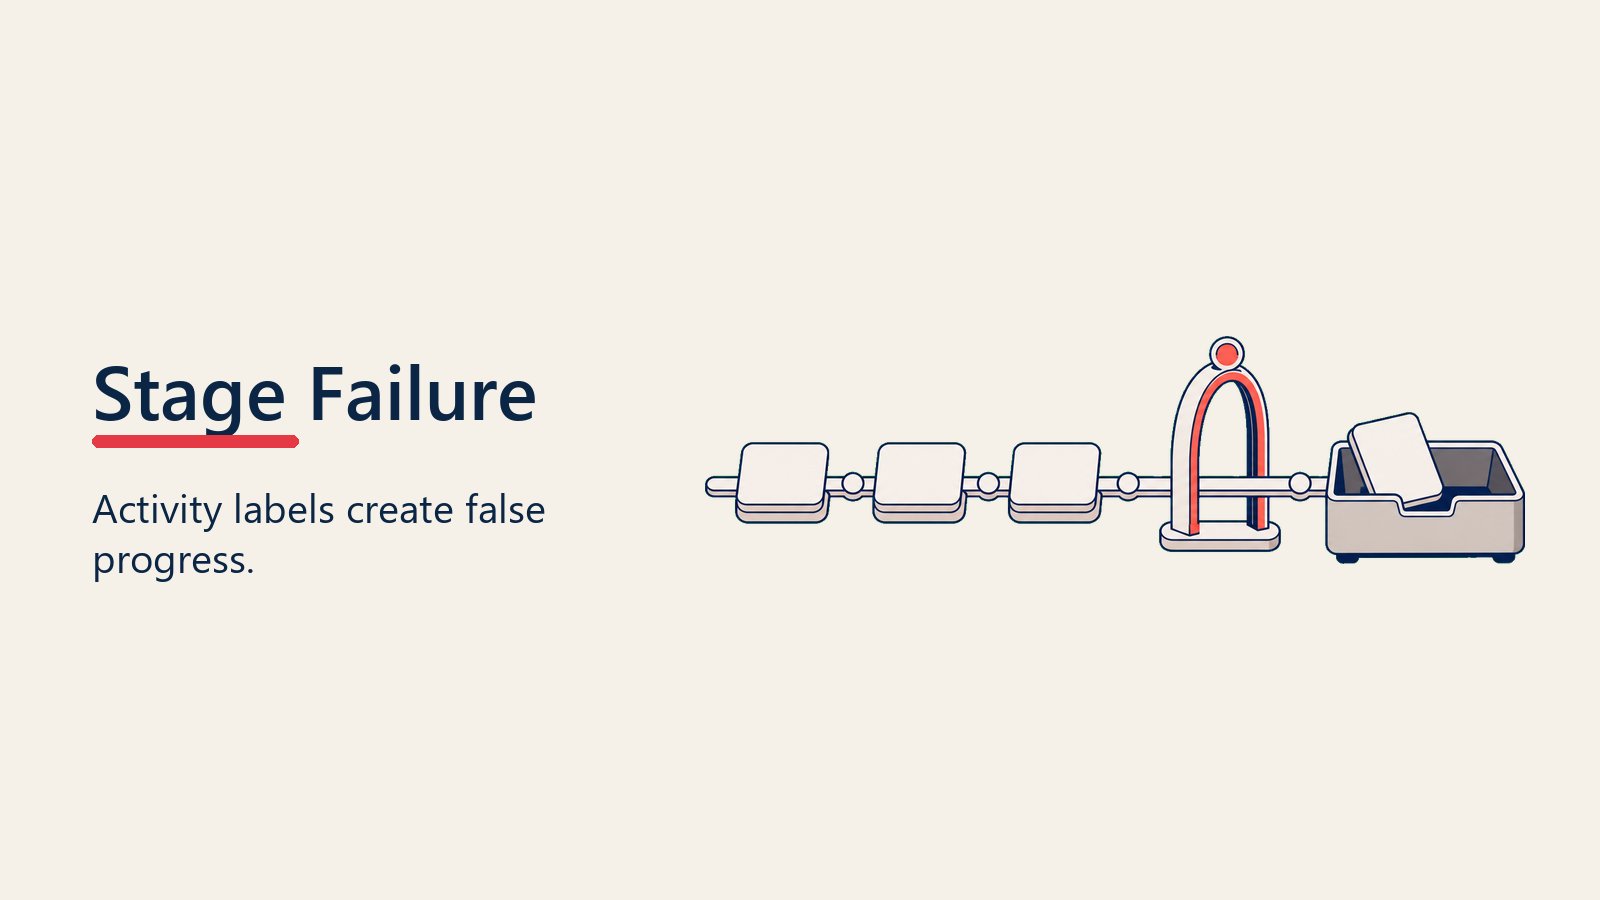
The Activity Trap: Stages named "Demo Completed" or "Proposal Sent" track seller activities, not buyer commitment. Your rep sent a proposal. Great. Did the buyer read it? Share it with decision-makers? Commit to next steps? Activity-based stages create false progression.
The Black Box Problem: "Evaluation" or "In Discussion" stages that last 60 days tell you nothing. What's happening inside that black box? Is the buyer building consensus, or has the deal gone dark? Vague stages hide reality.
The Probability Fiction: Assigning 50% probability to "Proposal Sent" because it feels middle-of-the-funnel creates systematically wrong forecasts. Probability should reflect historical win rates at each stage, not arbitrary percentages that feel right. Understanding probability modeling is essential for accurate forecasts.
The No-Exit-Criteria Issue: Without clear exit criteria, deals advance based on optimism rather than evidence. "We had a good call" becomes justification to move from 20% to 60% probability. Hope is not a strategy.
The result? Inflated pipelines, missed forecasts, and leadership teams that don't trust the numbers they're seeing.
The Five Principles of Effective Stage Design
Effective stage design uses buyer evidence, clear exits, and consistent definitions to make pipeline movement meaningful.
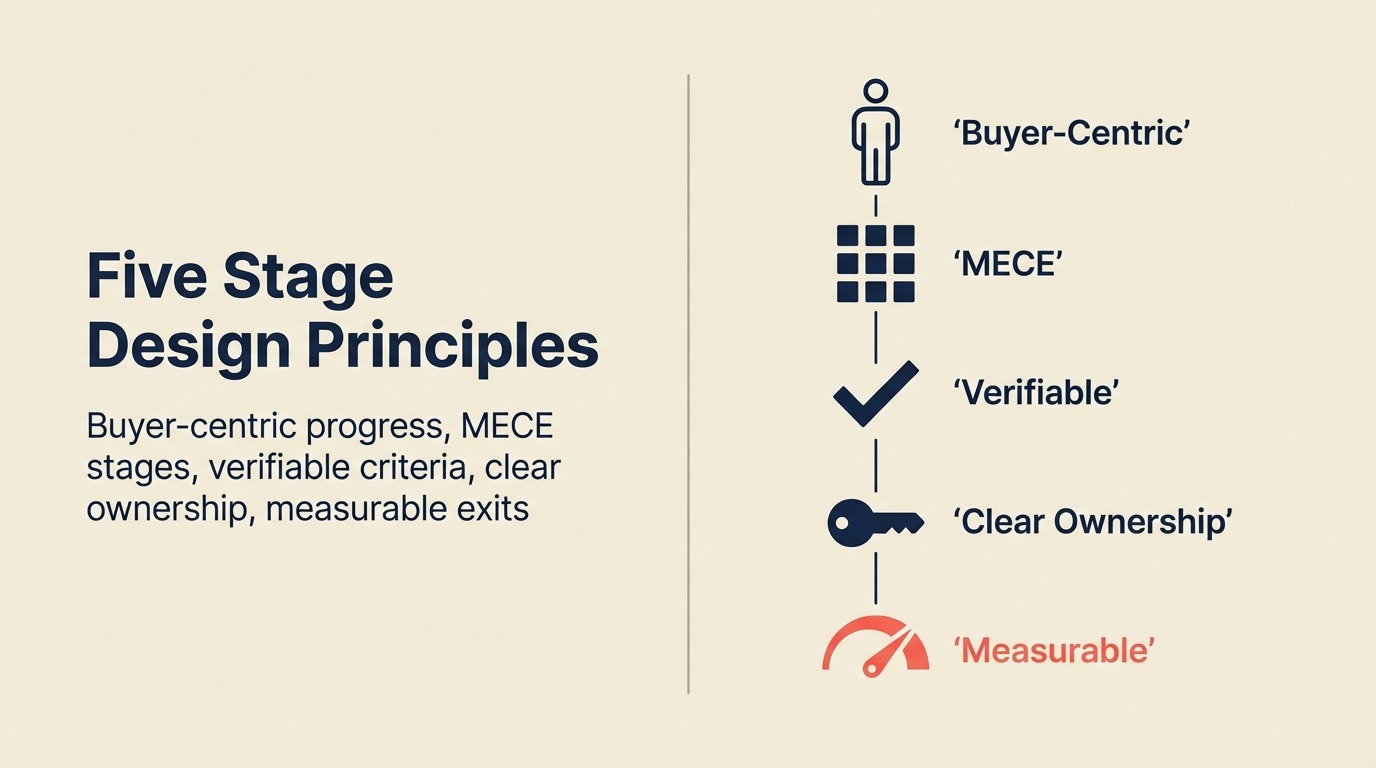
Good pipeline stages share five core design principles:
1. Buyer-Centric Progress (Not Seller Activity)
Stages should reflect what the buyer accomplished, not what you did.
Bad: "Demo Delivered" Good: "Solution Validated" (buyer confirmed fit)
Bad: "Proposal Sent" Good: "Business Case Reviewed" (buyer evaluated ROI with stakeholders)
Bad: "Contract Sent" Good: "Final Approval Pending" (buyer committed to procurement process)
This shift from activity to outcome changes everything. Your team has to get buyer confirmation before advancing deals. False progression goes away. And your forecasts are based on buyer commitment instead of seller hope.
2. MECE: Mutually Exclusive and Collectively Exhaustive
Every deal should fit exactly one stage at any given time. No overlaps, no gaps.
Mutually Exclusive means a deal can't be in "Needs Analysis" and "Proposal Review" simultaneously. Each stage has distinct entry and exit criteria.
Collectively Exhaustive means every possible deal state has a corresponding stage. You can't have deals that don't fit anywhere.
This principle keeps your reporting clean, your forecasting accurate, and your stage progression logical.
3. Observable and Verifiable
Anyone reviewing the deal should be able to verify the current stage based on objective evidence.
Not Verifiable: "Buyer is interested" Verifiable: "Buyer shared technical requirements document"
Not Verifiable: "Decision-maker engaged" Verifiable: "Economic buyer attended demo and defined evaluation criteria"
Not Verifiable: "Deal is progressing" Verifiable: "Buyer scheduled internal business case review for [specific date]"
Observable stages create accountability and eliminate sandbagging. Managers can assess deal health based on evidence, not gut feel.
4. Measurable Progression
Each stage should have quantifiable metrics: conversion rate to next stage, average duration, and probability of winning from that stage.
After 6-12 months of operation, you should know:
- 40% of deals in "Solution Validated" convert to "Business Case Reviewed"
- Average duration in "Business Case Reviewed" is 18 days
- Deals that reach "Final Approval" close at 85% rate
This data gives you accurate forecasting, helps you spot bottlenecks through pipeline bottleneck analysis, and shows where to improve your process.
5. Actionable Next Steps
Every stage should imply clear next actions for the sales team.
If a deal is in "Needs Analysis," the rep knows to schedule stakeholder interviews, document pain points, and map decision process.
If a deal reaches "Final Approval," the rep knows to coordinate with legal, prepare onboarding materials, and schedule kickoff calls.
Actionable stages turn your pipeline into a playbook, not just a tracking system.
Common Stage Patterns by Sales Motion
Stage patterns should match the sales motion because transactional, enterprise, channel, and expansion deals move differently.
Different sales motions need different stage setups. Here are patterns that work:
Simple B2B (4-5 Stages)
Best for: Straightforward B2B sales with 30-90 day cycles, single decision-maker or small buying committee.
Stages:
- Qualified (20%): Buyer confirms budget, authority, need, timeline (BANT)
- Needs Analysis (40%): Buyer documented pain points and success criteria
- Proposal Review (60%): Buyer evaluating ROI and comparing options
- Negotiation (80%): Terms being finalized, contract in legal review
- Closed Won/Lost (100%/0%): Deal outcome
Rooting Days: 21 / 14 / 14 / 10
This pattern works well for mid-market deals with clear decision processes and limited stakeholder complexity.
Complex Enterprise (6-8 Stages)
Best for: Enterprise sales with 90-180+ day cycles, multiple stakeholders, technical validation, procurement, and security reviews.
Stages:
- Opportunity Qualified (10%): Economic buyer engaged, budget confirmed
- Discovery Completed (20%): Buyer documented requirements and success metrics
- Technical Validation (30%): Buyer's technical team validated solution fit
- Business Case Approved (50%): Economic buyer approved ROI and secured internal consensus
- Procurement Review (70%): Buyer's procurement engaged, contract negotiation started
- Security/Legal Review (80%): Security questionnaire approved, legal reviewing terms
- Final Approval (90%): All approvals secured, awaiting signature
- Closed Won/Lost (100%/0%)
Rooting Days: 30 / 21 / 21 / 14 / 14 / 10 / 7
Complex enterprise deals require granular stages to track multi-threaded validation processes and identify stalls early. For these deals, the MEDDIC framework provides additional rigor for qualification.
Product-Led Growth (3-4 Stages)
Best for: PLG motions where users start with self-serve trial, then convert to paid or upgrade to enterprise.
Stages:
- Trial Active (20%): User signed up and activated key features
- Expansion Opportunity (50%): User demonstrated purchase intent (usage threshold, requested sales call)
- Purchase Decision (75%): Buyer reviewing pricing and terms
- Closed Won/Lost (100%/0%)
Rooting Days: 14 / 10 / 7
PLG pipelines focus on product engagement signals and purchase intent rather than traditional discovery and demo processes.
Transactional/SMB (2-3 Stages)
Best for: High-velocity, low-touch sales with short cycles (7-30 days) and quick decision processes.
Stages:
- Qualified (30%): Buyer confirmed need and budget
- Proposal Sent (70%): Buyer reviewing contract
- Closed Won/Lost (100%/0%)
Rooting Days: 7 / 5
Transactional pipelines prioritize speed over detailed progression tracking. Fewer stages mean faster deal flow and less administrative overhead.
Stage Components: What Every Stage Needs
Every stage needs entry criteria, exit criteria, required evidence, owner expectations, and forecast treatment.
Each stage in your pipeline should include these seven elements:
1. Stage Name
Clear, buyer-centric name that reflects progress, not activity.
Example: "Business Case Approved" (not "Proposal Sent")
2. Entry Criteria
What must happen for a deal to enter this stage? Be specific and verifiable.
Example for "Business Case Approved":
- Economic buyer approved ROI analysis
- Champion shared internal business case with stakeholders
- Buyer scheduled next step with procurement or legal
3. Exit Criteria
What must happen to progress to the next stage? This prevents false advancement.
Example for "Business Case Approved":
- Buyer initiated procurement process
- Contract sent to legal for review
- Procurement contact assigned and engaged
4. Key Activities
What should the sales team do while the deal is in this stage?
Example for "Business Case Approved":
- Coordinate with buyer's procurement team
- Prepare contract and security questionnaire
- Schedule legal review kickoff
- Document stakeholder sign-offs
5. Success Metrics
Quantifiable performance indicators for this stage.
Example for "Business Case Approved":
- Conversion to next stage: 65%
- Average duration: 12 days
- Win rate from this stage: 55%
6. Probability Percentage
Likelihood of winning from this stage based on historical data.
Example: 50% (calibrated from historical win rates)
7. Rooting Days
Maximum time a deal should remain in this stage before flagging as stalled.
Example: 18 days (based on average + 1.5 standard deviations)
When you define stages this completely, everything gets clearer. Reps know what's required to advance deals. Managers can assess deal health objectively.
Setting Stage Probability: The Calibration Process
Assigning probability percentages isn't arbitrary. It's data-driven calibration.
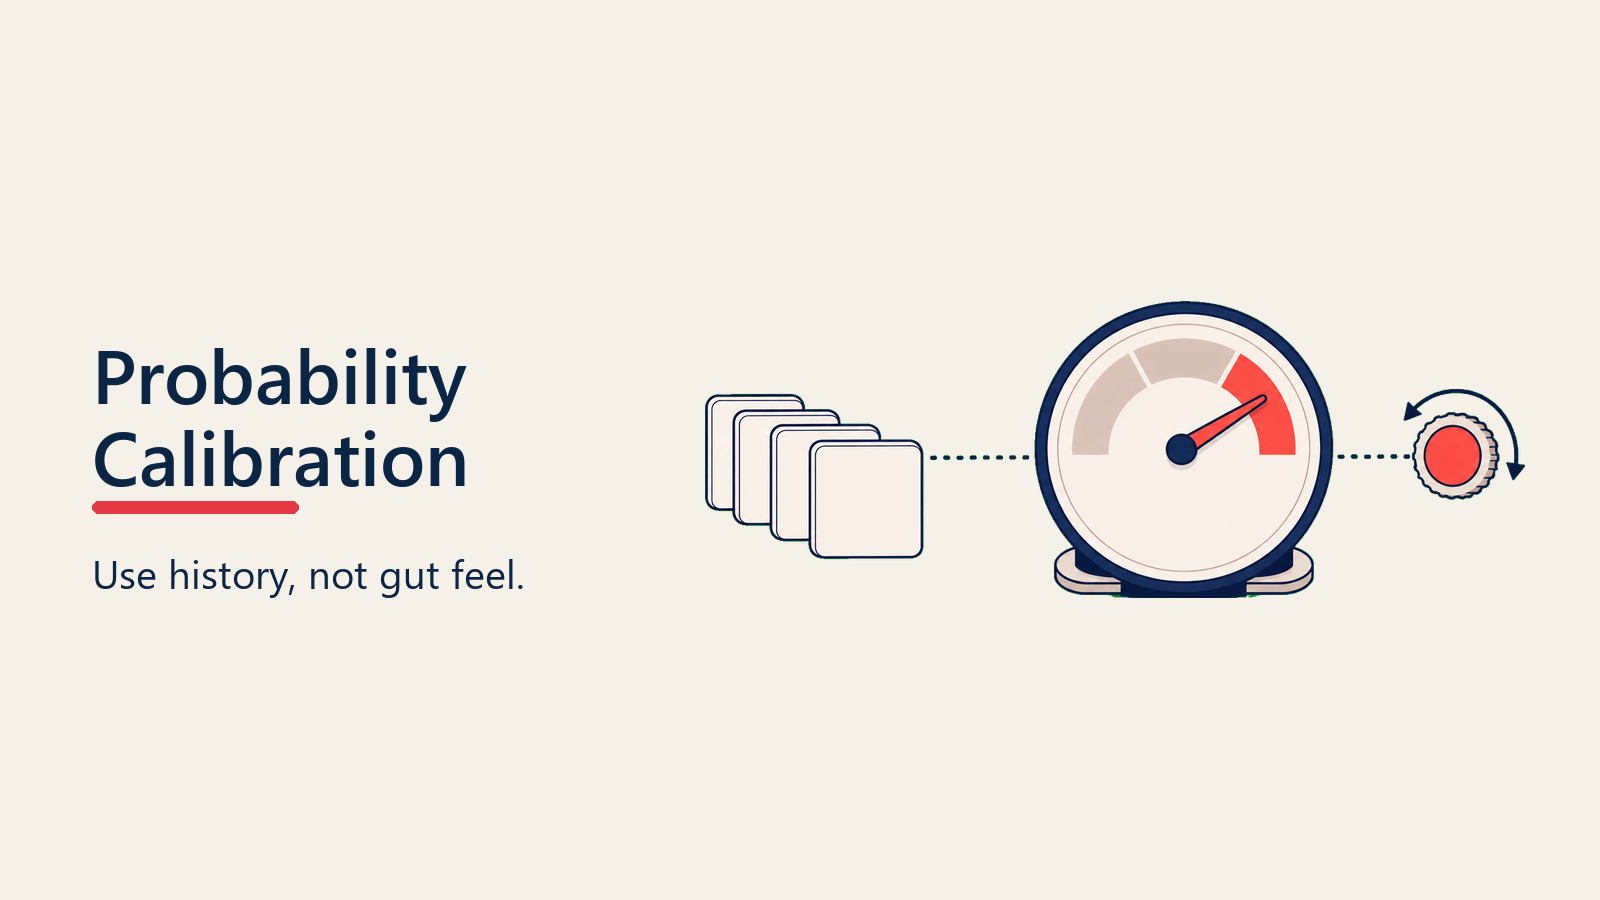
Step 1: Historical Win Rate Analysis
Pull your last 6-12 months of closed deals (won and lost). For each stage, calculate:
Stage Win Rate = (Deals Won from Stage) / (Total Deals that Reached Stage)
Example:
- 100 deals reached "Business Case Approved"
- 50 closed won
- Stage win rate: 50%
This becomes your baseline probability for that stage.
Step 2: Weighted Pipeline Implications
Probability determines weighted pipeline value. If you have $1M in "Business Case Approved" (50% probability), your weighted pipeline is $500K.
This weighted pipeline should roughly predict actual closed revenue when aggregated across all stages. If your weighted pipeline consistently runs 40% higher than actual closes, your probabilities are inflated.
Step 3: Calibration Over Time
Review quarterly:
- Compare weighted pipeline to actual closes
- Adjust probabilities if systematic variance exists
- Track conversion rates between stages to identify changes
Step 4: Common Probability Patterns
Most B2B pipelines follow these ranges:
- Early Stage (Qualified, Discovery): 10-30%
- Mid-Stage (Needs Analysis, Proposal): 40-60%
- Late Stage (Negotiation, Final Approval): 70-90%
- Closed Won: 100%
- Closed Lost: 0%
Don't make these linear (each stage +20%). Base them on actual win rates at each stage. You'll often see bigger jumps at validation milestones and smaller jumps during prolonged evaluation phases.
Rooting Days: Flagging Stagnant Deals
Rooting days define how long a deal can sit in a stage before triggering a stall alert.
Purpose
Identify deals that are stuck, forgotten, or unlikely to progress without intervention.
Setting Methodology
Calculate the average duration in each stage, then add 1-1.5 standard deviations to set the threshold.
Example:
- Average duration in "Proposal Review": 12 days
- Standard deviation: 4 days
- Rooting days: 12 + (1.5 × 4) = 18 days
After 18 days in "Proposal Review," the deal gets flagged for review.
Typical Ranges by Stage
Early Stages: 14-30 days (discovery, needs analysis) Mid Stages: 10-21 days (proposal, business case) Late Stages: 5-14 days (negotiation, final approval)
Later stages should have tighter rooting days because momentum matters. A deal sitting in "Final Approval" for 20 days is likely stalled, not just taking time.
Automation Triggers
When a deal exceeds rooting days:
- Notify the rep and manager
- Require updated close date or next step
- Flag in pipeline reviews
- Optionally, push deal back to earlier stage if progression evidence is missing
Rooting days keep your pipeline clean and stop sandbagged deals from messing up your forecasts. This is a critical component of deal aging management.
Stage Design Mistakes to Avoid
Even experienced ops teams make these errors:
Mistake 1: Too Many Stages
Symptom: 10+ stages with unclear distinctions Cost: Administrative burden, confusion, deals skipping stages Fix: Consolidate to 4-7 stages that represent meaningful buyer progression milestones
Mistake 2: Too Few Stages
Symptom: 2-3 stages for complex 120-day sales cycle Cost: No visibility into deal health, inability to identify bottlenecks Fix: Add stages at key validation points (technical approval, business case, procurement)
Mistake 3: Activity-Based Stages
Symptom: Stages like "Demo Scheduled," "Proposal Sent," "Follow-Up Call" Cost: False progression, inflated forecasts, no buyer validation Fix: Reframe around buyer outcomes: "Solution Validated," "Business Case Reviewed"
Mistake 4: Inconsistent Probability
Symptom: Two similar deals in same stage with wildly different probabilities Cost: Unreliable weighted pipeline, inconsistent forecasting Fix: Standardize probability by stage, calibrate to historical win rates
Mistake 5: No Exit Criteria
Symptom: Deals advance based on rep discretion or time elapsed Cost: Optimism bias, sandbagging, inaccurate forecasts Fix: Define objective exit criteria for every stage
Mistake 6: Linear Probability Progression
Symptom: Each stage increases by exactly 20% (20%, 40%, 60%, 80%) Cost: Doesn't reflect actual conversion dynamics Fix: Base probability on stage-specific historical win rates
Testing and Refinement: How to Actually Implement This
Don't roll out new stages company-wide on day one. Test first, then refine.
Phase 1: Pilot Period (30 days)
- Select 2-3 sales teams or segments
- Implement new stage definitions
- Train on entry/exit criteria
- Collect feedback on clarity and usability
Phase 2: Conversion Rate Analysis (60 days)
- Track conversion rates between stages
- Identify bottlenecks where deals stall
- Measure average duration in each stage
- Calculate win rates from each stage
Phase 3: Probability Calibration (90 days)
- Compare weighted pipeline to actual closes
- Adjust probabilities based on win rate data
- Test forecast accuracy with calibrated model
Phase 4: Iterative Adjustment (Ongoing)
- Quarterly reviews of stage metrics
- Refinement of entry/exit criteria based on team feedback
- Probability recalibration as sales motion evolves
Phase 5: Company-Wide Rollout
- Full training on stage definitions
- Integration with reporting and forecasting tools
- Clear documentation and playbooks
This iterative approach catches issues early and gets team buy-in before you force company-wide change.
Special Stages: Beyond the Linear Pipeline
Most pipelines need non-linear stages:
Closed Won (100%)
Purpose: Deals that converted to customers Requirements: Signed contract, payment terms confirmed, onboarding scheduled Tracking: Revenue amount, close date, sales cycle length
Closed Lost (0%)
Purpose: Deals that did not convert Critical Requirement: Loss reason categorization
- Budget constraints
- Timing not right
- Chose competitor
- No decision made
- Solution not a fit
Proper lost deal analysis drives product, pricing, and competitive positioning improvements.
On Hold / Postponed (Variable %)
Purpose: Deals with confirmed future interest but not actively progressing Usage: Buyer requested follow-up in Q3, budget freeze until next fiscal year Probability: Set to 10-20% to reflect uncertainty Automation: Schedule follow-up tasks, revisit in defined timeframe
Unqualified (0%)
Purpose: Leads that don't meet qualification criteria Usage: Wrong ICP, no budget, student researching, competitor intel gathering Benefit: Keeps pipeline clean, enables better lead quality analysis
These special stages ensure every deal has a home and prevent pipeline clutter.
Documentation Requirements: Making Stages Operational
Stage definitions don't help if they live in a spreadsheet only the ops team reads. Operationalize through:
1. Stage Definition Document
Complete reference with all seven components for every stage. Published in shared knowledge base.
2. Sales Playbooks
Stage-specific playbooks detailing:
- What to do when a deal enters this stage
- Key questions to ask
- Common objections and responses
- Resources and tools available
- Success patterns and red flags
3. Sales Enablement Training
Onboarding modules covering:
- Why stages are buyer-centric
- Entry and exit criteria for each stage
- How to use stages for accurate forecasting
- Examples of proper and improper stage usage
4. CRM Integration
- Stage dropdown in CRM matches definitions exactly
- Required fields enforce exit criteria
- Automation triggers based on stage changes
- Reports and dashboards by stage
5. Pipeline Review Templates
Manager 1:1 templates structured by stage:
- Deals in each stage
- Evidence supporting current stage
- Next steps to progress
- Risks and blockers
These templates form the foundation of effective pipeline reviews. Documentation turns your stage design from theory into something your team actually uses every day.
Conclusion: Stages as Revenue Architecture
Pipeline stages aren't cosmetic labels. They're the foundation of your entire revenue operations.
Well-designed stages, buyer-centric, MECE, observable, measurable, and actionable, give you accurate forecasting, efficient deal progression, and data-driven optimization.
Poorly designed stages, activity-based, vague, arbitrary, create false confidence, inflated pipelines, and missed targets.
The difference between companies that consistently hit revenue targets and those that constantly miss? How rigorous they are about their stages.
Get this right, and forecasting becomes predictable. Get it wrong, and you're flying blind.
Ready to build a rigorous stage framework? Explore how stage gate criteria enforce objective progression and deal progression management keeps deals moving efficiently.
Learn More

Senior Operations & Growth Strategist
On this page
- What Makes Pipeline Stages Fail?
- The Five Principles of Effective Stage Design
- 1. Buyer-Centric Progress (Not Seller Activity)
- 2. MECE: Mutually Exclusive and Collectively Exhaustive
- 3. Observable and Verifiable
- 4. Measurable Progression
- 5. Actionable Next Steps
- Common Stage Patterns by Sales Motion
- Simple B2B (4-5 Stages)
- Complex Enterprise (6-8 Stages)
- Product-Led Growth (3-4 Stages)
- Transactional/SMB (2-3 Stages)
- Stage Components: What Every Stage Needs
- 1. Stage Name
- 2. Entry Criteria
- 3. Exit Criteria
- 4. Key Activities
- 5. Success Metrics
- 6. Probability Percentage
- 7. Rooting Days
- Setting Stage Probability: The Calibration Process
- Step 1: Historical Win Rate Analysis
- Step 2: Weighted Pipeline Implications
- Step 3: Calibration Over Time
- Step 4: Common Probability Patterns
- Rooting Days: Flagging Stagnant Deals
- Purpose
- Setting Methodology
- Typical Ranges by Stage
- Automation Triggers
- Stage Design Mistakes to Avoid
- Mistake 1: Too Many Stages
- Mistake 2: Too Few Stages
- Mistake 3: Activity-Based Stages
- Mistake 4: Inconsistent Probability
- Mistake 5: No Exit Criteria
- Mistake 6: Linear Probability Progression
- Testing and Refinement: How to Actually Implement This
- Phase 1: Pilot Period (30 days)
- Phase 2: Conversion Rate Analysis (60 days)
- Phase 3: Probability Calibration (90 days)
- Phase 4: Iterative Adjustment (Ongoing)
- Phase 5: Company-Wide Rollout
- Special Stages: Beyond the Linear Pipeline
- Closed Won (100%)
- Closed Lost (0%)
- On Hold / Postponed (Variable %)
- Unqualified (0%)
- Documentation Requirements: Making Stages Operational
- 1. Stage Definition Document
- 2. Sales Playbooks
- 3. Sales Enablement Training
- 4. CRM Integration
- 5. Pipeline Review Templates
- Conclusion: Stages as Revenue Architecture
- Learn More