Revenue Predictability: Building Systematic, Consistent Revenue Generation
Turn this article into takeaways for your work.
Each assistant summarizes the article only for you and suggests best practices for your work.
Here's what separates growing companies from market leaders: predictability.
Not revenue. Not growth rate. Not even profitability. Predictability.
A company that consistently delivers what it forecasts, quarter after quarter, commands higher valuations, attracts better talent, and operates with strategic clarity that competitors can't match. Meanwhile, companies that miss forecasts by 15% one quarter and beat by 20% the next are viewed as risky, immature, and operationally unsound.
If you're a C-level executive or revenue leader, understanding revenue predictability isn't optional. It's the foundation of strategic planning, resource allocation, and investor confidence. The difference between companies that scale smoothly versus those that swing wildly between panic and euphoria? It comes down to how predictably they generate revenue.
What is Revenue Predictability?
Revenue predictability is the ability to consistently and accurately forecast revenue performance over defined time horizons, typically quarters and years. It's not about perfect forecasts (impossible) or conservative sandbagging (dishonest). It's about reliable accuracy within acceptable variance.
Predictability means:
- Forecasts consistently land within 5-10% of actuals
- Variances trend random rather than directional (not always high or always low)
- Confidence in predictions improves as you approach close date
- Performance patterns repeat across time periods
- Leading indicators reliably signal future outcomes
Here's the key insight: revenue predictability is an outcome of operational discipline, not a goal in itself. You can't mandate it. You build it through disciplined pipeline management, process consistency, and data integrity.
Predictability vs. Accuracy: Critical Distinction
Most executives conflate these concepts. They're different.
Accuracy measures how close a single forecast comes to actual results. Missing by 2% one quarter is accurate. Missing by 8% the next quarter is less accurate.
Predictability measures consistency of accuracy over time. If your forecasts consistently land within 5-8% of actuals, you're predictable even if you're not perfectly accurate.
Investors and boards value predictability over accuracy. A company that consistently delivers 92-95% of forecast is more valuable than one that delivers 105% one quarter and 85% the next, even if the average accuracy is the same.
Why? Because predictability enables planning. Unpredictability forces reactive management, conservative strategies, and contingency budgets that drain resources.
The Value of Predictability: Why It Matters More Than Growth
Revenue predictability drives disproportionate business value:
Higher Company Valuations
Public SaaS companies with consistent forecast accuracy trade at 20-30% higher revenue multiples than peers with volatile performance. Private companies with predictable revenue command premium valuations in M&A and funding rounds.
The reason: risk discount. Investors apply lower risk premiums to predictable businesses. If your revenue is a known quantity, you're worth more.
Strategic Resource Planning
Predictable revenue enables proactive resource allocation. When you know with confidence what Q3 will deliver, you can:
- Hire strategically rather than reactively
- Invest in product development with clear ROI timelines
- Expand into new markets with appropriate support
- Negotiate vendor contracts from strength rather than desperation
Unpredictable revenue forces conservative planning. You delay hiring. You defer investments. You miss market opportunities because you can't commit resources until deals close.
Reduced Organizational Stress
Companies with unpredictable revenue operate in perpetual crisis mode. Every week becomes a forecast fire drill. Leadership meetings devolve into explaining variance. Teams experience whiplash between "we're killing it" and "we need pipeline."
Predictable revenue creates operational calm. Teams focus on execution rather than explanation. Leadership focuses on strategy rather than firefighting. Stress shifts from survival to optimization.
Competitive Advantage
Predictability is a strategic weapon. While competitors scramble to understand their business, you're optimizing yours. While they're reactive, you're proactive. While they're guessing, you're planning.
Companies with predictable revenue make faster decisions, invest more confidently, and capture market opportunities that risk-averse competitors can't pursue.
Investor and Board Confidence
Nothing builds board confidence like consistent forecast accuracy. Predictable CEOs get more latitude. Predictable CFOs get more resources. Predictable CROs get strategic investment in revenue operations.
Unpredictable leaders get scrutinized, second-guessed, and eventually replaced.
Predictability Requirements: What It Takes
Revenue predictability requires consistent pipeline generation, stage discipline, forecast hygiene, and repeatable sales execution.
Revenue predictability isn't magic. It's operational discipline across five key areas:
1. Clean, Qualified Pipeline
Predictability starts with pipeline quality. Garbage in, garbage out.
A clean pipeline means:
- Every opportunity meets defined qualification criteria
- Progression through stages reflects actual buyer journey
- Close dates align with realistic buying timelines
- Deal amounts reflect validated budgets and scope
- Stakeholders and decision processes are documented
The moment you tolerate unqualified deals "just to keep pipeline up," you sacrifice predictability. You can't forecast what you can't trust.
2. Accurate Forecasting Methodology
Forecasting fundamentals matter. Your methodology should:
- Apply consistent stage-based probability
- Weight deal-specific risk factors
- Incorporate historical win rates by segment
- Adjust for seasonal patterns
- Account for sales rep track record
Ad hoc forecasting, "ask the reps what they think", delivers unpredictable results. Methodical forecasting, "apply proven techniques to qualified pipeline", delivers consistency.
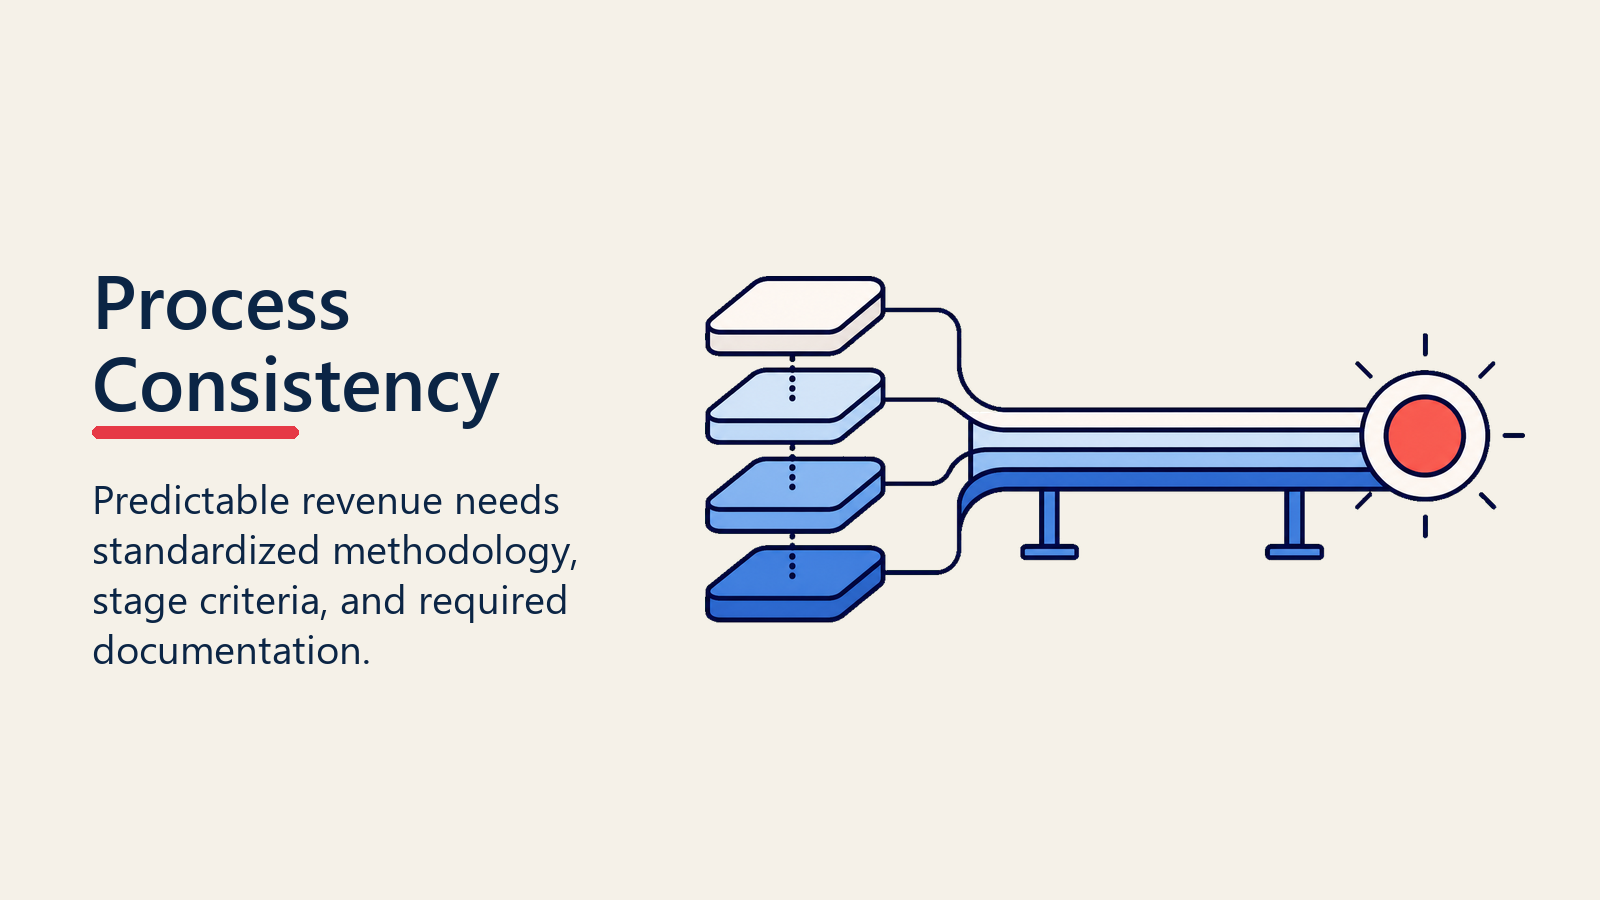
3. Consistent Execution
Process consistency drives predictable outcomes. This means:
- Standardized sales methodology applied to every deal
- Defined progression criteria for stage advancement
- Required actions and documentation at each stage
- Consistent qualification, discovery, and close processes
- Repeatable playbooks for common deal types
When every rep "does their own thing," you get unpredictable results. When every rep follows proven playbooks, you get predictable conversion patterns.
4. Reliable Metrics and Indicators
Pipeline metrics provide early warning signals. You need reliable tracking of:
- Pipeline coverage ratios by segment and time horizon
- Stage conversion rates and velocity
- Deal aging and risk indicators
- Activity levels and engagement patterns
- Leading indicators that precede revenue outcomes
Without reliable metrics, you're flying blind until deals close or don't. With them, you see predictability problems weeks before they impact results.
5. Disciplined Pipeline Hygiene
Predictability requires constant maintenance. This means:
- Weekly pipeline reviews that challenge deal validity
- Regular removal of stalled or dead opportunities
- Continuous updates to close dates and amounts
- Qualification re-checks as deals progress
- Ruthless focus on data accuracy
The moment pipeline hygiene slips, forecast accuracy decays. Predictability demands discipline.
Pipeline Health Indicators: What to Monitor
Certain metrics reliably predict revenue outcomes. Monitor these for early warning:
Coverage Ratios: The Foundation Metric
Pipeline coverage analysis reveals whether you have enough opportunity to hit targets. The math is simple:
Coverage Ratio = Pipeline Value / Revenue Target
But simple doesn't mean simplistic. Mature organizations track:
- Current quarter coverage: Should be 2-3x target (accounting for win rates)
- Next quarter coverage: Should be 3-4x target (lower probability deals)
- Coverage by segment: Enterprise, mid-market, and SMB require different ratios
- Coverage trend: Are ratios improving or degrading?
Falling coverage ratios 6-8 weeks before quarter end are the #1 predictor of missed forecasts. Rising coverage ratios with quality pipeline signal predictable achievement.
Conversion Rates: The Consistency Metric
Conversion rates between stages should be stable. If your historical conversion from qualified lead to opportunity is 25%, and this quarter it's 18%, something changed. Either qualification got looser, or market conditions shifted, or your process broke.
Track conversion rates:
- Stage to stage: Identify where deals stall or fall out
- By segment: Enterprise behaves differently than SMB
- By rep: Identify coaching opportunities or star performers
- Over time: Spot trends before they become crises
Stable conversion rates enable predictable math. If 25% of qualified leads become opportunities, and 40% of opportunities close, you know exactly how many leads you need to hit revenue targets.
Velocity Metrics: The Timing Indicator
Pipeline velocity predicts when deals close, not just if they close. Slow velocity means deals that should close this quarter push to next quarter.
Monitor:
- Days in stage: Are deals progressing normally?
- Total cycle time: Is it trending up or down?
- Velocity by deal size: Large deals take longer (obviously), but how much longer?
- Velocity variance: Consistent timing enables predictable revenue recognition
When velocity slows, revenue timing becomes unpredictable. Even if you eventually win the deals, they land in the wrong quarter.
Stage Distribution: The Shape Metric
Your pipeline should have a recognizable shape. Typically:
- More deals in early stages (qualification, discovery)
- Fewer deals in middle stages (proposal, negotiation)
- Smallest number in late stages (contracting, closed-won)
This "funnel shape" reflects natural attrition. If your pipeline is inverted (more deals in late stages than early), you have a generation problem. If it's cylindrical (equal amounts in all stages), you either have qualification issues or stage progression problems.
Healthy stage distribution signals sustainable revenue. Unhealthy distribution signals predictability problems ahead.
Age Profiles: The Risk Indicator
Old deals rarely close. Effective deal aging management requires tracking:
- Average deal age by stage: Deals shouldn't camp in stages indefinitely
- Percentage over expected age: Flag deals that exceed typical cycle times
- Age of largest deals: Big deals that are unusually old are risky bets
- Stalled deal identification: Define "stalled" (e.g. no activity for 14 days) and flag aggressively
Aged deals inflate pipeline and kill forecast accuracy. Regular age reviews force honest conversations about deal viability.
Process Consistency: Repeatable, Scalable, Trainable
Predictability requires processes that produce consistent outcomes regardless of who executes them.
Why Process Matters for Predictability
Talented individual contributors produce unpredictable results. They might have a great month or a terrible quarter. They might close huge deals through personal relationships or lose winnable deals through missed steps.
Process-driven organizations produce predictable results. New reps follow proven playbooks and achieve expected outcomes. Experienced reps apply refinements within defined frameworks. Everyone speaks the same language about deal stages, qualification, and forecasting.
Three Elements of Process Consistency
1. Standardized Methodology
Your sales methodology should define:
- How to qualify opportunities (BANT, MEDDIC, SPICED, or custom framework)
- What constitutes progression to each stage
- Required discovery questions and documentation
- Proposal and negotiation best practices
- Close procedures and handoff protocols
When everyone follows the same methodology, conversion rates stabilize and become predictable.
2. Defined Stage Criteria
Don't let reps arbitrarily move deals through stages. Define objective stage gate criteria:
- Stage 1: Qualification - Budget confirmed, authority identified, need validated, timeline established
- Stage 2: Discovery - Pain points documented, current state assessed, desired future state defined
- Stage 3: Solution Design - Technical requirements gathered, stakeholders aligned, success criteria established
- Stage 4: Proposal - Formal proposal presented, pricing reviewed, ROI justified
- Stage 5: Negotiation - Contract terms discussed, legal review initiated, approvals in process
- Stage 6: Closed-Won - Contract signed, payment secured, implementation scheduled
Clear criteria eliminate subjective stage progression and improve forecast accuracy.
3. Required Documentation
Mandate documentation at key stages:
- Qualification notes and BANT/MEDDIC scores
- Discovery call summaries and pain point documentation
- Proposal presentations and stakeholder feedback
- Negotiation terms and outstanding objections
- Close plan with key dates and dependencies
Documentation forces discipline. Reps who can't document key deal elements probably don't understand the deal.
Data Integrity: Quality Inputs Drive Predictable Outputs
Your forecast is only as good as your data. Garbage data creates unpredictable forecasts.
Critical Data Quality Standards
Opportunity Fields Must Be Current
- Close dates reflect realistic buyer timelines, not wishful thinking or quarter-end defaults
- Deal amounts match validated budgets and scoped solutions
- Probability/stage align with actual deal progression
- Next steps are specific actions with owners and dates
- Last activity date is recent (no zombie deals)
Account Data Must Be Complete
- Industry, size, and segment classification
- Key stakeholders and decision-makers
- Buying process and approval requirements
- Current vendor relationships
- Strategic importance and risk factors
Activity Tracking Must Be Accurate
- All customer interactions logged
- Meeting notes and outcomes captured
- Email engagement tracked
- Document sharing and consumption recorded
- Stakeholder engagement mapped
Data Quality Enforcement
Predictability requires consistent data quality discipline:
Daily: Reps update deal fields after every customer interaction Weekly: Managers review pipeline data quality in 1-on-1s Monthly: Operations audits data completeness and accuracy Quarterly: Leadership reviews data integrity metrics and trends
Consider implementing data quality gates: prevent deals from advancing to proposal stage without complete discovery documentation. Block forecasting of deals with close dates beyond 90 days. Require manager approval for large deals that haven't had recent activity.
Leading vs Lagging Indicators: Early Warning Systems
Predictability depends on monitoring the right metrics at the right time.
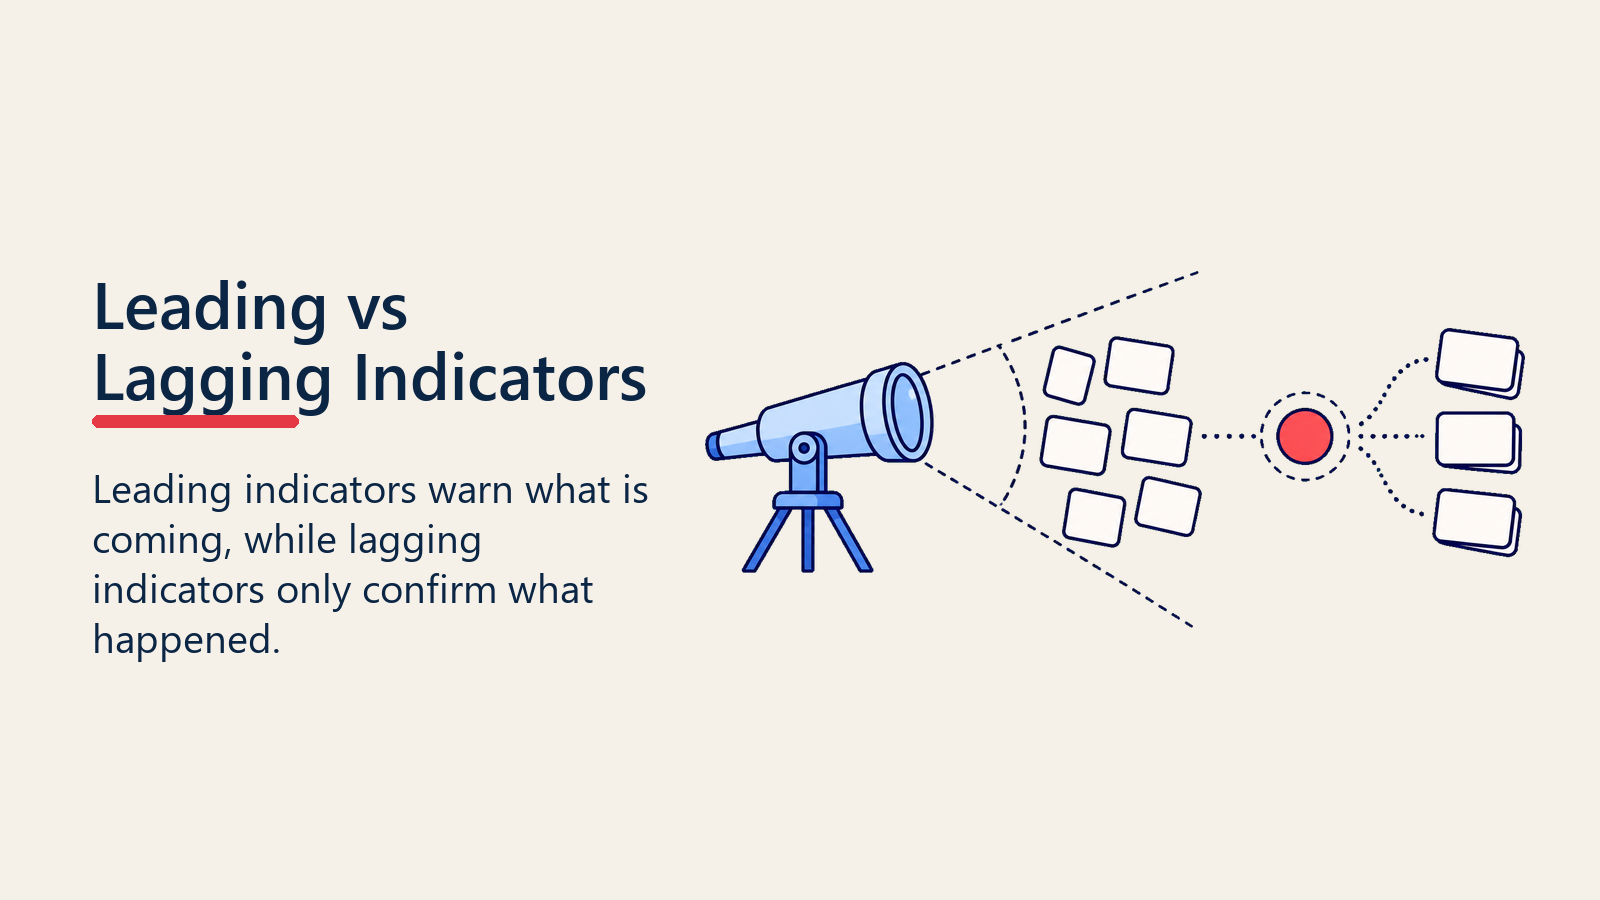
Lagging Indicators: What Happened
Lagging indicators measure outcomes:
- Revenue attainment vs. target
- Deals closed vs. forecast
- Win rates and average deal size
- Quarterly growth trends
Lagging indicators tell you whether you hit targets. They're essential for performance measurement but useless for predictive management. By the time lagging indicators show problems, it's too late to fix them.
Leading Indicators: What's Coming
Leading indicators predict future outcomes:
Pipeline Generation Metrics
- Marketing qualified leads (MQLs) and sales accepted leads (SALs)
- Discovery call volume and quality
- New opportunity creation rate
- Pipeline addition by source and segment
If lead generation drops 30% in month one, you'll see opportunity creation drop in month two and closed deals drop in month four. Leading indicators give you time to respond.
Pipeline Quality Metrics
- Forecast accuracy trends over prior quarters
- Pipeline coverage ratios trending over prior periods
- Average deal size and mix shifts
- Disqualification rates and reasons
If deal sizes are shrinking or disqualification rates are rising, predictability suffers. Catch these trends early.
Engagement Metrics
- Response rates to outreach
- Meeting set rates and show rates
- Stakeholder engagement levels
- Champion strength and executive access
Declining engagement metrics predict lower conversion rates and longer cycles. These signals appear weeks before deals stall.
Activity Metrics
- Outbound activity levels by rep
- Meetings held vs. target
- Proposals delivered vs. goal
- Pipeline review completion rates
Low activity predicts low results. If reps aren't doing the work, outcomes become unpredictable.
Building Your Early Warning System
Effective leading indicator monitoring requires:
- Clear Definitions - Everyone understands what each metric means
- Consistent Tracking - Metrics measured the same way every time
- Thresholds and Alerts - Define what "normal" looks like and flag deviations
- Root Cause Analysis - When indicators trend negative, investigate why
- Action Plans - Indicators without action plans are just interesting data
The goal is to spot predictability risks 6-8 weeks before they impact results, giving you time to course-correct.
Predictability by Segment: Different Motions, Different Patterns
Revenue doesn't behave uniformly. Different segments have different predictability profiles.
Enterprise Segment
Characteristics:
- Long, complex sales cycles (6-18 months)
- Multiple stakeholders and approval layers
- Large deal sizes with lumpy timing
- High win rates but slow velocity
Predictability Challenges:
- Individual deals significantly impact forecasts
- Close date slippage is common and hard to predict
- Legal and procurement add uncertainty
- Budget cycles and fiscal years drive timing
Predictability Strategies:
- Track pipeline coverage 3-4 quarters out
- Monitor stakeholder engagement and champion strength
- Red-flag deals without executive access or legal engagement
- Model scenarios with and without largest deals
- Build quarterly "must-win" deal lists with focused support
Mid-Market Segment
Characteristics:
- Moderate sales cycles (3-6 months)
- Defined but not complex buying process
- Meaningful deal sizes without extreme lumpiness
- Balanced win rates and velocity
Predictability Advantages:
- Volume smooths out individual deal variance
- Patterns emerge more clearly
- Conversion rates stabilize faster
- Resource allocation is more flexible
Predictability Strategies:
- Focus on stage conversion rates and velocity
- Maintain 2-3x coverage ratios
- Identify and replicate high-performing patterns through win rate improvement
- Use historical data to refine forecasting models
SMB/Transactional Segment
Characteristics:
- Short sales cycles (days to weeks)
- Simple buying process (often single decision-maker)
- Small deal sizes but high volume
- Predictable patterns with statistical reliability
Predictability Advantages:
- Volume creates statistical predictability
- Patterns are clear and repeatable
- Variance is low relative to segment revenue
- Process improvements show rapid impact
Predictability Strategies:
- Monitor lead flow and conversion rates daily/weekly
- Optimize for velocity and consistency
- Use historical conversion math for forecasting
- Identify and eliminate friction points in process
The Blended Portfolio Challenge
Most companies operate across multiple segments. This creates complexity:
- Each segment contributes different percentages of revenue
- Segments have different cycle times and predictability profiles
- A miss in enterprise is harder to recover than a miss in SMB
- Resource allocation must balance segment needs
Portfolio Predictability Approach:
- Forecast each segment separately with appropriate methodology
- Weight segment forecasts by reliability (SMB is more reliable than enterprise)
- Model scenario ranges that account for segment variance
- Maintain balanced pipeline across segments to smooth revenue
From Reactive to Predictive: The Maturity Journey
Revenue predictability evolves through predictable stages. Most companies progress from chaos to sophistication over 2-3 years of focused effort.
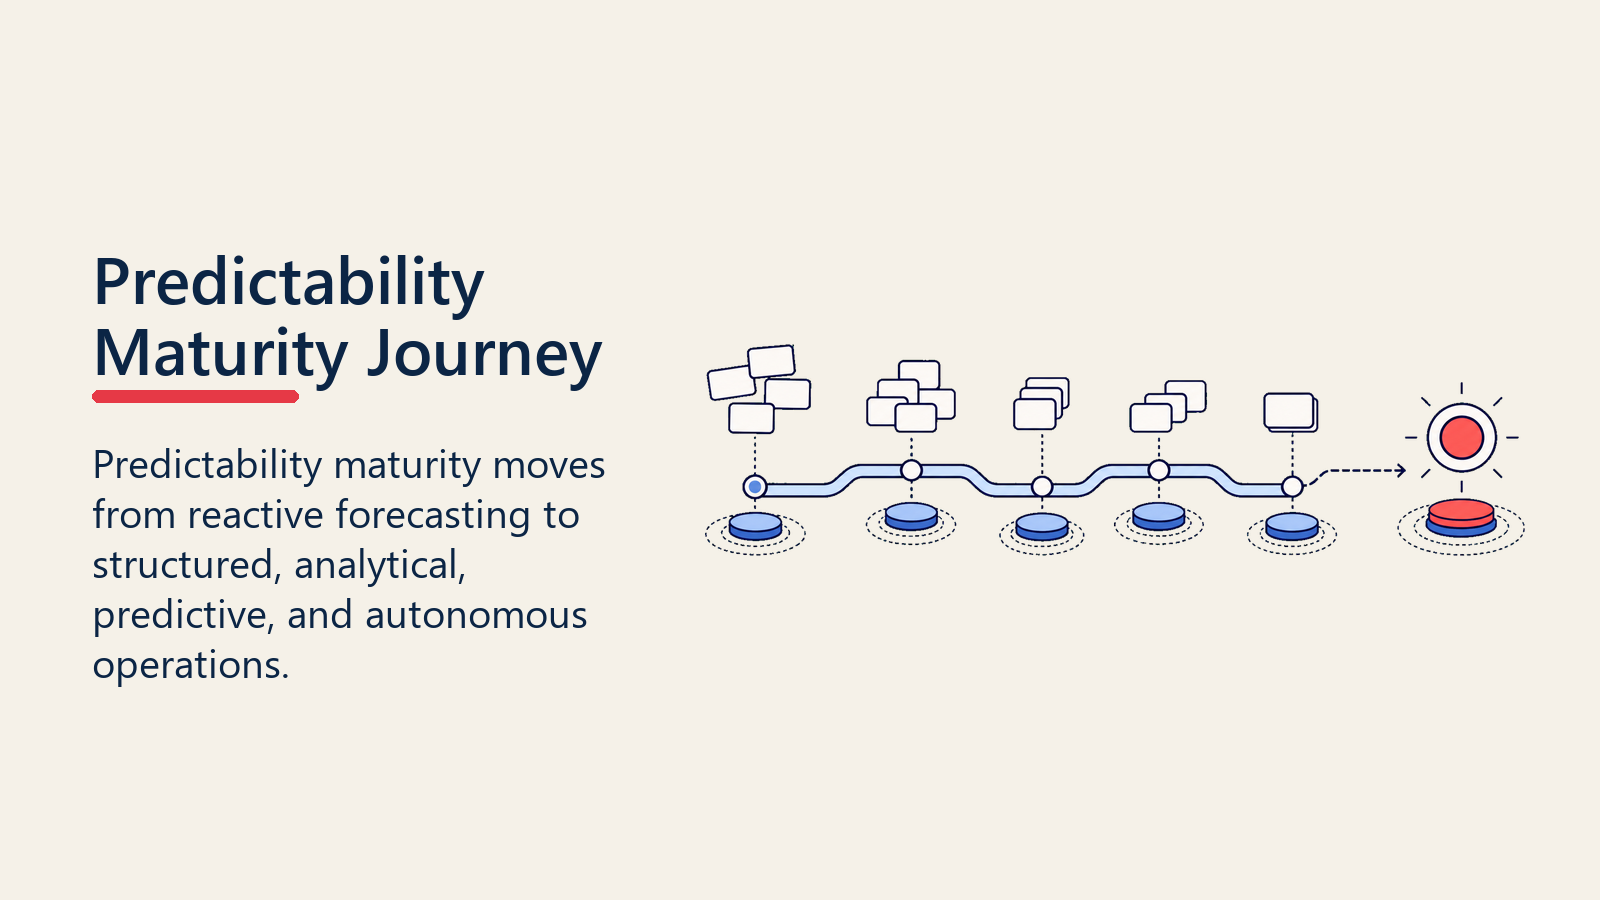
Stage 1: Reactive Forecasting (Chaos)
Characteristics:
- Forecasts based on "gut feel" and rep optimism
- Pipeline data is incomplete or inaccurate
- No systematic methodology or criteria
- Frequent surprises (positive and negative)
- Variance routinely exceeds 20-30%
Predictability Level: Non-existent. You're guessing.
Priority Actions:
- Implement basic CRM hygiene requirements
- Define qualification criteria and stage definitions
- Start tracking basic metrics (coverage, conversion, velocity)
- Establish weekly pipeline review cadence
Stage 2: Structured Forecasting (Foundation)
Characteristics:
- Stage-based probability forecasting adopted
- Pipeline reviews happen on schedule
- Basic data quality standards enforced
- Metrics tracked but not deeply analyzed
- Variance typically 15-20%
Predictability Level: Emerging. You have data but limited insight.
Priority Actions:
- Standardize sales methodology and process
- Implement required documentation at key stages
- Build historical baseline for conversion and velocity
- Train team on forecasting discipline and accuracy
Stage 3: Analytical Forecasting (Operational)
Characteristics:
- Multiple forecasting methods applied (stage-based, historical, rep input)
- Variance analysis drives improvement
- Leading indicators monitored proactively
- Process consistency enforced
- Variance typically 8-12%
Predictability Level: Reliable. You forecast with confidence.
Priority Actions:
- Refine forecasting models with segment-specific variables
- Implement data quality automation and alerts
- Build predictive analytics for risk identification
- Create scenario modeling capabilities
Stage 4: Predictive Forecasting (Optimization)
Characteristics:
- AI/ML models enhance human judgment
- Real-time visibility into pipeline health
- Proactive identification of at-risk deals
- Process optimization ongoing
- Variance consistently 5-8%
Predictability Level: Advanced. You're optimizing a reliable system.
Priority Actions:
- Implement predictive deal scoring and risk analysis
- Build dynamic territory and resource optimization
- Create integrated leading indicator dashboards
- Develop prescriptive recommendations for pipeline gaps
Stage 5: Autonomous Forecasting (Strategic)
Characteristics:
- Automated forecasting with continuous learning
- Predictive resource allocation and capacity planning
- Strategic market planning enabled by revenue certainty
- Variance consistently 3-5%
Predictability Level: World-class. Revenue is a known quantity.
Key Capabilities:
- AI-driven opportunity prioritization and resource allocation
- Automated risk identification and mitigation recommendations
- Integrated financial planning based on reliable revenue projections
- Competitive advantage through operational superiority
The Journey Takes Time
Don't expect to jump from Stage 1 to Stage 4. Each stage requires 6-12 months of sustained focus:
- Building the processes and discipline
- Training the team and changing behaviors
- Collecting data and establishing baselines
- Refining approaches based on results
The companies that achieve world-class predictability treat it as a multi-year strategic initiative, not a quarterly project.
Predictability Assessment Framework
Assess your current state with these diagnostic questions:
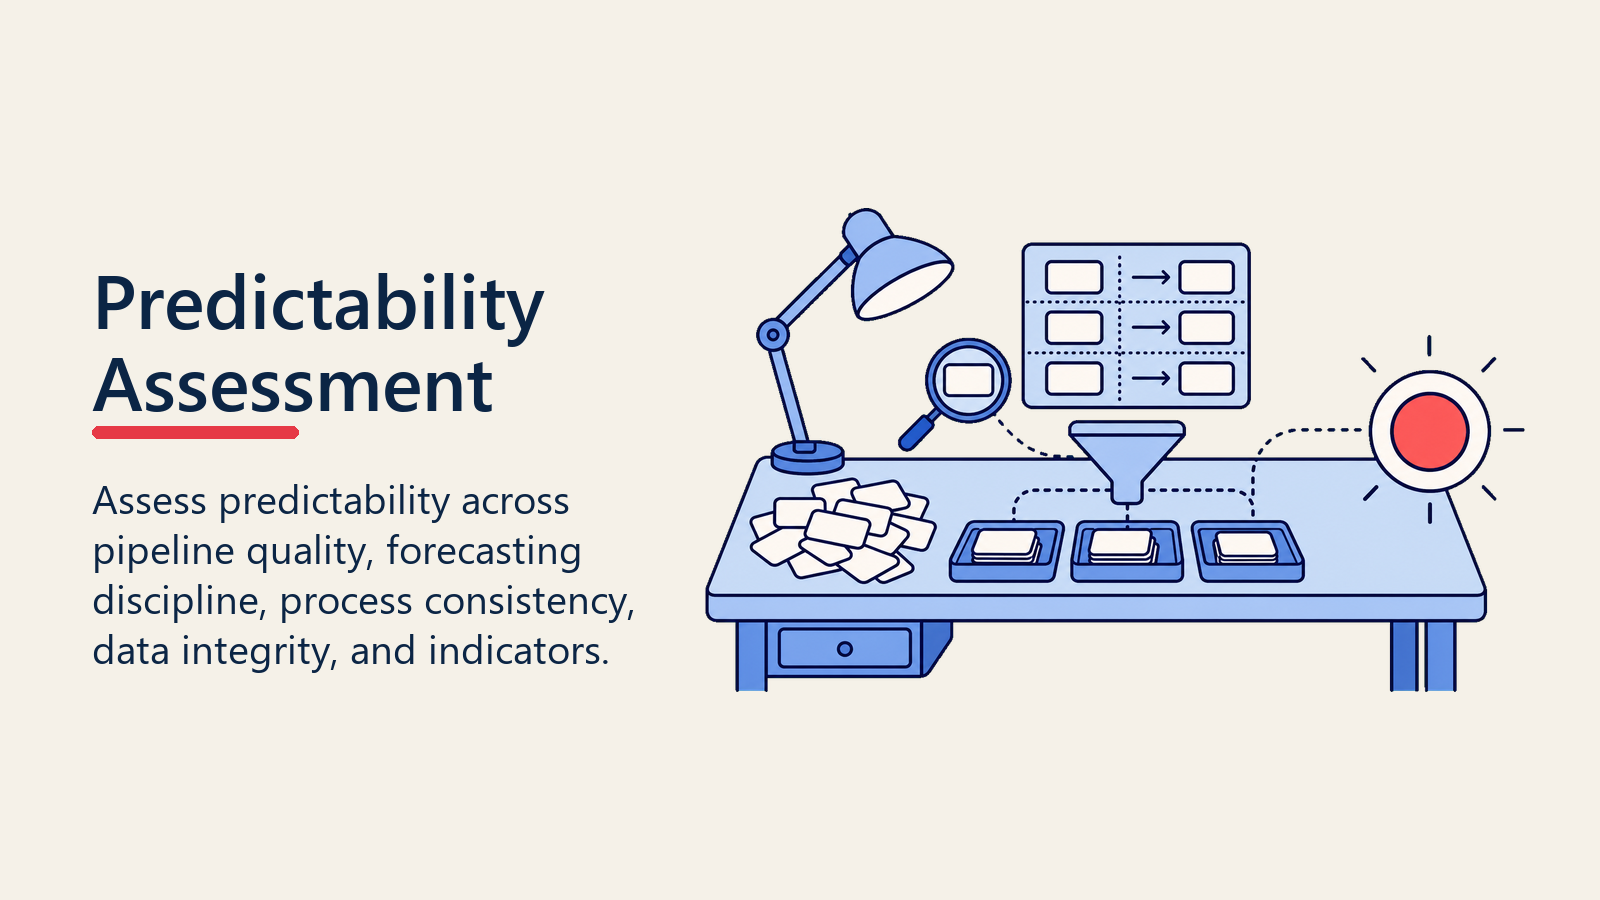
Pipeline Quality
- What percentage of your pipeline meets defined qualification criteria?
- How often do deals move backward through stages?
- What's your pipeline close rate by stage?
- How accurate are close dates on deals 30-60 days out?
Forecasting Discipline
- What's your forecast variance over the past four quarters?
- Do you use multiple forecasting methodologies or rely on one approach?
- How often does your forecast change week-over-week in the final 30 days?
- Can you trace forecast variance to specific deals or systematic issues?
Process Consistency
- Do all reps follow the same sales methodology?
- Are stage progression criteria clearly defined and enforced?
- What percentage of deals have complete documentation at each stage?
- How consistently are pipeline reviews conducted?
Data Integrity
- What percentage of opportunities have been updated in the past 7 days?
- How complete is your account and contact data?
- Are close dates realistic or systematically pushed?
- Do you have automated data quality checks and alerts?
Leading Indicator Monitoring
- Do you track pipeline coverage 2-3 quarters out?
- Are conversion rates and velocity trended over time?
- Do you have defined thresholds for metric alerts?
- How quickly do you identify and respond to leading indicator changes?
Honest answers reveal your predictability gaps and priorities.
Building Your Predictability Roadmap
Improving revenue predictability requires a systematic approach:
Quarter 1: Foundation
Goal: Establish basic infrastructure and discipline
- Define qualification criteria and stage definitions
- Implement mandatory CRM hygiene standards
- Launch weekly pipeline review cadence
- Begin tracking core metrics (coverage, conversion, velocity)
- Train team on forecasting methodology
Quarter 2: Consistency
Goal: Drive process adoption and data quality
- Standardize sales methodology and playbooks
- Implement required documentation at stage gates
- Build historical baseline for metrics
- Establish data quality monitoring and alerts
- Refine forecast methodology based on Quarter 1 variance
Quarter 3: Analysis
Goal: Leverage data for insight and improvement
- Analyze variance patterns and root causes
- Implement segment-specific forecasting models
- Build leading indicator dashboards
- Create scenario modeling capabilities
- Begin predictive risk identification
Quarter 4: Optimization
Goal: Continuous improvement and team enablement
- Refine processes based on data insights
- Implement advanced forecasting techniques
- Build automated alerts and recommendations
- Share best practices across team
- Plan next year's predictability initiatives
The Success Factor That Matters Most
Technology and methodology matter, but cultural discipline determines success. The most sophisticated forecasting models fail if:
- Reps don't maintain data quality
- Managers don't enforce process consistency
- Leaders tolerate sandbagging or hockey sticks
- Pipeline reviews are performative rather than substantive
Predictability requires a culture of honesty, transparency, and accountability. You can't achieve predictable revenue while tolerating unpredictable behaviors.
Conclusion: Predictability as Competitive Advantage
Revenue predictability isn't a nice-to-have. It's the foundation of strategic execution, resource optimization, and competitive advantage.
Companies with predictable revenue operate from strength. They plan proactively, invest confidently, and capture market opportunities that risk-averse competitors can't pursue. They command premium valuations, attract top talent, and build sustainable growth engines.
Companies with unpredictable revenue operate reactively. They delay decisions, hoard cash, and miss opportunities. They're viewed as risky investments, struggle to attract talent, and fight constant fires.
The path to predictability isn't mysterious. It requires:
- Clean, qualified pipeline
- Methodical forecasting approach
- Process consistency and discipline
- Rigorous data quality
- Leading indicator monitoring
- Continuous improvement
Most importantly, it requires commitment. Predictability is a multi-quarter journey that demands sustained focus, cultural change, and operational discipline.
The question isn't whether predictability matters. It's whether you're willing to build it.
Ready to build systematic revenue predictability? Start with forecasting fundamentals and pipeline metrics to establish your foundation.
Go deeper:
- Forecast Accuracy: The Discipline of Reliable Revenue Projections
- Pipeline Coverage Analysis: Ensuring Sufficient Opportunity
- Pipeline Velocity: Accelerating Deals Through Your Sales Process
- Stage Gate Criteria: Defining Clear Progression Standards
- Pipeline Bottleneck Analysis: Identifying and Resolving Slowdowns

Senior Operations & Growth Strategist
On this page
- What is Revenue Predictability?
- Predictability vs. Accuracy: Critical Distinction
- The Value of Predictability: Why It Matters More Than Growth
- Higher Company Valuations
- Strategic Resource Planning
- Reduced Organizational Stress
- Competitive Advantage
- Investor and Board Confidence
- Predictability Requirements: What It Takes
- 1. Clean, Qualified Pipeline
- 2. Accurate Forecasting Methodology
- 3. Consistent Execution
- 4. Reliable Metrics and Indicators
- 5. Disciplined Pipeline Hygiene
- Pipeline Health Indicators: What to Monitor
- Coverage Ratios: The Foundation Metric
- Conversion Rates: The Consistency Metric
- Velocity Metrics: The Timing Indicator
- Stage Distribution: The Shape Metric
- Age Profiles: The Risk Indicator
- Process Consistency: Repeatable, Scalable, Trainable
- Why Process Matters for Predictability
- Three Elements of Process Consistency
- Data Integrity: Quality Inputs Drive Predictable Outputs
- Critical Data Quality Standards
- Data Quality Enforcement
- Leading vs Lagging Indicators: Early Warning Systems
- Lagging Indicators: What Happened
- Leading Indicators: What's Coming
- Building Your Early Warning System
- Predictability by Segment: Different Motions, Different Patterns
- Enterprise Segment
- Mid-Market Segment
- SMB/Transactional Segment
- The Blended Portfolio Challenge
- From Reactive to Predictive: The Maturity Journey
- Stage 1: Reactive Forecasting (Chaos)
- Stage 2: Structured Forecasting (Foundation)
- Stage 3: Analytical Forecasting (Operational)
- Stage 4: Predictive Forecasting (Optimization)
- Stage 5: Autonomous Forecasting (Strategic)
- The Journey Takes Time
- Predictability Assessment Framework
- Building Your Predictability Roadmap
- Quarter 1: Foundation
- Quarter 2: Consistency
- Quarter 3: Analysis
- Quarter 4: Optimization
- The Success Factor That Matters Most
- Conclusion: Predictability as Competitive Advantage