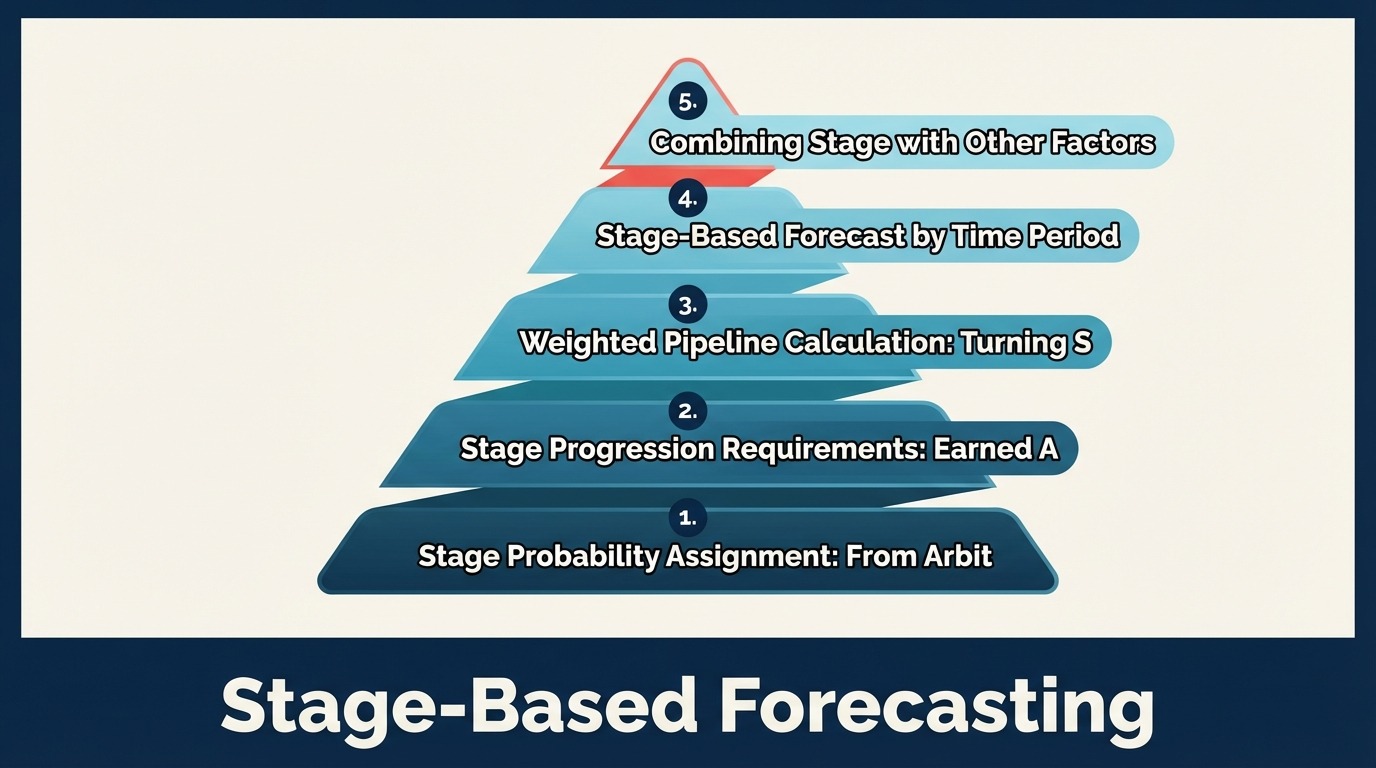
Stage-Based Forecasting: Using Pipeline Stages to Predict Revenue
Turn this article into takeaways for your work.
Each assistant summarizes the article only for you and suggests best practices for your work.
What separates accurate forecasters from those constantly explaining forecast misses? They anchor predictions to objective deal progression, not gut feeling.
The most reliable predictor of whether a deal will close isn't what your rep thinks, how enthusiastic the prospect seems, or how long it's been in the pipeline. It's which stage the deal has reached, based on verifiable buyer actions. Understanding the fundamentals of forecasting starts with this insight.
Stage-based forecasting treats pipeline stages as probability proxies. A deal in "Discovery" has a 20% close probability. Move it to "Proposal Submitted" and that jumps to 60%. Advance to "Negotiation" and you're at 80%. Not because these numbers feel right, but because historical data proves deals at these stages close at these rates.
If you're building forecast discipline in your organization, stage-based methodology is where to start. It's objective, auditable, and improvable.
Why Stage Progression is the Best Leading Indicator
Most forecasting approaches fail because they rely on lagging indicators (deal age, amount) or subjective inputs (rep confidence ratings). Stage progression is different. It measures something concrete: has the buyer taken the next step?
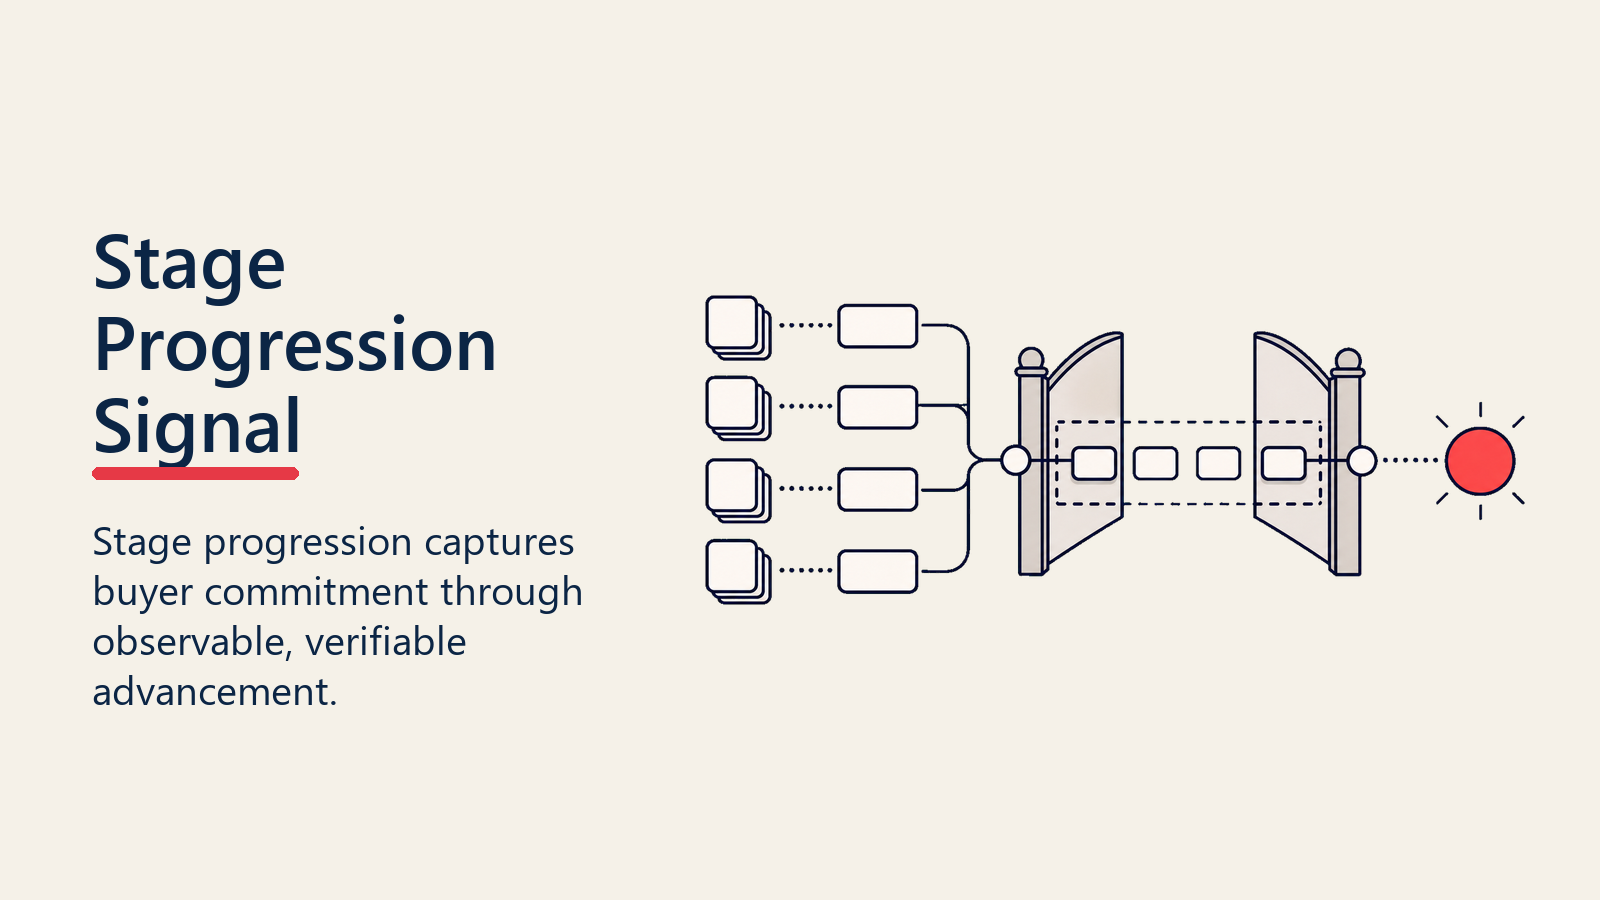
Stage progression captures buyer commitment. Moving from "Initial Contact" to "Needs Analysis" means the prospect agreed to a discovery call. Progressing to "Proposal" means they've shared requirements and evaluation criteria. Each stage transition represents buyer validation, not seller hope.
Stage advancement is observable. You can verify whether a proposal was submitted, whether technical validation occurred, whether legal review started. Unlike "rep confidence" scores, stage transitions are falsifiable. You either have evidence or you don't.
Stage data compounds over time. Every closed deal adds a data point: which stages did it pass through, how long in each stage, what probability should we assign next time? After analyzing hundreds of deals, your stage probabilities become statistically validated predictions.
This is why good revenue operations teams obsess over stage definitions and stage discipline. When stages accurately reflect buyer progression, forecasts become predictable. When stages are mushy or skipped, forecasts are fiction. Proper pipeline stages design is foundational to this process.
What is Stage-Based Forecasting?
Stage-based forecasting is a methodology that assigns close probability to deals based on their current pipeline stage, then calculates weighted pipeline value by multiplying deal amount × stage probability.
The core equation:
Weighted Pipeline Value = Deal Amount × Stage Probability
For a $100K deal in "Proposal Submitted" stage with 60% probability:
Weighted Value = $100,000 × 0.60 = $60,000
Sum these weighted values across all deals to predict total revenue by time period. That's your forecast.
Simple concept. But execution requires:
- Accurately defined stages that reflect real buyer progression
- Data-driven probability assignments, not arbitrary percentages
- Stage discipline so deals only advance with earned progression
- Weighted calculations across time horizons (this quarter, next quarter, etc.)
- Continuous validation comparing forecasts to actual outcomes
Done right, stage-based forecasting provides visibility into future revenue with accuracy rates of 85-95% for current quarter, 70-80% for next quarter.
Done wrong, with lazy stage definitions, arbitrary probabilities, and stage-skipping, it's no better than guessing. Learn how conversion rate analysis can help validate your stage probabilities.
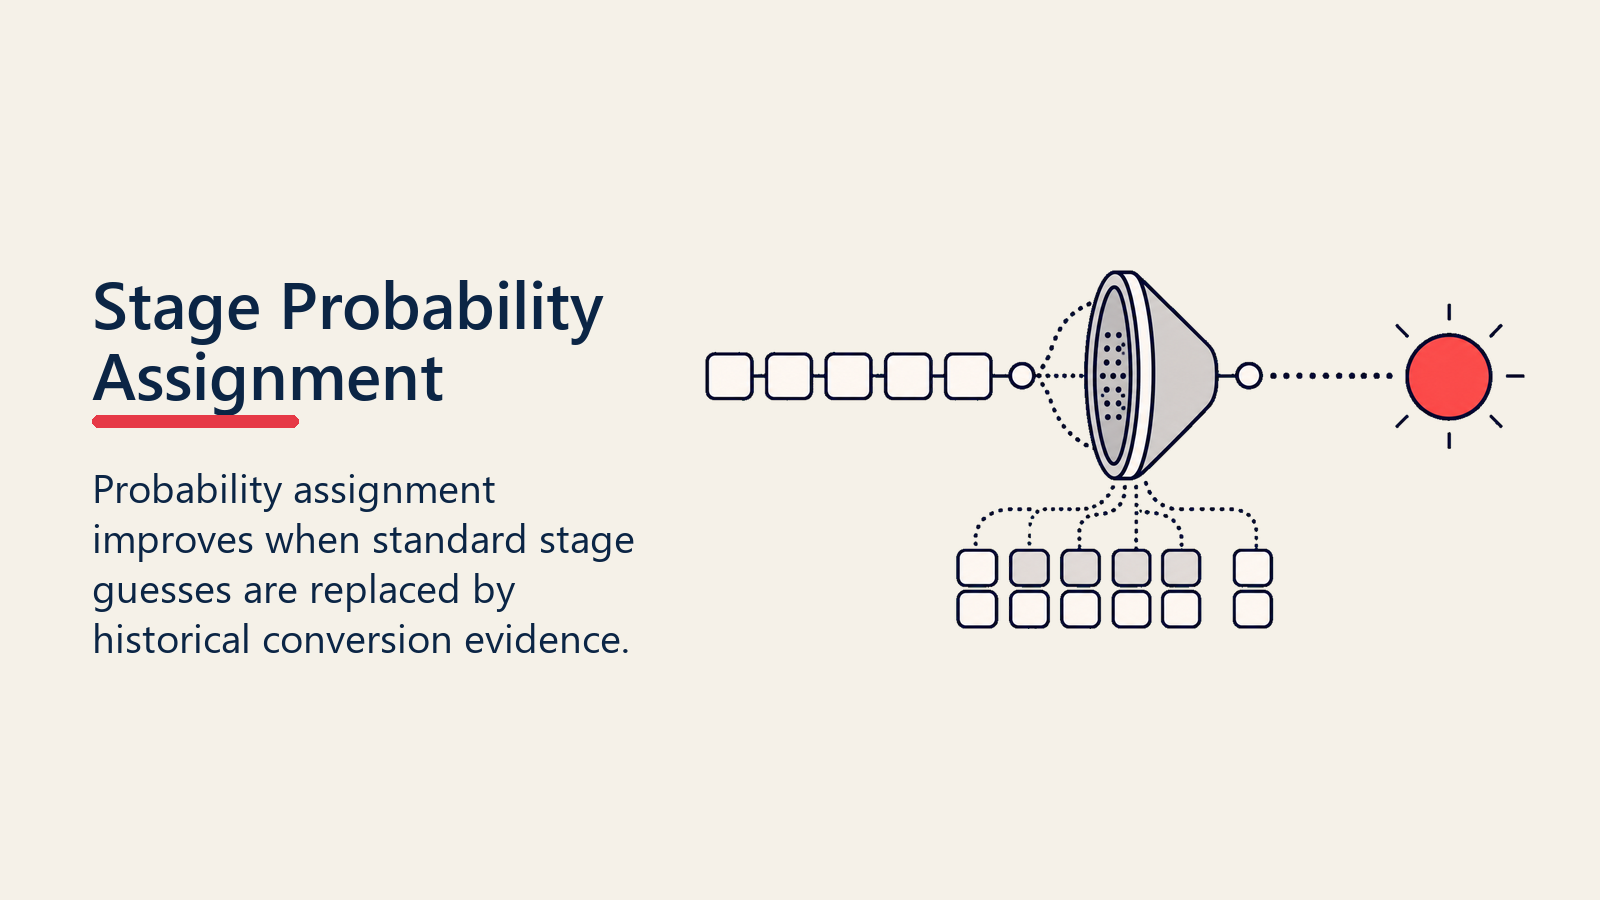
Stage Probability Assignment: From Arbitrary to Data-Driven
Most teams start with gut-feel probabilities: "Discovery feels like 20%, Proposal feels like 50%, Negotiation feels like 75%." That's better than nothing, but not by much.
The evolution looks like this:
Standard Stage Probabilities (Starting Point)
Common baseline probabilities many teams use:
| Stage | Standard Probability |
|---|---|
| Lead/Inquiry | 5% |
| Qualification | 10% |
| Discovery/Needs Analysis | 20% |
| Solution Presentation | 40% |
| Proposal Submitted | 60% |
| Negotiation | 80% |
| Verbal Agreement | 90% |
| Closed Won | 100% |
These work as a starting framework, but they're generic. Your business has different sales cycles, buyer behaviors, and conversion patterns. Standard probabilities get you operational quickly; historical analysis makes you accurate.
Historical Conversion-Based Probabilities (Data-Driven)
After 6-12 months of closed deals, analyze actual conversion rates by stage:
Step 1: Calculate stage-to-close conversion rates
- How many deals reached "Discovery" stage? (Example: 500)
- How many of those closed-won? (Example: 100)
- Conversion rate = 100 / 500 = 20%
Step 2: Segment by deal characteristics Not all deals convert equally. Enterprise deals may convert at 15% from Discovery while SMB converts at 30%. Inbound deals may have 25% conversion while outbound prospecting converts at 10%.
Segment your historical analysis by:
- Deal size (SMB, Mid-Market, Enterprise)
- Source (Inbound, Outbound, Partner, Expansion)
- Product line
- Industry vertical
Step 3: Assign probabilities based on segment-specific conversion
Instead of one "Discovery = 20%" rule, you might have:
- Discovery (Inbound, Enterprise) = 25%
- Discovery (Outbound, Enterprise) = 12%
- Discovery (Inbound, SMB) = 35%
This segmentation dramatically improves forecast accuracy because it reflects how different deal types actually behave. Consider how pipeline segmentation can inform your probability assignments.
Industry Benchmarks (Calibration Check)
Use industry benchmarks to validate your probabilities aren't wildly off. SaaS businesses typically see:
- Qualification to close: 15-25%
- Demo/Discovery to close: 20-30%
- Proposal to close: 50-70%
- Negotiation to close: 75-85%
If your data shows dramatically different patterns (e.g. Proposal stage converting at 25%), investigate why. Either your stages are poorly defined, deals are advancing prematurely, or your market has genuinely different dynamics.
Custom Probability Models (Advanced)
Sophisticated forecasting teams build multi-variable models where stage is the primary factor but not the only one:
Deal Probability = Base Stage Probability × Age Factor × Engagement Score × Deal Health Score
For example:
- Base stage probability (Proposal): 60%
- Age factor (30 days in stage, optimal window): 1.0
- Engagement score (high buyer activity): 1.1
- Deal health score (competitive threat detected): 0.9
Combined probability: 0.60 × 1.0 × 1.1 × 0.9 = 59.4%
This approach captures nuance while keeping stage as the anchor. It prevents over-reliance on subjective "deal health" scores while acknowledging that context matters.
Stage Progression Requirements: Earned Advancement, Not Time-Based
Stage-based forecasting only works when stage transitions are disciplined. The biggest destroyer of forecast accuracy? Deals advancing through stages without earning it.
Earned advancement means specific exit criteria must be met before moving to the next stage.
Example exit criteria:
Qualification → Discovery:
- Confirmed budget range or budget holder identified
- Timeline discussed (buying within 6 months)
- Key decision-makers identified
- Initial pain points documented
Discovery → Solution Presentation:
- Discovery call completed with economic buyer or champion
- Current process and pain points validated
- Success criteria defined
- Competition identified
Solution Presentation → Proposal:
- Solution demo/presentation completed
- Technical requirements gathered
- Evaluation criteria confirmed
- Pricing parameters discussed
Proposal → Negotiation:
- Formal proposal submitted
- Proposal reviewed by economic buyer
- Questions/objections documented
- Next steps agreed upon
Without these defined exits, reps advance deals based on time ("It's been in Discovery for 3 weeks, move it forward") or wishful thinking ("I think they're ready for a proposal"). This destroys the correlation between stage and probability. Implementing proper stage gate criteria prevents this degradation.
Enforce stage discipline through required fields that must be completed before advancement, deal review meetings where stage progression is validated, CRM workflows that require evidence (proposal attachment, meeting notes), and reporting that shows stage velocity anomalies.
The hardest part? Telling a rep they need to move a deal backward. When a deal reaches "Negotiation" but the economic buyer hasn't actually engaged, it needs to go back to "Discovery." This is painful but needed for forecast integrity.
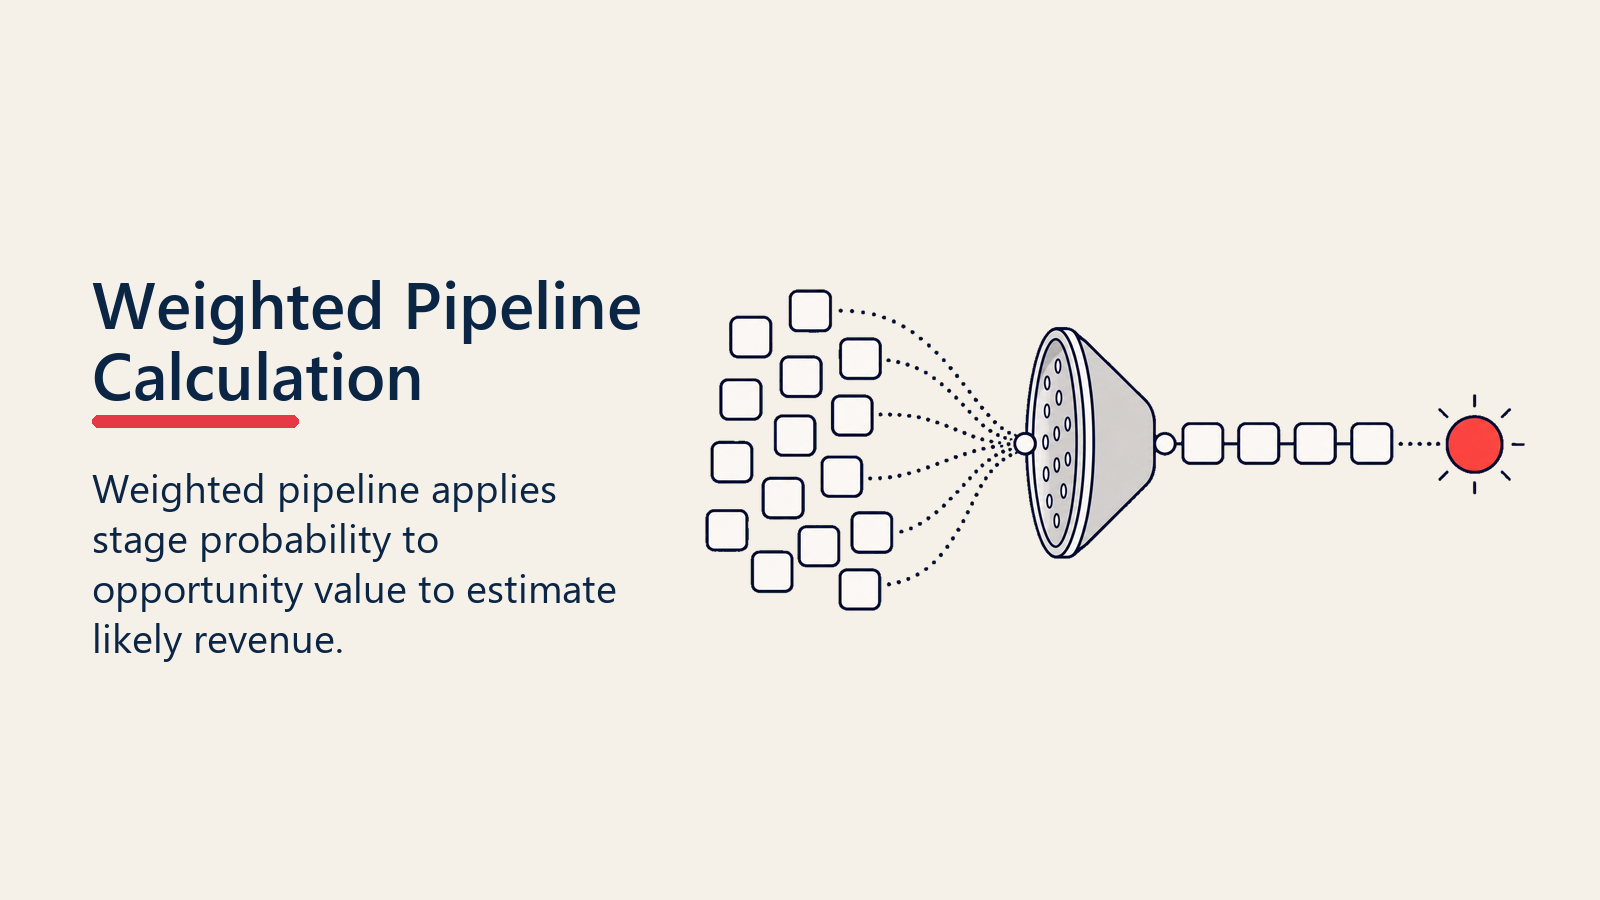
Weighted Pipeline Calculation: Turning Stage Data into Revenue Prediction
Weighted pipeline converts stage evidence into an expected revenue view by applying probability to opportunity value.
Once you have stage probabilities assigned, calculating weighted pipeline is straightforward:
Basic Weighted Pipeline Formula
Weighted Pipeline = Σ (Deal Amount × Stage Probability)
Example pipeline:
| Deal | Amount | Stage | Probability | Weighted Value |
|---|---|---|---|---|
| Acme Corp | $120,000 | Proposal | 60% | $72,000 |
| Beta Inc | $80,000 | Discovery | 20% | $16,000 |
| Gamma LLC | $200,000 | Negotiation | 80% | $160,000 |
| Delta Co | $50,000 | Qualification | 10% | $5,000 |
Total Pipeline Value: $450,000 Total Weighted Pipeline: $253,000
This $253,000 is your statistically probable revenue from these four deals. It's not guaranteed revenue, but it's your best prediction based on where deals currently stand.
Weighted Pipeline vs Raw Pipeline
Raw pipeline ($450,000 in this example) is misleading because it treats all deals equally. A $200,000 deal in Negotiation is radically different from a $200,000 deal in Qualification.
Weighted pipeline accounts for this reality. It tells you: "If historical patterns hold, this $450,000 pipeline will yield approximately $253,000 in closed revenue."
This is why raw pipeline coverage ratios (like "maintain 3x pipeline to quota") are primitive. A 3x ratio might be sufficient if your average stage probability is 33%, but insufficient if you're carrying too many early-stage deals.
Better metric: weighted pipeline coverage ratio. Learn more about pipeline coverage analysis for a comprehensive approach.
Weighted Coverage = Weighted Pipeline / Quota Target
For a $500K quota with $253K weighted pipeline:
Weighted Coverage = $253,000 / $500,000 = 0.51 (51%)
This tells you you're under-pipelined by about half. You need more deals or need to advance existing deals to higher-probability stages. A solid pipeline generation strategy addresses this gap.
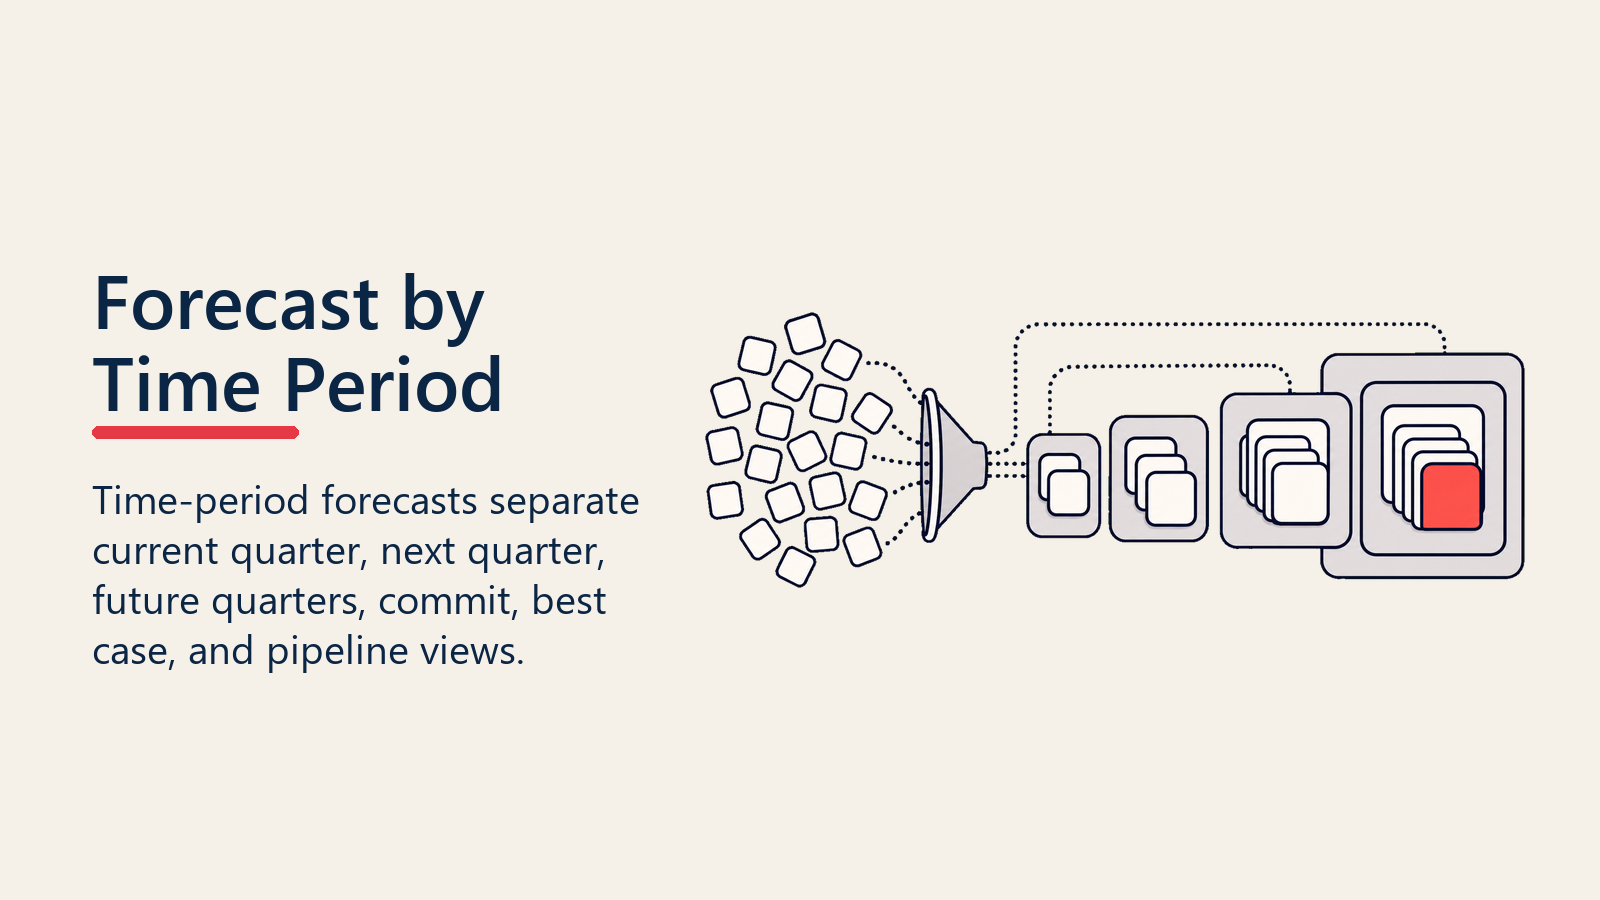
Stage-Based Forecast by Time Period
Stage-based forecasting becomes operational when you segment by time period, typically by quarter or month.
Current Quarter Forecast
Filter pipeline to deals with close dates in current quarter, apply stage-based weighting:
| Stage | Deal Count | Total Amount | Probability | Weighted Value |
|---|---|---|---|---|
| Negotiation | 8 | $800,000 | 80% | $640,000 |
| Proposal | 15 | $1,200,000 | 60% | $720,000 |
| Discovery | 25 | $1,500,000 | 20% | $300,000 |
| Total | 48 | $3,500,000 | , | $1,660,000 |
Current Quarter Forecast: $1,660,000
Current quarter forecasts are typically most accurate (85-95%) because deals are further progressed and close dates are near-term.
Next Quarter Forecast
Same calculation for next quarter pipeline:
| Stage | Deal Count | Total Amount | Probability | Weighted Value |
|---|---|---|---|---|
| Proposal | 10 | $900,000 | 60% | $540,000 |
| Discovery | 30 | $2,100,000 | 20% | $420,000 |
| Qualification | 50 | $2,500,000 | 10% | $250,000 |
| Total | 90 | $5,500,000 | , | $1,210,000 |
Next Quarter Forecast: $1,210,000
Next quarter forecasts are less accurate (70-80%) because deals are earlier stage and close dates are projections, not commitments.
Future Quarters Forecast
Beyond next quarter, stage-based forecasting becomes directional rather than precise. You're forecasting on deals that haven't reached high-probability stages and have uncertain timelines.
Best practice: separate future quarter forecasts into "pipeline trend" analysis rather than hard commitments. Show weighted values by stage to indicate where pipeline development is needed.
Rolling Forecast Approach
Instead of static quarterly forecasts, sophisticated teams maintain rolling forecasts:
- Commit Forecast: High-probability deals (Negotiation, Proposal) with near-term close dates
- Best Case: Commit + medium-probability deals (Discovery) if they progress on schedule
- Pipeline: All weighted pipeline including early-stage deals
This three-tier approach acknowledges uncertainty while providing visibility. Commit forecast has 90%+ accuracy. Best case has 70-80%. Pipeline forecast is directional.
Combining Stage with Other Factors
Stage-based forecasting is the foundation, but elite forecasters layer in additional signals:
Deal Age Factor
Deals that linger in a stage beyond normal velocity often have lower close probability than stage alone suggests.
Example adjustment:
- Typical "Proposal" stage duration: 15 days
- Deal has been in Proposal for 45 days
- Base probability: 60%
- Age-adjusted probability: 60% × 0.8 = 48%
This prevents artificially inflated forecasts from stalled deals that haven't been disqualified but aren't progressing. Effective deal aging management is critical for maintaining forecast accuracy.
Rep Judgment Overlay
Experienced reps often spot signals that stage data doesn't capture, a new stakeholder with concerns, an unexpected budget freeze, a competitive development.
Best practice: Allow reps to adjust stage-based probability up or down by ±20%, with required justification. This preserves stage as the anchor while acknowledging ground-truth intelligence.
Compare rep-adjusted forecasts to pure stage-based forecasts. If rep adjustments improve accuracy, incorporate those signals into your probability model. If rep adjustments are consistently wrong, reduce their weight.
Customer Engagement Signals
Modern revenue platforms track buyer engagement, email opens, proposal views, stakeholder activity. These can refine stage-based probabilities:
- High engagement (multiple stakeholders active, frequent proposal views): +10% to stage probability
- Low engagement (no activity in 14 days): -15% to stage probability
This overlay is particularly valuable for larger deals where buying committees are complex and engagement levels signal true interest.
Historical Deal Patterns
If you have enough data, analyze patterns beyond stage conversion:
- Deals from specific industries that reach Proposal close at 70% vs 55% overall
- Deals with certain champion personas convert at higher rates
- Deals that include technical validation stage close at 80% vs 65% without it
Incorporate these pattern-based adjustments into your probability model over time.
Stage-Based vs Rep Judgment: Complementary, Not Competing
The classic debate: should forecasts be stage-based or rep-judgment-based?
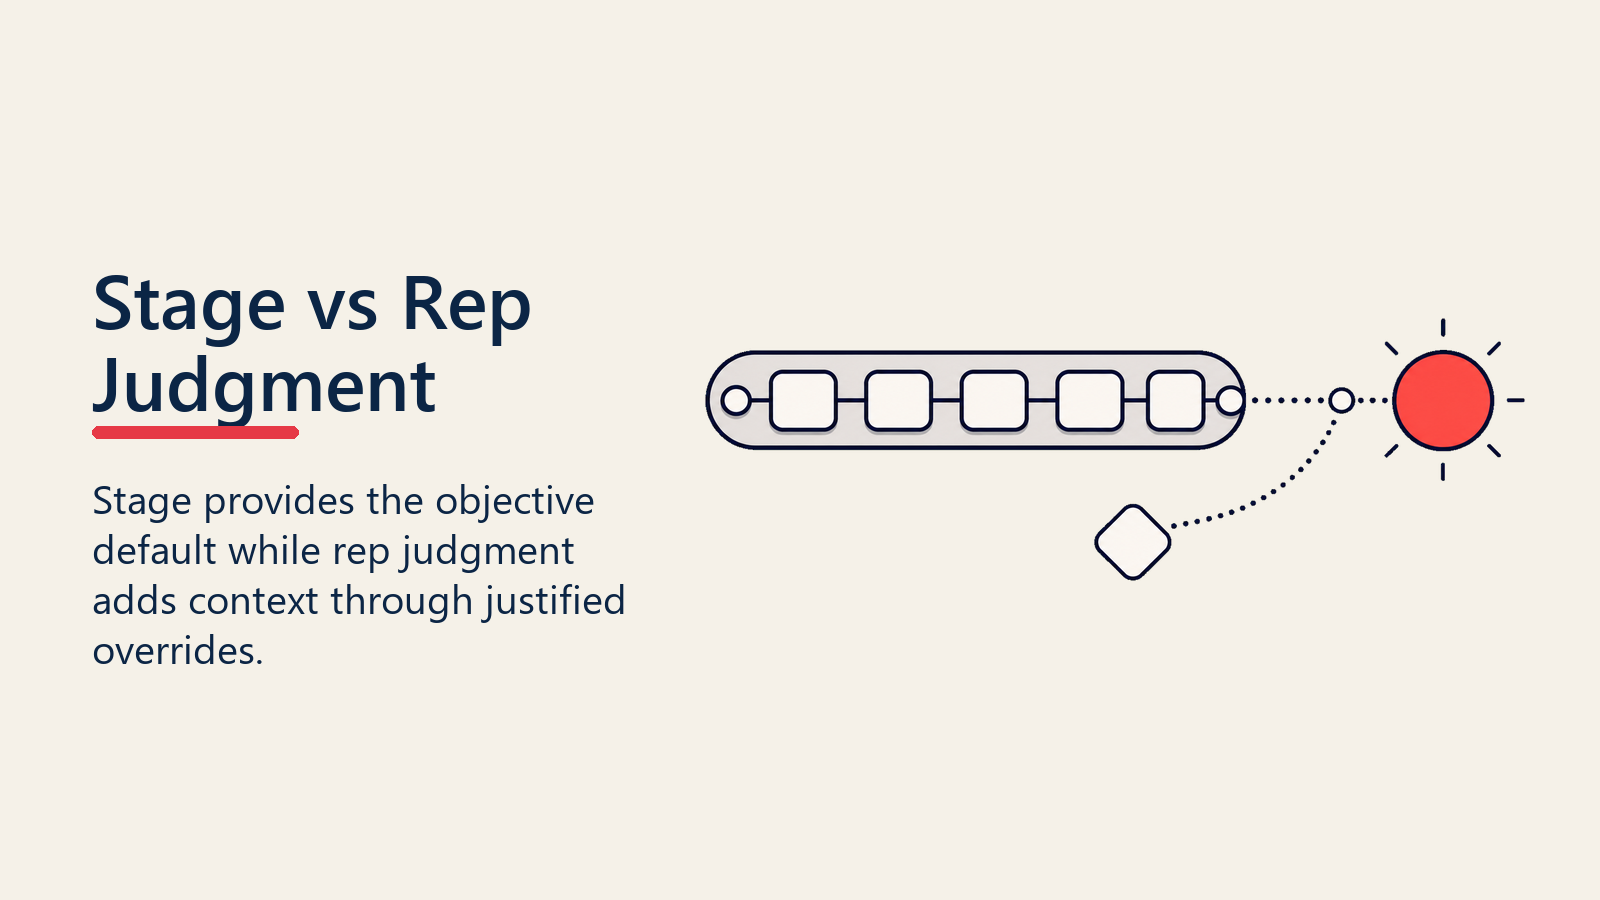
The answer: both, with stage as the default.
Advantages of Stage-Based Forecasting
Objectivity: Stage is observable and verifiable. "Did the proposal get submitted?" is factual.
Consistency: All reps use the same probability framework, making pipeline comparable across teams.
Accountability: Deals can't "feel like they'll close" at 90% while stuck in Discovery stage. Stage discipline forces reality.
Improvability: Historical analysis lets you refine stage probabilities based on actual outcomes, making forecasts more accurate over time.
Leading indicator: Stage progression predicts future revenue better than current revenue, deal age, or rep optimism.
When Rep Judgment Adds Value
Nuance capture: Reps know about competitive threats, budget changes, or champion departures that stage data doesn't reflect.
Early warning: Experienced reps often sense a deal going sideways before formal stage regression.
Context richness: Not all "Proposal" stages are equal. Reps know which proposals have strong champions vs tepid interest.
The Optimal Hybrid: Stage-Based with Rep Override
Use stage-based probability as default. Allow reps to adjust with required justification:
| Deal | Amount | Stage | Stage Probability | Rep Override | Rep Justification |
|---|---|---|---|---|---|
| Acme | $120K | Proposal | 60% | 75% | "CFO verbally committed, just finalizing terms" |
| Beta | $80K | Discovery | 20% | 5% | "Champion left company, restarting relationship" |
Track rep override accuracy. If a rep consistently improves forecast accuracy with overrides, weight their judgment more heavily. If their overrides are consistently wrong (usually over-optimistic), reduce override authority.
This approach preserves stage discipline while acknowledging that boots-on-the-ground intelligence matters. Regular pipeline reviews help calibrate these overrides.
Accuracy Validation: Comparing Stage Predictions to Outcomes
Stage-based forecasting is only valuable if it's accurate. Validate and improve through continuous analysis:
Quarterly Forecast Accuracy Review
At quarter close, compare:
- Forecasted Revenue (weighted pipeline at quarter start)
- Actual Revenue (deals closed)
- Accuracy Rate = Actual / Forecast
Example:
- Q1 weighted pipeline (Jan 1): $2,000,000
- Q1 actual closed revenue: $1,850,000
- Accuracy: 92.5%
Target: 85-95% accuracy for current quarter forecasts.
Stage Conversion Validation
Analyze each stage's actual conversion rate vs assigned probability:
| Stage | Assigned Probability | Deals Entered | Deals Closed | Actual Conversion | Variance |
|---|---|---|---|---|---|
| Negotiation | 80% | 40 | 34 | 85% | +5% |
| Proposal | 60% | 80 | 42 | 52.5% | -7.5% |
| Discovery | 20% | 200 | 44 | 22% | +2% |
In this example, "Proposal" stage is overestimated, assigned 60% but actually converting at 52.5%. Adjust probability down to 55% going forward.
Segment-Specific Accuracy
Break down accuracy by:
- Rep/Team: Which teams forecast accurately vs consistently over/under?
- Deal size: Do enterprise deals forecast more accurately than SMB?
- Source: Do inbound deals convert as predicted while outbound underperforms?
- Product line: Some products may have more predictable sales cycles
This analysis reveals where to refine probabilities and where stage discipline needs improvement. Lost deal analysis provides additional insights into forecast accuracy gaps.
Time Horizon Accuracy
Track how accuracy degrades over longer time horizons:
- Current quarter: 90% accuracy
- Next quarter: 75% accuracy
- Two quarters out: 55% accuracy
This calibrates how much confidence to place in longer-term forecasts and informs pipeline development needs. Understanding revenue predictability helps set appropriate expectations for each time horizon.
Stage Design for Forecasting: Aligning Stages with Buyer Journey
Your stage definitions determine forecast accuracy. Poorly designed stages, too many, too few, or misaligned with actual buyer progression, make stage-based forecasting ineffective.
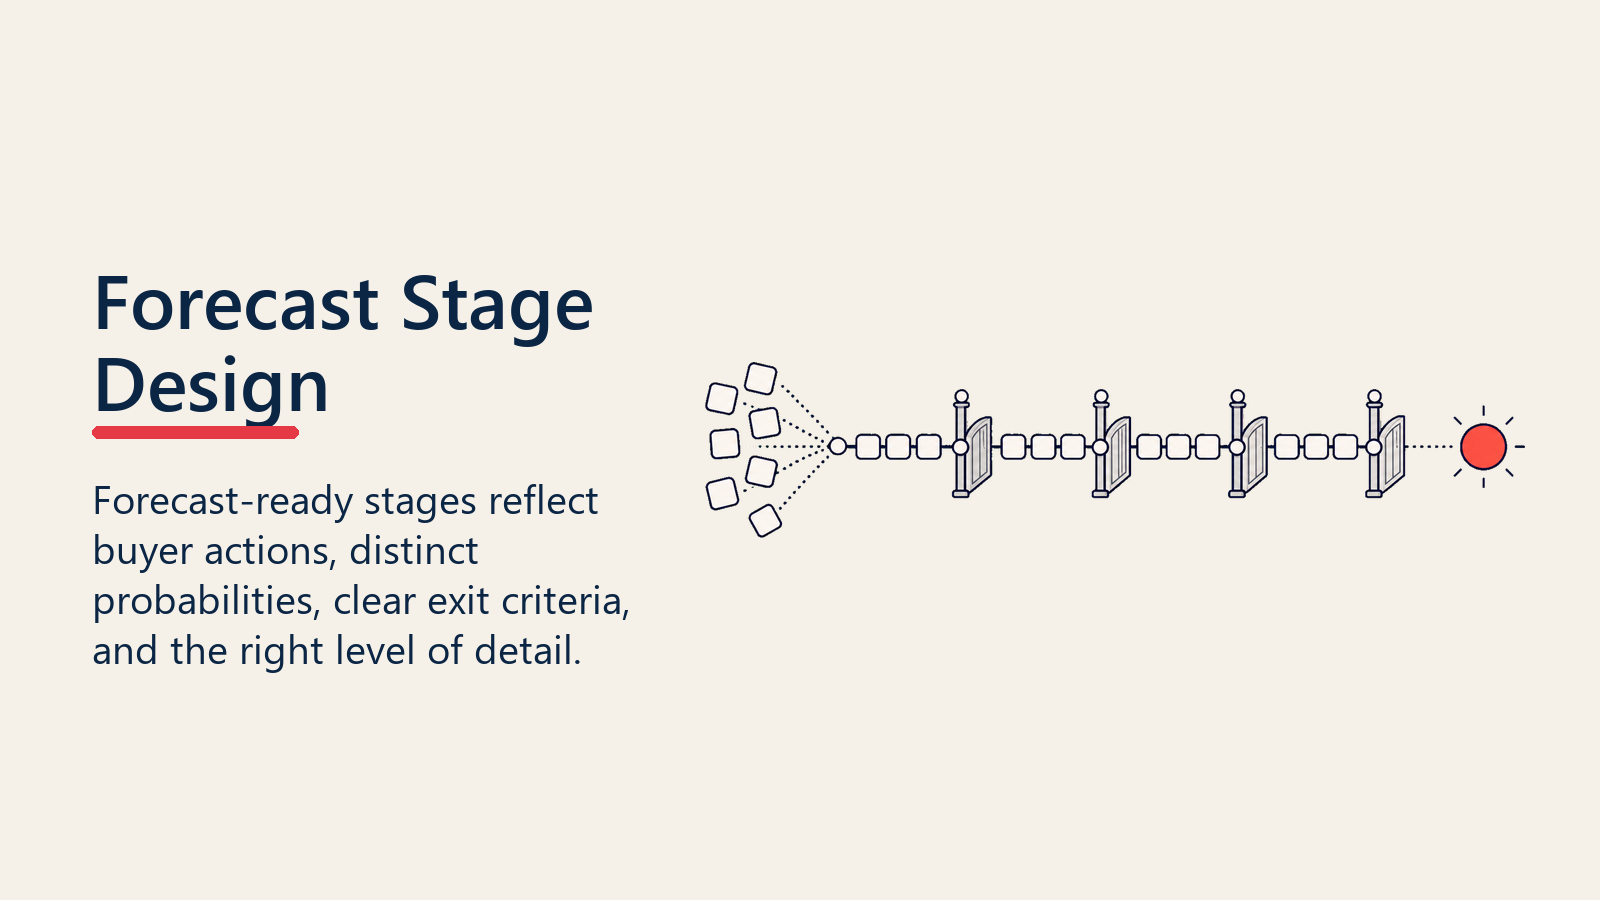
Principles of Forecast-Optimized Stage Design
1. Stages should reflect buyer actions, not seller activities
❌ Bad: "Demo Scheduled" (seller activity) ✅ Good: "Solution Validated" (buyer action, they agreed the solution fits their needs)
❌ Bad: "Proposal Sent" ✅ Good: "Proposal Reviewed" (buyer has actually reviewed it)
2. Each stage should have meaningfully different close probability
If "Needs Analysis" (20%), "Discovery Call" (22%), and "Pain Points Documented" (21%) all convert at essentially the same rate, combine them into one stage. Too many stages with similar probabilities add complexity without improving accuracy.
3. Stages should have clear, observable exit criteria
"Qualification" stage is meaningless if there's no defined criteria for what makes a deal qualified. Every stage needs specific exit requirements that are verifiable. See opportunity qualification for qualification best practices.
4. Stage quantity should match sales cycle complexity
- Simple sales (1-2 touch, transactional): 4-5 stages
- Moderate complexity (3-5 touch, SMB/Mid-market): 6-7 stages
- Complex sales (10+ touch, enterprise): 7-9 stages
More stages than necessary create administrative burden. Fewer stages than needed lose predictive resolution.
Example: Optimized Stage Framework for B2B SaaS
| Stage | Buyer Action | Exit Criteria | Typical Probability |
|---|---|---|---|
| Qualification | Prospect engages with intent signal | Budget, authority, need, timeline validated | 10% |
| Discovery | Prospect shares current process and pain | Discovery meeting completed, requirements documented | 20% |
| Solution Design | Prospect agrees solution fits their needs | Demo completed, technical fit validated | 40% |
| Proposal | Prospect reviews formal proposal | Proposal submitted and reviewed by economic buyer | 60% |
| Negotiation | Prospect enters commercial discussion | Pricing/terms discussion underway, legal review started | 80% |
| Verbal Commit | Prospect verbally agrees to terms | Verbal agreement received, paperwork pending | 90% |
This six-stage framework balances predictive value with operational simplicity. Each stage represents meaningful buyer progression, has clear exit criteria, and has statistically distinct close probability.
Conclusion: Stage-Based Forecasting as Operational Discipline
Stage-based forecasting isn't just a calculation methodology. It's an operational discipline that forces clarity on what's actually happening in your pipeline.
When you anchor forecasts to stage progression, you build a system that rewards earned advancement over optimistic projections, provides a consistent probability framework across all reps and teams, enables data-driven improvement as historical conversion rates refine probabilities, creates accountability through observable stage criteria, and predicts revenue with 85-95% accuracy when executed with discipline.
Organizations that forecast accurately aren't lucky. They don't have magical reps with perfect intuition. They have operational discipline: well-defined stages that reflect real buyer progression, probability assignments based on historical data, and stage advancement requirements that prevent wishful thinking.
If your forecasts are consistently wrong or you're constantly surprised by quarter-end results, the problem isn't your reps' judgment or your market's unpredictability. It's that you don't have stage-based discipline.
Build the foundation: define stages that matter, assign probabilities that reflect reality, enforce progression criteria that prevent stage inflation. The forecast accuracy will follow.
Ready to build forecast accuracy through stage discipline? Explore forecasting fundamentals and pipeline stages design to create a data-driven forecasting operation.
Learn more:

Senior Operations & Growth Strategist
On this page
- Why Stage Progression is the Best Leading Indicator
- What is Stage-Based Forecasting?
- Stage Probability Assignment: From Arbitrary to Data-Driven
- Standard Stage Probabilities (Starting Point)
- Historical Conversion-Based Probabilities (Data-Driven)
- Industry Benchmarks (Calibration Check)
- Custom Probability Models (Advanced)
- Stage Progression Requirements: Earned Advancement, Not Time-Based
- Weighted Pipeline Calculation: Turning Stage Data into Revenue Prediction
- Basic Weighted Pipeline Formula
- Weighted Pipeline vs Raw Pipeline
- Stage-Based Forecast by Time Period
- Current Quarter Forecast
- Next Quarter Forecast
- Future Quarters Forecast
- Rolling Forecast Approach
- Combining Stage with Other Factors
- Deal Age Factor
- Rep Judgment Overlay
- Customer Engagement Signals
- Historical Deal Patterns
- Stage-Based vs Rep Judgment: Complementary, Not Competing
- Advantages of Stage-Based Forecasting
- When Rep Judgment Adds Value
- The Optimal Hybrid: Stage-Based with Rep Override
- Accuracy Validation: Comparing Stage Predictions to Outcomes
- Quarterly Forecast Accuracy Review
- Stage Conversion Validation
- Segment-Specific Accuracy
- Time Horizon Accuracy
- Stage Design for Forecasting: Aligning Stages with Buyer Journey
- Principles of Forecast-Optimized Stage Design
- Example: Optimized Stage Framework for B2B SaaS
- Conclusion: Stage-Based Forecasting as Operational Discipline