Conversion Rate Analysis: Stage-by-Stage Pipeline Performance Metrics
Turn this article into takeaways for your work.
Each assistant summarizes the article only for you and suggests best practices for your work.
Your overall win rate looks fine. Twenty-five percent. Maybe even thirty. Right in line with industry benchmarks.
But here's what that number doesn't tell you: you're converting 80% of qualified leads to proposals, then losing 90% between proposal and negotiation. Or you're getting 70% of deals through negotiation but only closing 30% of those. Or half your pipeline is dying in discovery while the other half converts beautifully.
Overall win rate is a lie. Not because it's inaccurate, it's just useless for improving performance. It's an average that masks where your process is working and where it's broken.
If you're serious about building predictable revenue, you need stage-by-stage conversion rate analysis. That's where the truth lives.
What is Conversion Rate Analysis?
Conversion rate analysis measures how effectively deals advance from one pipeline stage to the next. Instead of just tracking whether deals eventually close, you're measuring the progression rate at every transition point in your sales process.
The formula is simple:
Conversion Rate = (Deals Advanced to Next Stage / Deals That Entered Current Stage) × 100
But the real power comes from analyzing these rates systematically:
- By stage: Which transitions are bottlenecks?
- By segment: Do rates vary by product, deal size, region, or industry?
- By rep: Who's converting well at each stage, and who's struggling?
- By time: Are rates improving or declining month-over-month?
This granular view transforms your pipeline from a black box into a diagnostic system. You stop guessing why quota attainment is down and start seeing exactly where deals are dying. Understanding pipeline velocity alongside conversion rates provides even deeper insights into pipeline health.
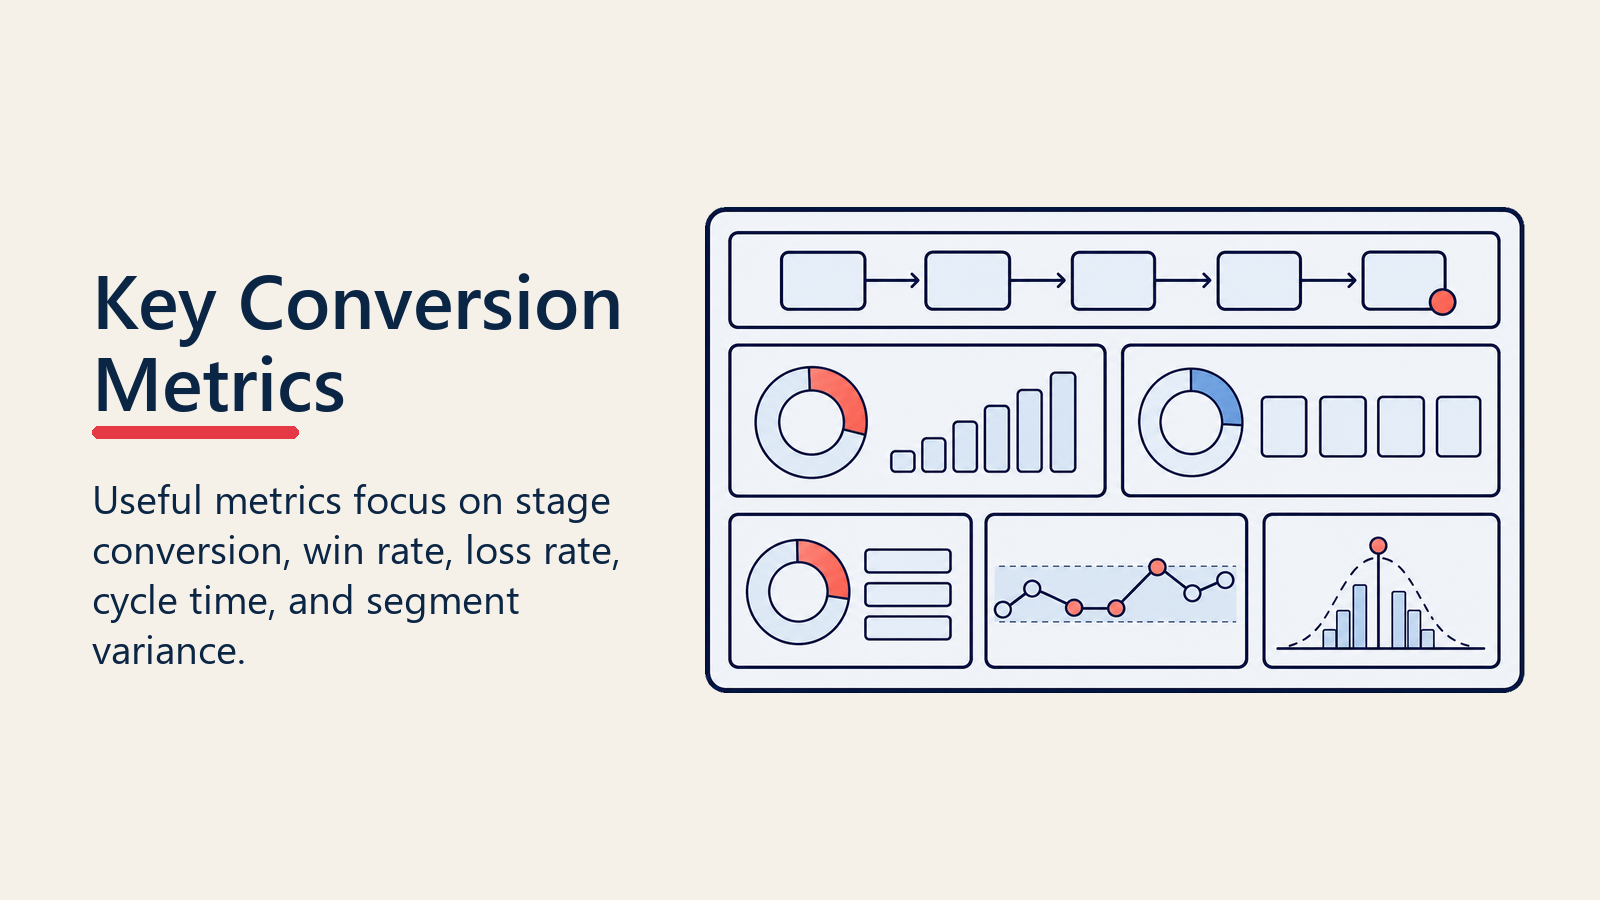
Key Conversion Metrics That Actually Matter
Most teams track too many metrics or the wrong ones. Here are the four conversion metrics that drive everything else:
1. Lead-to-Opportunity Conversion Rate
What percentage of leads become qualified sales opportunities? This measures your lead-to-opportunity conversion effectiveness, whether marketing and SDRs are generating leads worth pursuing and whether your qualification criteria predict deal potential.
Healthy range: 10-25% depending on lead source quality and ICP tightness.
2. Stage-to-Stage Conversion Rates
The percentage of deals that advance from each stage to the immediate next stage:
- Discovery → Qualified
- Qualified → Proposal
- Proposal → Negotiation
- Negotiation → Closed-Won
These rates reveal process effectiveness. A 30% conversion from proposal to negotiation signals either weak proposals, poor pricing, or inadequate stakeholder alignment before the proposal stage.
3. Overall Win Rate (Stage 1 to Closed-Won)
The traditional metric: what percentage of all opportunities ultimately close? This provides context but shouldn't drive decision-making in isolation.
Healthy range: 20-35% for most B2B sales, though highly consultative or enterprise sales may see 40-50%.
4. Pipeline-to-Quota Conversion Rate
How much pipeline do you need to generate to hit quota? This determines pipeline coverage requirements and forecasting accuracy.
Formula: Revenue Closed / Total Pipeline Value at Start of Period
Healthy range: 25-35%, meaning you need 3-4x pipeline coverage to reliably hit targets.
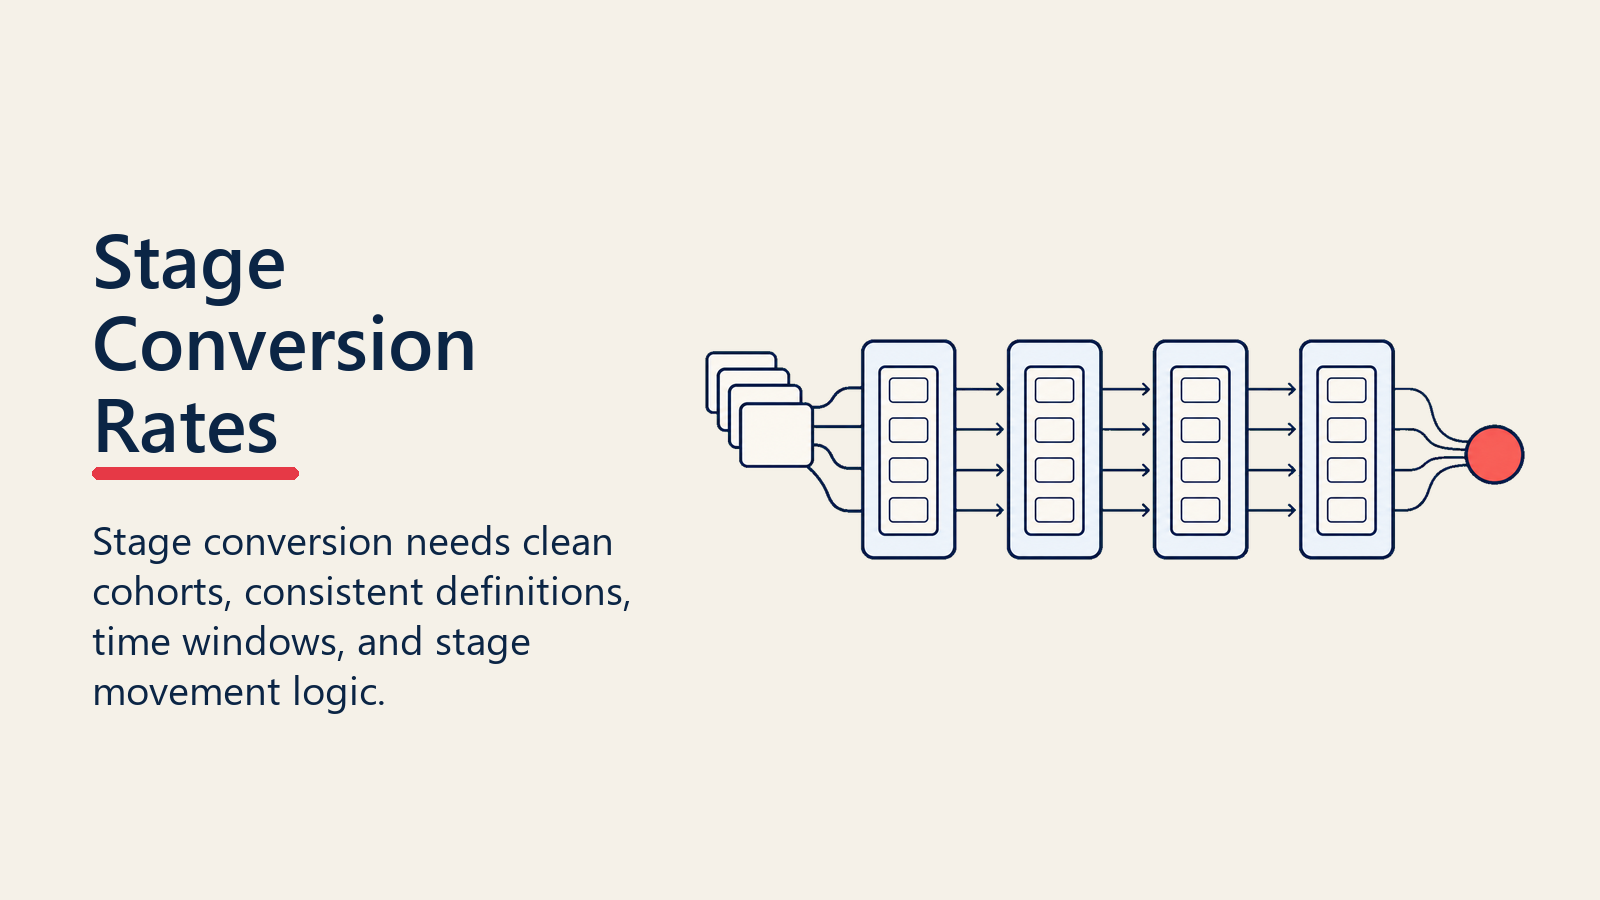
Calculating Stage Conversion Rates: The Right Way
Stage conversion rates are useful only when entry and exit points are defined consistently across the pipeline.
Most teams calculate conversion rates wrong, leading to misleading conclusions. Here's the methodology that actually works:
Cohort-Based Calculation
Track a cohort of deals that entered a stage during a specific period (e.g. all deals that hit "Qualified" in Q1) and measure what percentage advanced to the next stage, regardless of when they advanced.
Example:
- 100 deals entered "Qualified" in Q1
- 60 of those eventually advanced to "Proposal" (some in Q1, some in Q2)
- Qualified → Proposal conversion rate = 60%
This approach accounts for sales cycle length and avoids the artificial inflation or deflation caused by deals still in-progress.
Time-Bound vs. Ultimate Conversion
Two valid perspectives:
Time-bound conversion: What percentage of deals advanced within X days?
- Use this to measure velocity and identify delays
- "Only 40% of qualified deals reach proposal within 30 days"
Ultimate conversion: What percentage eventually advanced, regardless of timing?
- Use this to measure overall effectiveness
- "Ultimately, 65% of qualified deals reach proposal"
Both matter. Time-bound conversion drives urgency and highlights stalled deals. Ultimate conversion measures process quality.
Avoid Snapshot Errors
Don't calculate conversion rates by dividing current stage counts:
Wrong: Current proposals / Current qualified deals = 75%
This is meaningless. Those proposals didn't come from those qualified deals. They're different cohorts at different lifecycle stages.
Right: Track cohorts forward through stages using deal history data.
Conversion Rate Benchmarks by Stage
While every business is different, these benchmarks provide a reality check for typical B2B sales processes:
| Stage Transition | Healthy Range | Red Flag |
|---|---|---|
| Lead → Opportunity | 10-25% | <8% suggests poor lead quality or over-qualifying |
| Discovery → Qualified | 60-75% | <50% means discovery isn't effective at filtering |
| Qualified → Proposal | 50-60% | <40% signals premature qualification or poor discovery |
| Proposal → Negotiation | 40-50% | <30% indicates weak proposals or pricing issues |
| Negotiation → Closed-Won | 60-70% | <50% suggests poor deal qualification earlier |
Important context: These ranges assume a rigorous qualification process. If you're accepting every inbound lead as an opportunity, your lead-to-opportunity rate will be higher, but your downstream conversion rates will be abysmal.
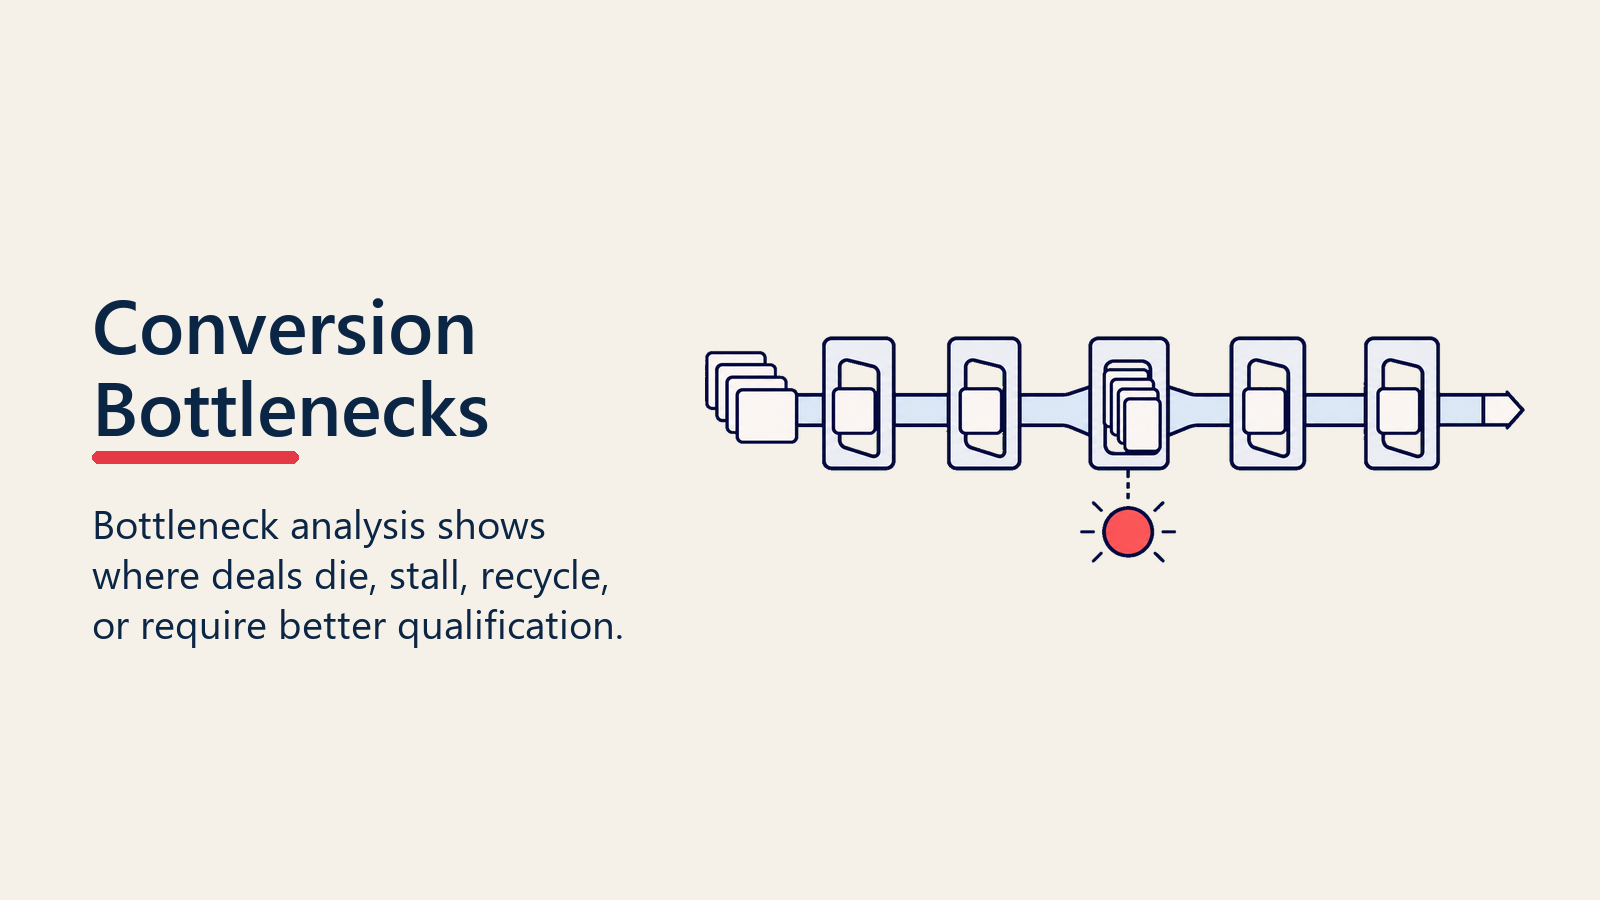
Identifying Conversion Bottlenecks: Where Deals Really Die
Bottleneck analysis reveals which stage loses momentum, quality, or buyer commitment before revenue is at risk.
High-performing teams diagnose where deals get stuck or lost. Here's the framework:
The Waterfall Analysis
Visualize your pipeline as a waterfall, with volume dropping at each stage:
- Start with total leads or opportunities at the top
- Calculate what percentage advances to each subsequent stage
- Identify the biggest drop-offs
Example waterfall:
- 1,000 leads
- 200 opportunities (20% conversion)
- 140 qualified (70% conversion)
- 56 proposals (40% conversion) ← BOTTLENECK
- 28 negotiations (50% conversion)
- 17 closed-won (61% conversion)
The Qualified → Proposal transition is killing this pipeline. Only 40% of qualified deals reach the proposal stage, well below the 50-60% benchmark.
Cohort Velocity Analysis
Track how long deals spend in each stage before advancing or dying:
- Average days in Discovery: 12 days
- Average days in Qualified: 45 days ← CONCERN
- Average days in Proposal: 18 days
- Average days in Negotiation: 22 days
If deals are sitting in Qualified for 45 days, you're either not engaging effectively, not providing value in that stage, or qualification criteria don't align with what's needed to build a proposal. Effective deal aging management helps identify and address these stalled opportunities before they die.
Lost Deal Stage Distribution
Where are you losing deals?
- Lost in Discovery: 15%
- Lost in Qualified: 25% ← BIGGEST LOSS POINT
- Lost in Proposal: 40% ← CRITICAL ISSUE
- Lost in Negotiation: 20%
If 40% of lost deals die in Proposal, your proposals are the problem, whether that's pricing, positioning, or simply proposing to deals that weren't truly qualified.
Conversion Analysis by Segment: Finding Hidden Patterns
Aggregate conversion rates mask performance variations. Proper pipeline segmentation reveals where your process excels and where it fails.
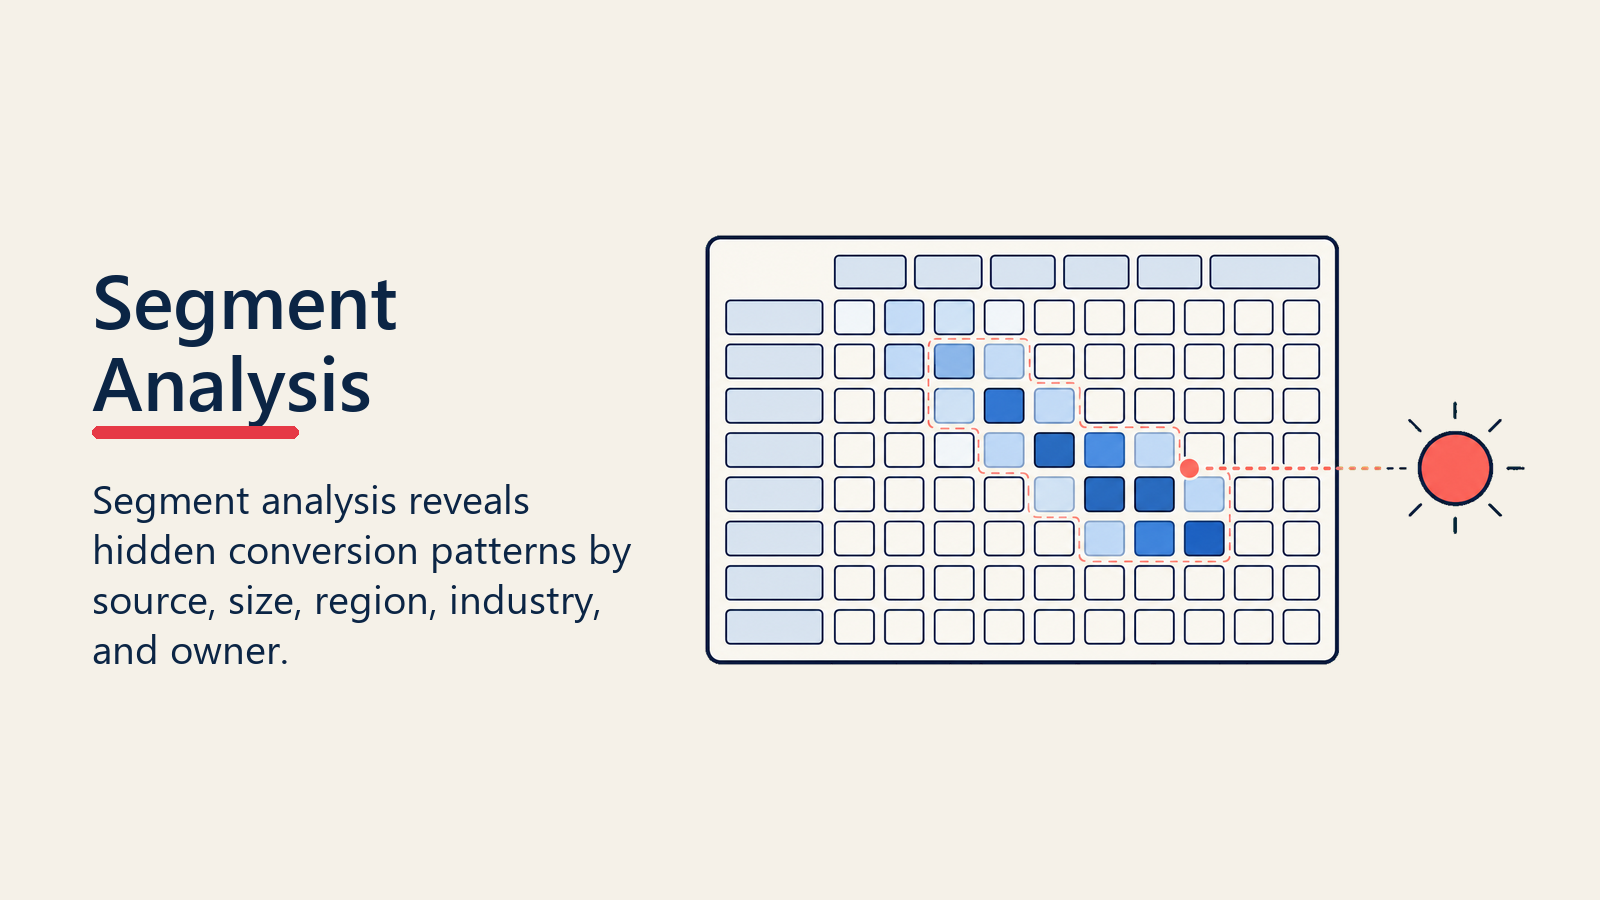
By Deal Size
Small deals often convert faster but at lower rates. Enterprise deals convert more slowly but at higher rates if properly qualified.
Example segmentation:
- <$10K deals: 35% overall win rate, 45-day cycle
- $10-50K deals: 28% overall win rate, 60-day cycle
- $50K+ deals: 42% overall win rate, 120-day cycle
This reveals that mid-market ($10-50K) has the worst conversion. Why? Possibly wrong qualification criteria, weak value prop for that segment, or inadequate sales process for that complexity level.
By Product or Solution
Different products have different conversion profiles:
- Core product: 65% Qualified → Proposal, 32% win rate
- Premium add-on: 45% Qualified → Proposal, 48% win rate
- New product launch: 30% Qualified → Proposal, 15% win rate
The new product is struggling at qualification and conversion. This signals a need for better qualification criteria, stronger positioning, or more customer education before proposing.
By Sales Rep
Individual rep performance often varies wildly:
| Rep | Discovery → Qualified | Qualified → Proposal | Overall Win Rate |
|---|---|---|---|
| Rep A | 75% | 68% | 38% |
| Rep B | 62% | 55% | 26% |
| Rep C | 80% | 45% | 22% |
Rep C is great at qualifying but terrible at converting qualified deals to proposals. This suggests skill gaps in discovery conversations, stakeholder mapping, or proposal development. Coaching opportunity identified.
By Source or Channel
Conversion rates vary dramatically by how prospects enter your pipeline:
- Inbound demo requests: 25% qualified → proposal, 40% win rate
- Outbound prospecting: 60% qualified → proposal, 28% win rate
- Partner referrals: 70% qualified → proposal, 45% win rate
Outbound has better qualification (higher qualified → proposal) but lower win rates. Inbound has weaker qualification but stronger intent. Partner referrals excel on both. This informs where to invest in lead generation and how to adjust qualification by source.
Time-Based Conversion Analysis: Spotting Trends Early
Month-over-month and quarter-over-quarter conversion tracking reveals trends before they destroy quota attainment.
Rolling 90-Day Conversion Trends
Track conversion rates over rolling 90-day cohorts:
Qualified → Proposal conversion:
- Q4 2024: 58%
- Q1 2026: 52%
- Q2 2026: 47%
This is a problem. Conversion is declining steadily. Possible causes: rep turnover, product-market fit erosion, increased competition, or process degradation.
Seasonal Patterns
Many businesses have seasonal conversion variations:
- Q4: Higher win rates (budget flush, year-end urgency)
- Q1: Lower conversion (new budgets, planning cycles)
- Summer: Longer cycles (vacations, slower decision-making)
Understanding these patterns helps you adjust pipeline coverage requirements and forecast more accurately.
Leading vs. Lagging Indicators
Early-stage conversion rates are leading indicators of future revenue:
- If Lead → Opportunity conversion drops in January, you'll see revenue impact in March or April
- If Qualified → Proposal conversion drops in March, Q2 bookings will suffer
Monitoring leading indicators allows proactive intervention rather than reactive panic when bookings miss.
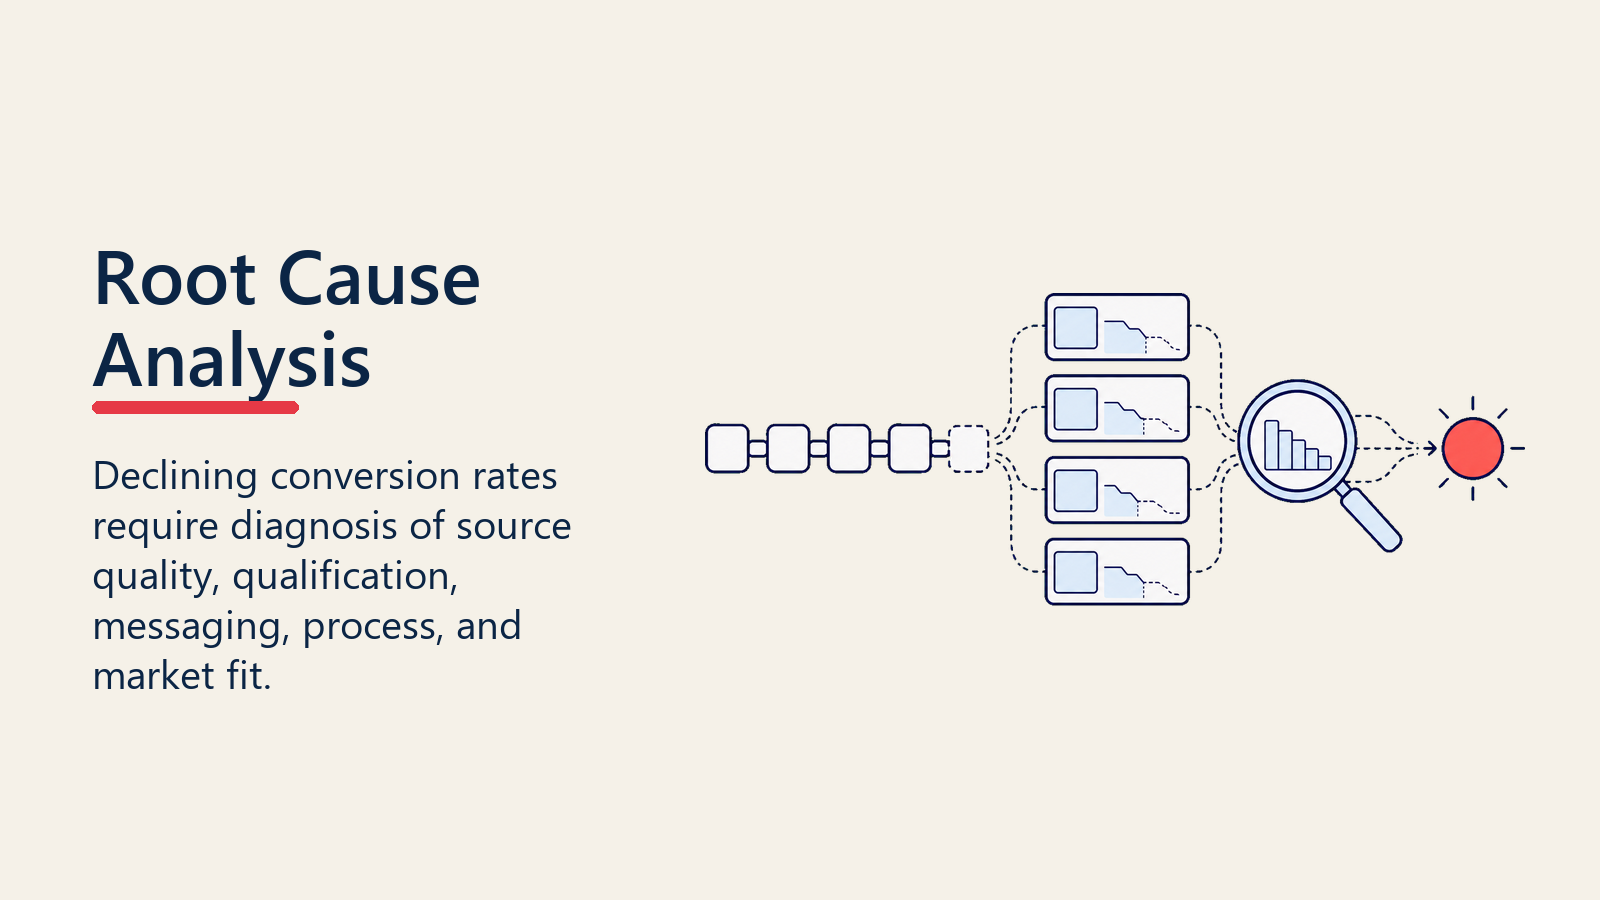
Root Cause Analysis: Why Conversion Rates Decline
When conversion rates drop, avoid surface-level explanations ("leads are bad," "market is tough"). Dig into actual root causes:
Process Breakdown
Are stage gate criteria being followed? Use deal reviews to audit:
- Was the deal properly qualified before advancing?
- Were required discovery questions asked and documented?
- Did the proposal include all necessary components?
Often, conversion drops because reps are skipping steps to inflate pipeline volume or meet activity metrics.
Skill Gaps
Are certain reps or teams consistently underperforming at specific stages? This signals training opportunities:
- Low Discovery → Qualified: Need better discovery questioning, pain identification
- Low Qualified → Proposal: Need stakeholder mapping, business case development
- Low Proposal → Negotiation: Need proposal quality, pricing confidence
- Low Negotiation → Close: Need objection handling, closing skills
Market Changes
Has competitive landscape shifted? Are buyer expectations different? Review lost deal reasons:
- "Chose competitor": Competitive positioning or differentiation problem
- "No decision": Urgency or compelling event problem
- "Budget": Value communication or pricing problem
- "Internal priorities changed": Qualification or stakeholder alignment problem
Tool or System Issues
Sometimes conversion drops because of operational problems:
- CRM data quality degrades, causing mis-routing or poor follow-up
- Proposal tools break, slowing response time
- Integration failures cause leads to drop
- Automation sequences stop working, reducing nurture effectiveness
Don't overlook operational hygiene as a conversion rate killer.
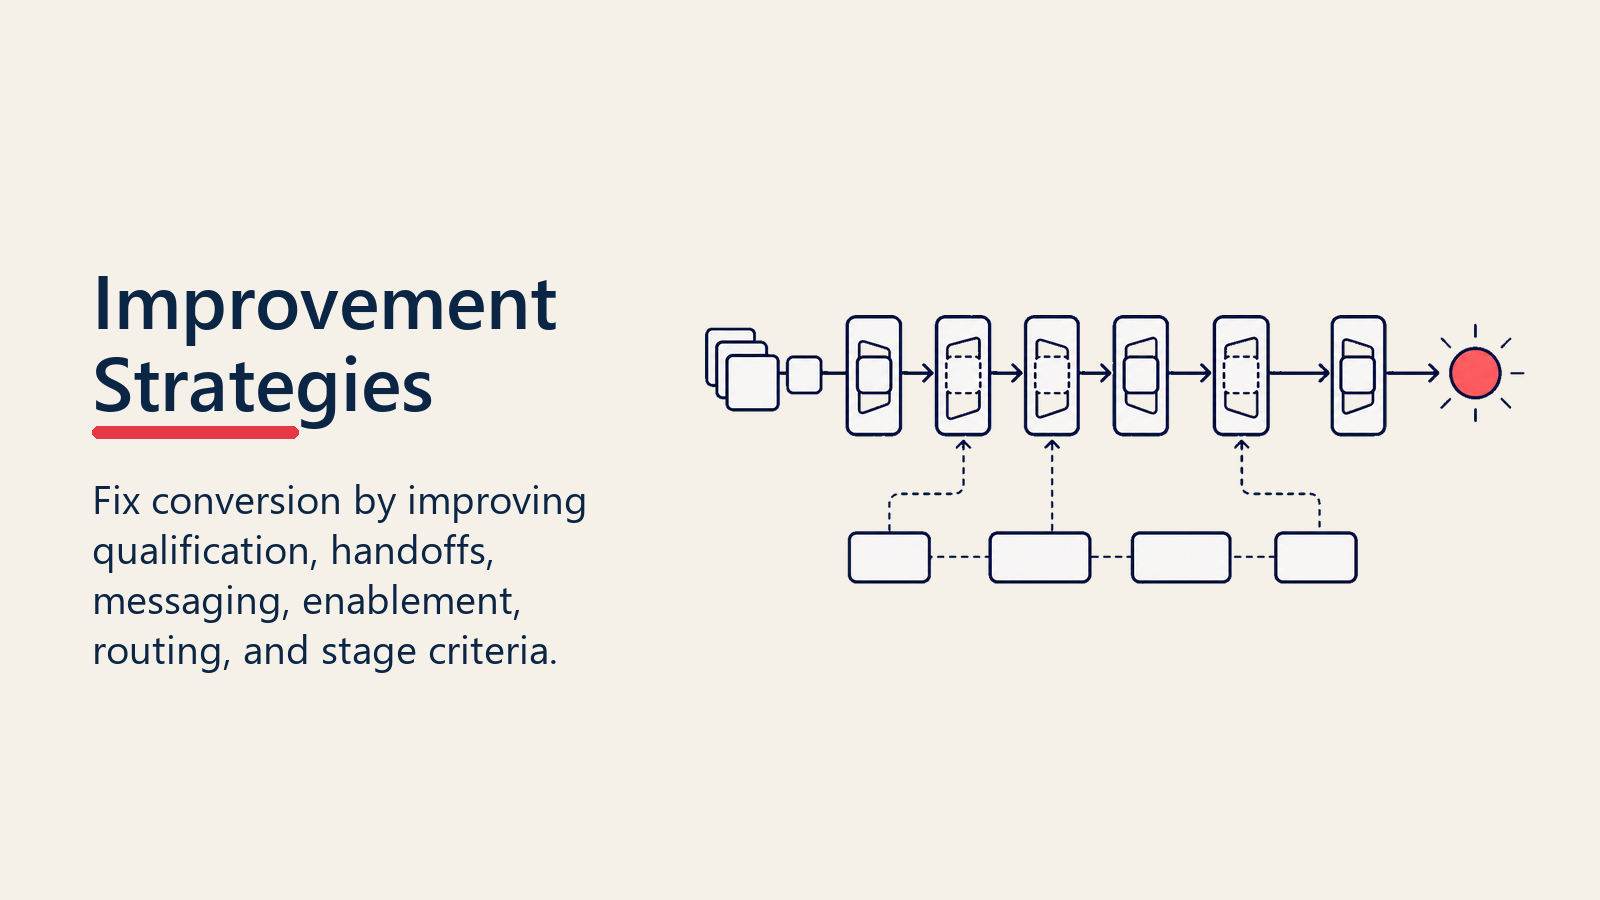
Improvement Strategies: How to Actually Fix Conversion Rates
Once you've identified bottlenecks and root causes, systematic improvement follows clear patterns:
1. Tighten Stage Gate Criteria
If downstream conversion rates are low, you're advancing deals too early. Implement stricter stage gate criteria with required exit criteria:
Example Qualified → Proposal gate:
- Budget confirmed and documented
- Decision process and timeline understood
- Key stakeholders identified and engaged
- Success criteria defined
- Compelling event validated
Require managers to approve stage advancements until criteria compliance improves.
2. Targeted Skills Training
Map conversion weaknesses to specific skills and train accordingly:
- Discovery → Qualified: Discovery call training, qualification frameworks, BANT/MEDDIC workshops
- Qualified → Proposal: Business case development, ROI quantification, proposal writing
- Proposal → Negotiation: Pricing conversations, objection handling, stakeholder navigation
- Negotiation → Close: Closing techniques, contract negotiation, urgency creation
Measure training effectiveness by tracking conversion rate changes post-training for trained vs. untrained reps.
3. Improve Sales Enablement Content
Conversion often improves with better tools:
- Case studies that address common objections in Proposal stage
- ROI calculators that quantify value in Qualified stage
- Competitive battlecards that support differentiation in Negotiation
- Demo scripts that improve Discovery effectiveness
Track which content correlates with higher conversion rates and create more of that.
4. Optimize Process Workflows
Sometimes conversion improves through operational changes:
- Automate proposal generation to reduce time from Qualified to Proposal
- Implement required fields in CRM to enforce data quality
- Add approval workflows to prevent premature stage advancement
- Create templates that standardize high-performing activities
These changes reduce friction and ensure consistency.
5. Realign Incentives
If metrics incentivize the wrong behavior, conversion suffers:
Example: SDRs measured on "opportunities created" will advance unqualified leads to hit quotas, destroying downstream conversion.
Fix: Measure SDRs on "qualified opportunities created" or "opportunities that reach proposal" to align incentives with quality.
6. Implement Conversion-Based Coaching
Use conversion data to drive one-on-one coaching:
Rep coaching template:
- Pull rep's stage-by-stage conversion rates vs. team average
- Identify 1-2 biggest gaps
- Conduct deal reviews for lost/stuck deals in those stages
- Identify skill or process gaps
- Create action plan with specific skills practice
- Track conversion rate improvement over next 90 days
This targeted approach beats generic sales training every time.
Measuring Improvement: The Continuous Optimization Loop
Conversion rate analysis isn't a one-time project. It's a continuous optimization discipline:
Monthly Review Cadence
Week 1: Pull conversion metrics by stage, segment, rep, and time period Week 2: Analyze bottlenecks, trends, and outliers Week 3: Diagnose root causes through deal reviews and data analysis Week 4: Implement improvements (training, process, tools, coaching)
Repeat monthly, tracking whether changes are moving conversion rates in the right direction.
Experimentation Framework
Treat improvements as experiments:
- Hypothesis: "If we require documented budget before advancing to Proposal, Proposal → Negotiation conversion will improve"
- Test: Implement requirement for 50% of reps, leave control group
- Measure: Track conversion rates for test vs. control over 60 days
- Decision: Roll out to all reps if test group shows improvement
This scientific approach prevents cargo-cult changes that don't actually work.
Integration with Pipeline Reviews
Use conversion data to make pipeline reviews more productive:
Instead of: "What's the status of the Johnson deal?"
Ask: "This deal has been in Qualified for 45 days, which is 2x our average. What's blocking advancement to Proposal? Do we have documented budget and stakeholders?"
Conversion metrics make reviews diagnostic, not just status updates.
Common Pitfalls to Avoid
Teams new to conversion rate analysis make predictable mistakes:
Pitfall 1: Analyzing too frequently Conversion rates are noisy week-to-week. Use 30-60 day cohorts minimum to avoid overreacting to normal variance.
Pitfall 2: Ignoring statistical significance If a rep has 8 deals and another has 80, their conversion rate comparison isn't meaningful. Require minimum sample sizes.
Pitfall 3: Focusing only on win rate A high win rate with low pipeline volume doesn't hit quota. Balance conversion optimization with pipeline generation strategy.
Pitfall 4: Not tracking deal progression time A deal that takes 6 months to convert through stages isn't as healthy as one that takes 45 days, even if both ultimately close.
Pitfall 5: Comparing incomparable segments Enterprise and SMB conversion rates differ naturally. Compare apples to apples when benchmarking.
Conclusion: From Black Box to Diagnostic Engine
Your pipeline is either a black box or a diagnostic engine. Black box thinking says "we need more leads" or "reps need to work harder." Diagnostic thinking says "our Qualified → Proposal conversion dropped from 58% to 47% over the last two quarters, concentrated in mid-market deals, driven primarily by three reps, caused by inadequate discovery."
Conversion rate analysis transforms your pipeline into the diagnostic engine. It reveals where your process works, where it breaks, who's succeeding, who needs help, and what interventions will actually move the needle.
The companies that master this analysis build predictable revenue machines. The ones that rely on overall win rate and gut feel watch opportunities evaporate and wonder why quota attainment is so volatile.
Your pipeline is full of signals. Conversion rate analysis is how you learn to read them.
Ready to optimize your pipeline performance? Explore how pipeline metrics overview and pipeline bottleneck analysis can drive systematic improvement.
Learn more:

Senior Operations & Growth Strategist
On this page
- What is Conversion Rate Analysis?
- Key Conversion Metrics That Actually Matter
- 1. Lead-to-Opportunity Conversion Rate
- 2. Stage-to-Stage Conversion Rates
- 3. Overall Win Rate (Stage 1 to Closed-Won)
- 4. Pipeline-to-Quota Conversion Rate
- Calculating Stage Conversion Rates: The Right Way
- Cohort-Based Calculation
- Time-Bound vs. Ultimate Conversion
- Avoid Snapshot Errors
- Conversion Rate Benchmarks by Stage
- Identifying Conversion Bottlenecks: Where Deals Really Die
- The Waterfall Analysis
- Cohort Velocity Analysis
- Lost Deal Stage Distribution
- Conversion Analysis by Segment: Finding Hidden Patterns
- By Deal Size
- By Product or Solution
- By Sales Rep
- By Source or Channel
- Time-Based Conversion Analysis: Spotting Trends Early
- Rolling 90-Day Conversion Trends
- Seasonal Patterns
- Leading vs. Lagging Indicators
- Root Cause Analysis: Why Conversion Rates Decline
- Process Breakdown
- Skill Gaps
- Market Changes
- Tool or System Issues
- Improvement Strategies: How to Actually Fix Conversion Rates
- 1. Tighten Stage Gate Criteria
- 2. Targeted Skills Training
- 3. Improve Sales Enablement Content
- 4. Optimize Process Workflows
- 5. Realign Incentives
- 6. Implement Conversion-Based Coaching
- Measuring Improvement: The Continuous Optimization Loop
- Monthly Review Cadence
- Experimentation Framework
- Integration with Pipeline Reviews
- Common Pitfalls to Avoid
- Conclusion: From Black Box to Diagnostic Engine