Weighted Pipeline: Probability-Based Opportunity Valuation and Forecasting
Turn this article into takeaways for your work.
Each assistant summarizes the article only for you and suggests best practices for your work.
Your VP of Sales announces: "We have $4.2 million in pipeline for Q2. We only need to close $1.2 million. We're golden."
Three weeks before quarter close, you've closed $600K. Half the "sure things" pushed. Your board meeting just got very uncomfortable.
This happens because most companies track total pipeline value—a meaningless number that treats every opportunity as equally likely to close. A $100K deal in discovery (10% chance) counts the same as a $100K deal in contract review (90% chance). Your pipeline dashboard shows abundance while your forecast is fiction.
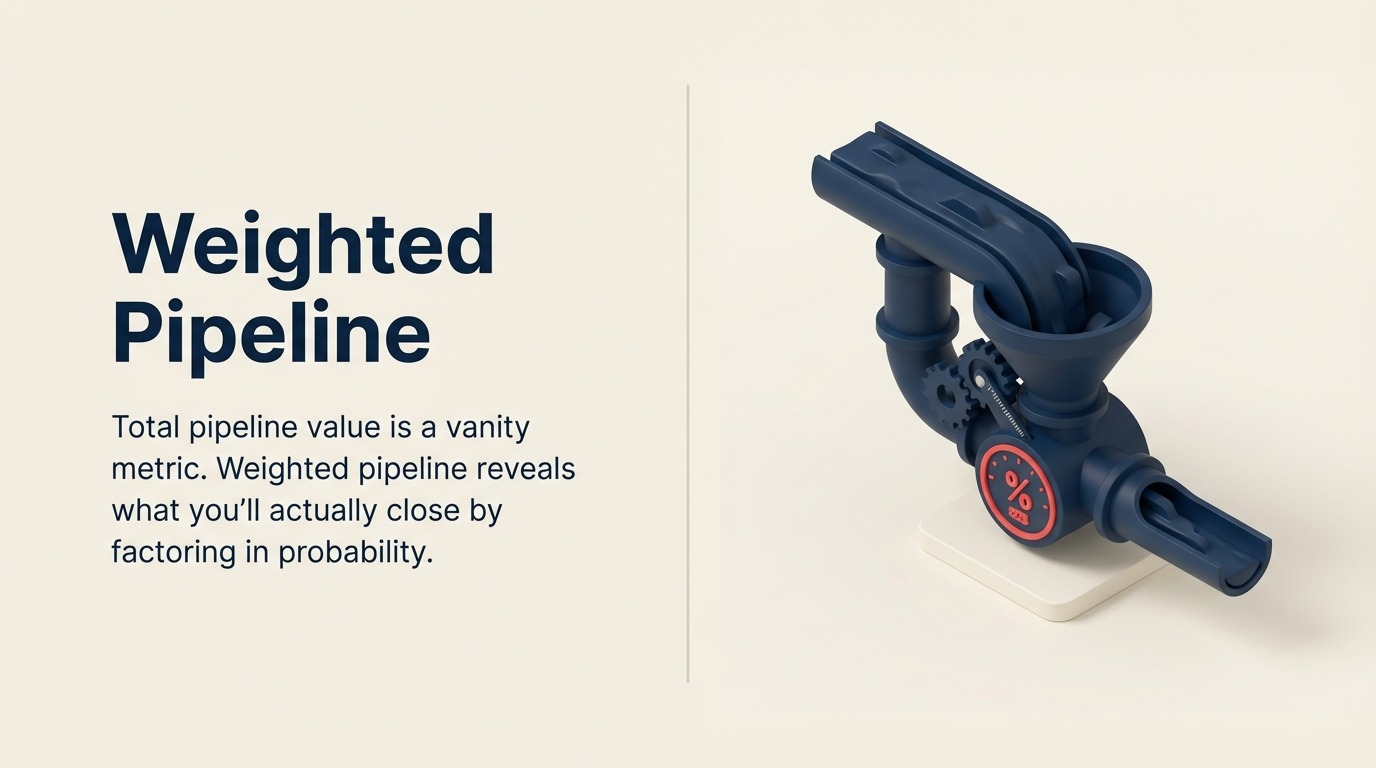
Weighted pipeline solves this by multiplying opportunity value by probability of closing. It's the difference between tracking what's in your pipeline versus what you'll actually book. For CFOs demanding predictable revenue and CROs tired of forecast misses, weighted pipeline isn't optional analytics—it's operational reality.
What is Weighted Pipeline?
Weighted pipeline applies probability multipliers to opportunity values based on how likely they are to close. Instead of adding up all your deals at face value, you calculate the expected value of each one.
The formula is simple:
Weighted Value = Opportunity Value × Close Probability
A $200K opportunity at 30% probability contributes $60K to your weighted pipeline. A $50K opportunity at 80% probability contributes $40K. This probability-adjusted view shows what you'll realistically close, not what you're theoretically chasing.
Why Total Pipeline Misleads
Total pipeline creates three problems:
False security from inflated early-stage deals. A rep with ten $500K opportunities in discovery shows $5 million in pipeline. If discovery converts at 15%, the real value is $750K. That's a massive difference when you're planning quota attainment.
Can't tell quality from quantity. Two reps both show $2 million in pipeline. One has 40 deals averaging 20% probability. The other has 8 deals averaging 70% probability. Total pipeline says they're equal. Weighted pipeline reveals the second rep will close 3-4x more revenue.
Misaligned coverage models. If you use 3x coverage against total pipeline, you're dramatically over-building early stages and under-building late stages. A weighted model right-sizes your coverage by stage probability.
The consequence? Sales leaders make hiring, quota, and territory decisions based on phantom pipeline that evaporates as opportunities mature.
Probability Assignment Methods
Weighted pipeline accuracy depends entirely on probability assignment. Four methods dominate:
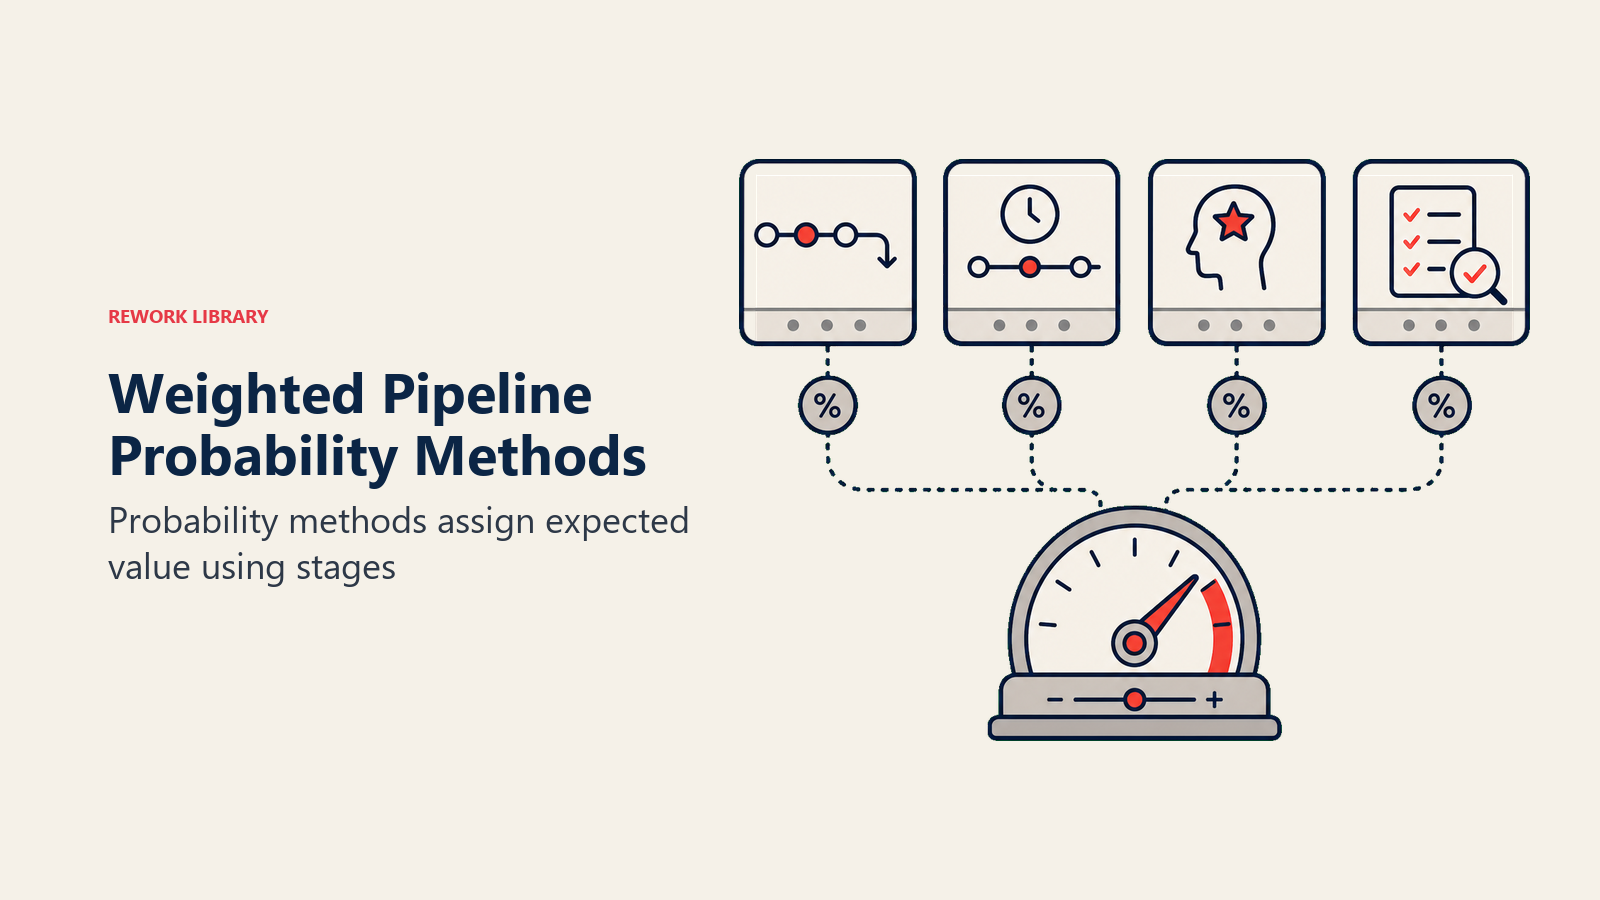
1. Stage-Based Automatic Assignment
The most common approach assigns fixed probabilities to each pipeline stage based on historical conversion rates. When an opportunity advances to "Proposal," it automatically receives the defined probability for that stage (typically 40-50%). This method aligns closely with stage gate criteria that govern deal progression.
Advantages:
- Simple, consistent, requires no rep input
- Easy to implement in CRM workflows
- Creates standardized forecast categories
- Removes individual bias from probability assessment
Disadvantages:
- Ignores deal-specific circumstances (competitive situation, budget timing, champion strength)
- Assumes all opportunities in a stage have equal close likelihood
- Can create gamesmanship around stage progression
- Doesn't adapt to territory or segment differences
Stage-based works best for transactional sales with high deal velocity, consistent buying patterns, and limited rep discretion.
2. Rep Judgment (Manual Override)
Reps manually set close probability based on their assessment of deal health, competitive position, and buyer commitment. This overrides or supplements stage-based defaults.
Advantages:
- Captures deal-specific intelligence (executive support, budget confirmed, competition eliminated)
- Incorporates rep experience and judgment
- Adjusts for unusual circumstances or accelerated timelines
- Reflects real-time changes in deal dynamics
Disadvantages:
- Introduces bias—optimistic reps overstate, pessimistic reps understate
- Inconsistent standards across teams
- Difficult to validate or benchmark
- Can enable sandbagging or aggressive forecasting based on incentives
Manual overrides work when deal complexity and uniqueness make standardized probabilities meaningless—enterprise deals, complex services, custom implementations.
3. AI/ML Predictions
Machine learning models analyze historical deal data to predict close probability based on dozens of signals: deal characteristics, buyer behavior, engagement patterns, sales activities, and historical outcomes.
Advantages:
- Processes far more variables than humans or rules-based systems
- Learns from outcomes to continuously improve accuracy
- Identifies non-obvious predictive patterns
- Removes human bias from probability assessment
Disadvantages:
- Requires significant historical data (typically 2+ years, thousands of opportunities)
- Black box predictions lack transparency
- Can perpetuate historical biases in data
- Struggles with market shifts or new products lacking historical patterns
AI-driven probability works for high-velocity sales organizations with substantial data history and technical sophistication to implement and maintain models.
4. Hybrid Approaches
Most mature forecasting operations use hybrid models that combine multiple methods:
- Stage-based probabilities as baseline
- Rep overrides when specific conditions warrant (approved budget, signed LOI, confirmed implementation date)
- AI models to flag discrepancies between rep assessment and predictive probability
- Manager review of deals where rep override diverges significantly from model prediction
This layered approach balances consistency, judgment, and data-driven prediction while maintaining accountability.
Standard Stage Probabilities
Standard probabilities provide a starting model for weighting pipeline by expected conversion at each stage.

While every sales process differs, industry benchmarks provide starting points for stage-based probability assignment:
Discovery / Initial Contact (10-20%)
The opportunity just entered pipeline. Qualification is preliminary. Buyer expressed interest but hasn't confirmed budget, timeline, or authority. At this stage, most deals will disqualify or stall.
Typical characteristics:
- Initial needs assessment conducted
- Basic fit confirmed (right company size, industry, use case)
- Buyer agreed to exploration conversation
- No budget or timeline validated
Effective opportunity qualification at this stage prevents pipeline bloat from unqualified deals.
Conversion to next stage: 25-35%
Qualification / Needs Analysis (20-30%)
The deal passed initial qualification. Buyer confirmed a genuine problem, rough timeline, and budget range. You've identified key stakeholders and economic buyer. However, competitive alternatives remain, and the buyer hasn't committed to a specific solution approach.
Typical characteristics:
- BANT or MEDDIC qualification completed
- Economic buyer identified and accessible
- Compelling event or business driver confirmed
- Timeline defined (quarter or month)
Conversion to next stage: 40-50%
Proposal / Solution Presentation (40-50%)
The buyer requested a formal proposal or attended a solution presentation. You've presented pricing and implementation approach. The deal has momentum, though objections and competitive pressure remain.
Typical characteristics:
- Formal proposal delivered
- Pricing shared and discussed
- Implementation plan outlined
- Multiple stakeholder meetings occurred
Conversion to next stage: 50-60%
Negotiation / Contract Review (60-75%)
The buyer is actively negotiating terms or reviewing contract language. Legal and procurement teams engaged. The deal will close or be lost based on terms, not fit or value. Discounting and concession discussions underway.
Typical characteristics:
- Marked "Commit" or "Closed Won - Forecast"
- Legal teams reviewing contract
- Procurement negotiating terms
- Executive approval sought
- Implementation timeline discussed
Conversion to next stage: 70-85%
Verbal Commitment / Pending Signature (80-90%)
The buyer verbally committed to purchase. Contract terms agreed. Waiting on signature, final approvals, or payment processing. The deal will close unless extraordinary circumstances arise (budget freeze, executive departure, acquisition).
Typical characteristics:
- Verbal commitment from economic buyer
- All objections resolved
- Terms finalized
- PO number received or signature pending
- Implementation kickoff scheduled
Conversion to close: 85-95%
These probabilities represent averages across B2B sales. Your actual conversion rates—calculated from historical data—should inform your specific probability assignments.
Customizing Probabilities Using Historical Data
Generic stage probabilities are starting points, not gospel. Mature forecasting operations calibrate probabilities based on their actual conversion data.

Calculate Historical Conversion Rates
Pull 12-24 months of closed opportunities (won and lost). For each stage, calculate:
Stage Conversion Rate = (Opportunities that advanced to next stage) / (Total opportunities that reached this stage)
If 250 opportunities reached "Proposal" stage and 125 advanced to "Negotiation," your Proposal → Negotiation conversion is 50%.
Multiply stage conversion rates together to get cumulative close probability from each stage:
Proposal Close Probability = Proposal → Negotiation Rate × Negotiation → Verbal Rate × Verbal → Close Rate
This calculation reveals your actual close rates by stage based on historical outcomes, not industry averages or intuition.
Segment by Deal Characteristics
Aggregate conversion rates mask significant variation. Segment your analysis by:
Deal size: Enterprise deals (>$100K) typically have lower stage probabilities but longer sales cycles than SMB deals (<$25K)
Sales segment: New business converts differently than expansion or renewal opportunities
Industry vertical: Regulated industries (healthcare, financial services) often have lower probabilities at early stages due to complex approval processes
Lead source: Inbound opportunities from high-intent channels (demo requests, pricing inquiries) convert at 2-3x rates of outbound cold opportunities
Rep tenure: Reps in their first year typically have 15-25% lower conversion rates than tenured reps
Build probability matrices that adjust baseline probabilities based on these characteristics. A $200K new business enterprise deal in healthcare might carry 25% probability at Proposal stage, while a $30K expansion deal with an existing customer carries 60% at the same stage. This approach requires effective pipeline segmentation to organize deals by these characteristics.
Track Win Rates by Stage Entry
Beyond stage-to-stage conversion, track ultimate win rate for deals that reach each stage. This reveals the cumulative close probability:
- Opportunities reaching Discovery: 12% ultimately close
- Opportunities reaching Qualification: 28% ultimately close
- Opportunities reaching Proposal: 45% ultimately close
- Opportunities reaching Negotiation: 68% ultimately close
- Opportunities reaching Verbal Commit: 87% ultimately close
These cumulative win rates validate your probability assignments. If opportunities reaching Proposal close 45% of the time, your Proposal stage probability should approximate 45% to produce accurate weighted forecasts.
Weighted vs Unweighted Pipeline: Use Cases
Both weighted and unweighted pipeline views serve distinct purposes:
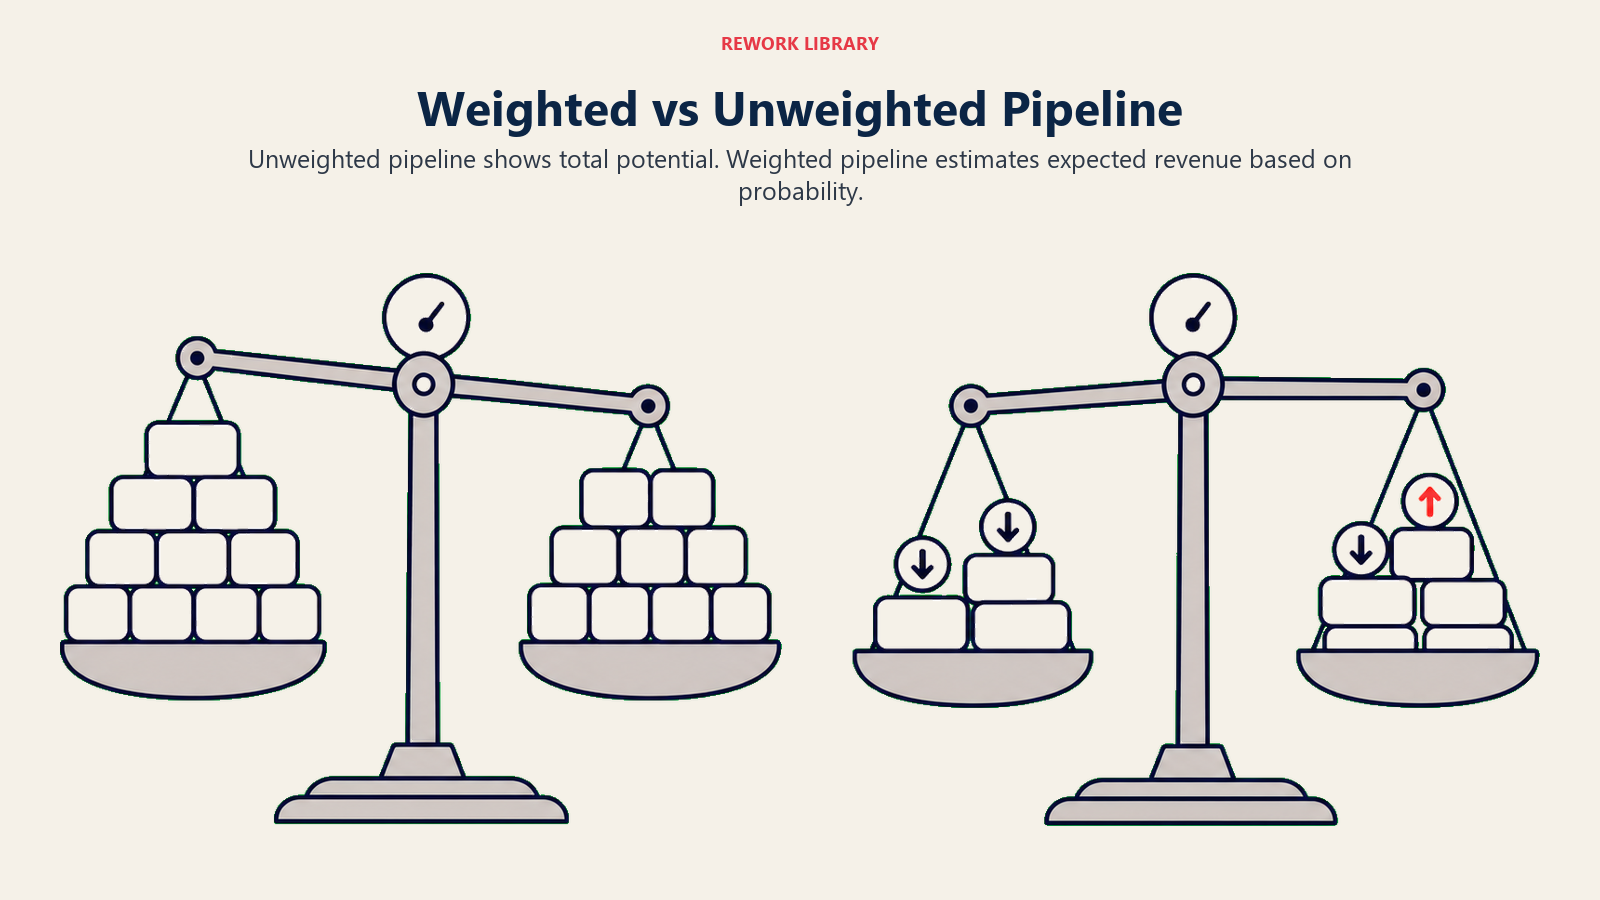
When to Use Unweighted Pipeline
Capacity planning and rep workload: Total opportunity count and value indicate how busy reps are, regardless of close probability. A rep with 60 opportunities requires more time and support than a rep with 15 opportunities, even if weighted values are equal.
Marketing and lead gen targets: Marketing generates top-of-funnel volume. Their success metrics track total pipeline created, not weighted pipeline, since probability assignment happens downstream after qualification.
Early-stage pipeline health: Discovery and qualification stage health matters for future quarters. Unweighted early-stage pipeline predicts weighted late-stage pipeline 2-3 quarters forward.
Incentive design for activity: Some compensation plans reward pipeline generation to drive prospecting activity. Unweighted metrics prevent sandbagging by removing probability manipulation.
When to Use Weighted Pipeline
Revenue forecasting: Weighted pipeline directly correlates to expected bookings. It's the foundation of accurate quota attainment and revenue predictions.
Coverage analysis: Determining required pipeline to hit targets depends on weighted pipeline. If you need $2M in bookings and your weighted pipeline is $1.8M, you have a coverage gap regardless of total pipeline value.
Deal prioritization: Reps should focus on high-probability opportunities approaching close. Weighted value identifies the $50K deal at 80% probability as more valuable than the $200K deal at 15% probability.
Performance evaluation: Rep effectiveness is better measured by weighted pipeline progression than total pipeline inflation. A rep who advances deals through stages improves weighted value even without adding new opportunities. Deal progression management practices directly impact weighted pipeline growth.
Resource allocation: Sales engineering, solutions consulting, and executive sponsorship should prioritize high-probability weighted deals over early-stage long-shots.
The best forecasting systems present both views with clear context on when each applies.
Weighted Pipeline Coverage Analysis
Weighted coverage analysis compares risk-adjusted pipeline against quota and forecast needs.
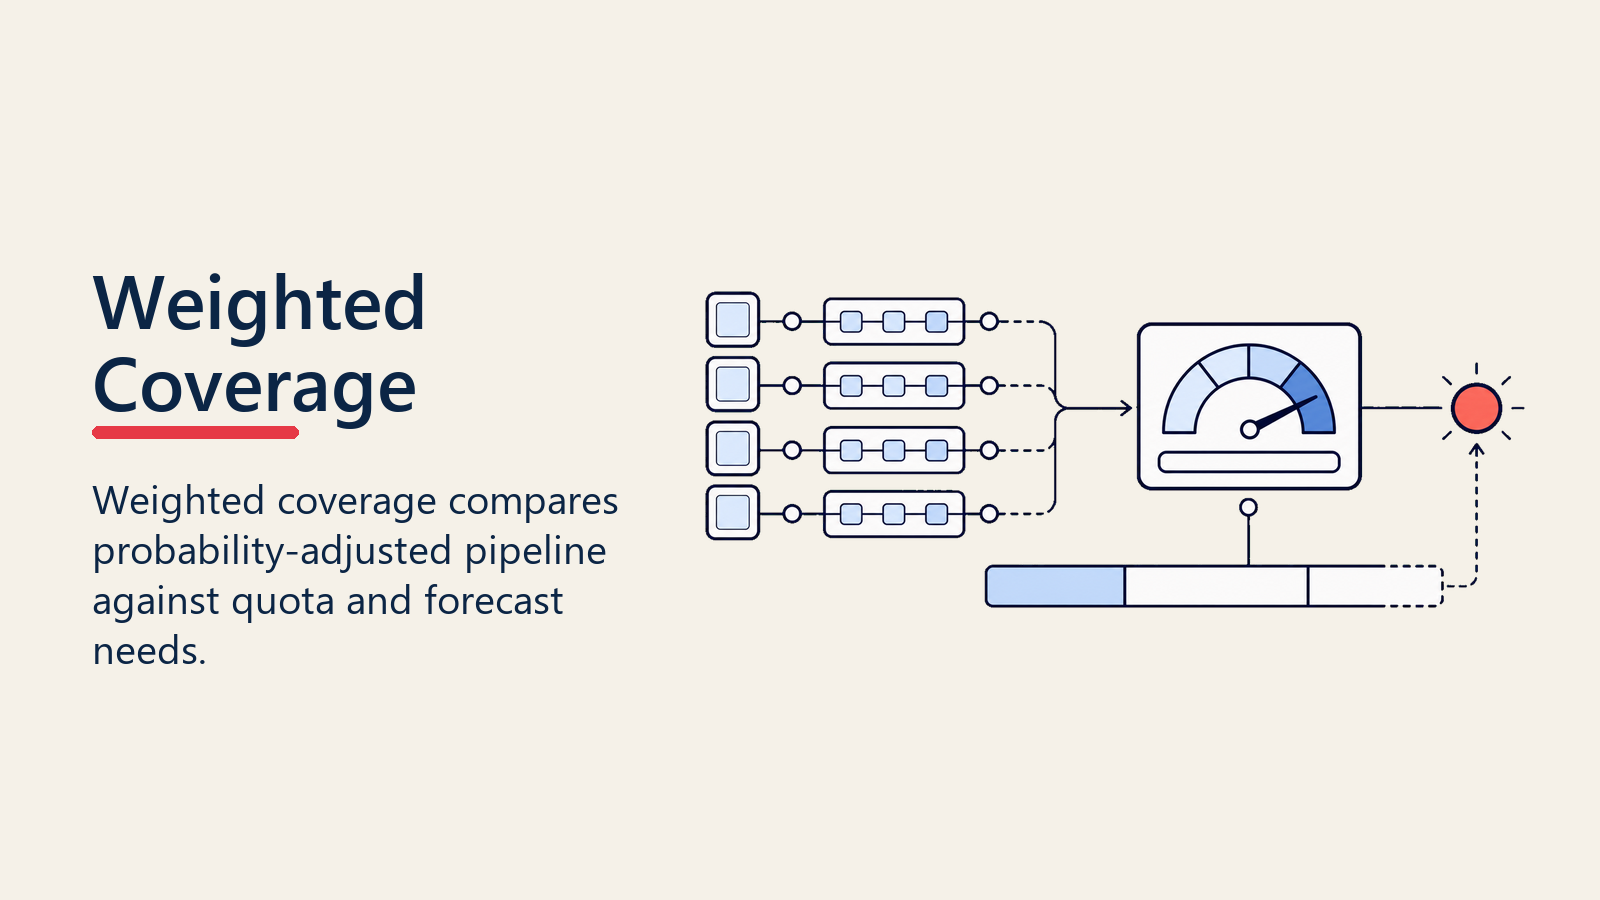
Coverage ratios—the multiple of pipeline required to hit quota—shift dramatically when calculated against weighted vs unweighted pipeline.
Traditional (Unweighted) Coverage
The standard model says you need 3-5x pipeline coverage:
- Quota: $1M
- Required pipeline: $3-5M (total value)
- Assumption: 20-33% of total pipeline closes
This works as a rough heuristic but lacks precision. It doesn't differentiate between $3M of late-stage opportunities (likely to hit target) and $3M of early-stage opportunities (likely to miss significantly).
Weighted Coverage Model
A weighted approach recognizes that required coverage varies by pipeline composition:
If most pipeline is early-stage (avg 20% probability):
- Quota: $1M
- Required weighted pipeline: $1M (to hit target)
- Required total pipeline: $5M (unweighted)
- Coverage multiple: 5x
If most pipeline is late-stage (avg 70% probability):
- Quota: $1M
- Required weighted pipeline: $1M
- Required total pipeline: $1.4M (unweighted)
- Coverage multiple: 1.4x
This reveals why simplistic coverage ratios mislead. The required multiple depends entirely on pipeline quality (stage distribution and close probability).
Stage-Specific Coverage Requirements
Mature pipeline management sets coverage targets by stage:
- Discovery stage: 10x coverage (10% probability)
- Qualification: 4x coverage (25% probability)
- Proposal: 2.5x coverage (40% probability)
- Negotiation: 1.5x coverage (67% probability)
- Verbal commit: 1.1x coverage (90% probability)
A balanced pipeline maintains appropriate coverage at each stage to ensure continuous progression. If Proposal coverage drops below 2x, you'll miss targets even with abundant early-stage pipeline.
Forecast Categories and Weighted Pipeline Integration
Most CRMs use forecast categories to classify deal confidence: Commit, Best Case, Pipeline, Omitted. These categories integrate with weighted pipeline through probability bands:
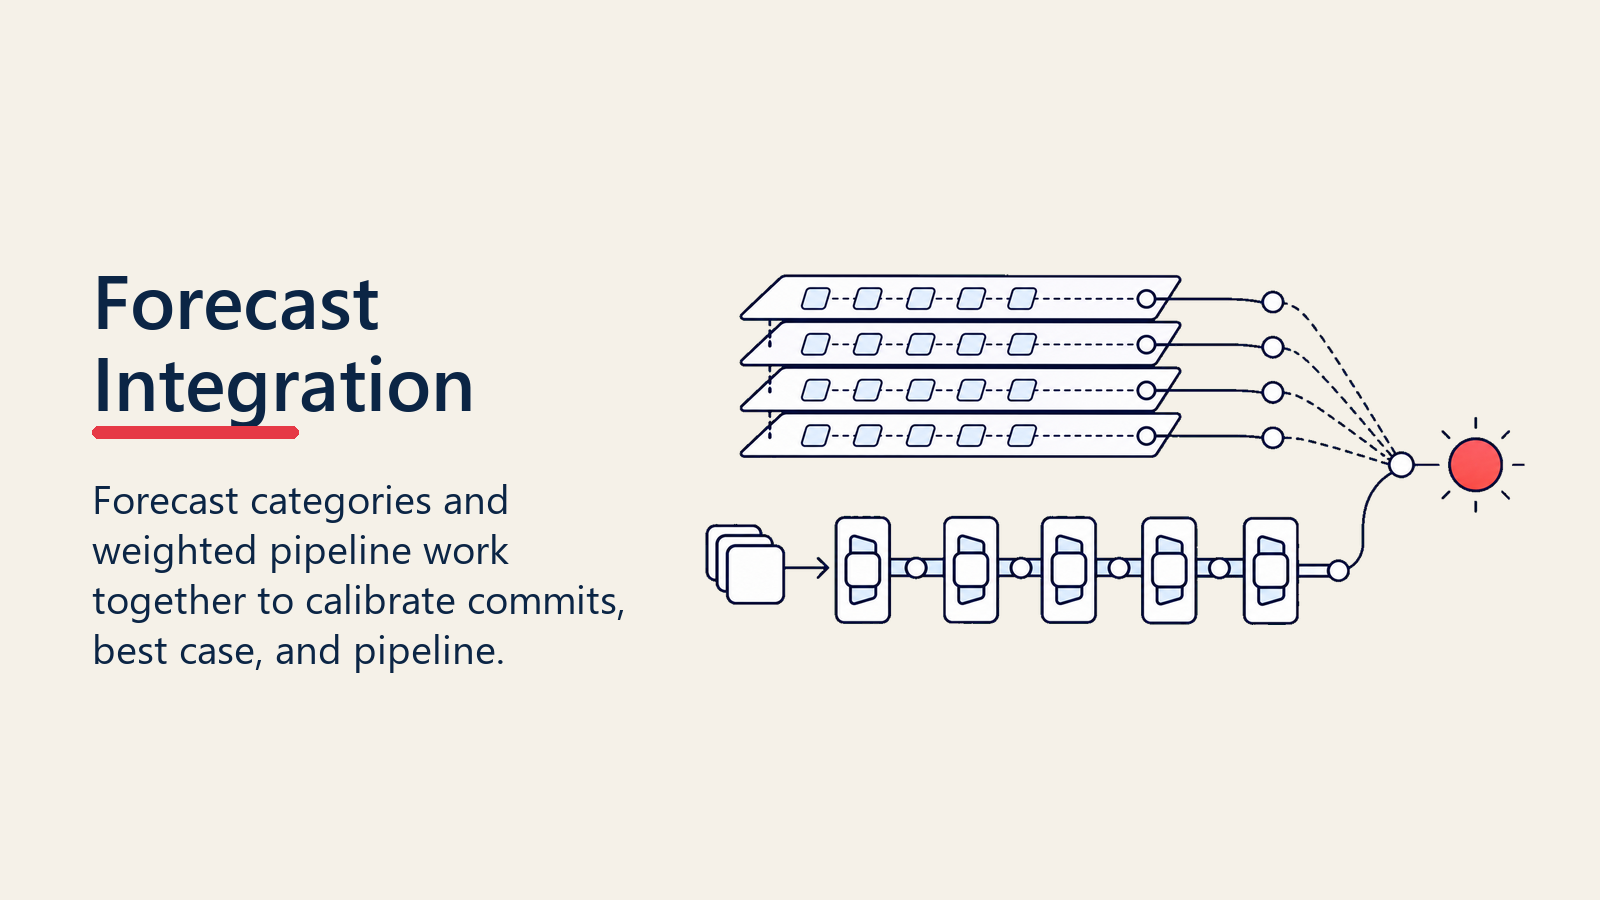
Commit (90-100% probability)
Deals the rep guarantees will close this period. Verbal commitment received, contract in final review, or already won pending signature. These deals comprise the "Commit Forecast" leadership reports to the board.
Weighted pipeline treatment: Full value or near-full value (90-100% multiplier)
Best Case (60-89% probability)
Deals likely to close but not guaranteed. In negotiation or contract review with positive momentum but potential obstacles. Comprise the "Best Case Forecast" (Commit + Best Case).
Weighted pipeline treatment: 60-89% multiplier based on specific stage
Pipeline (1-59% probability)
Early and mid-stage deals. Qualified opportunities with legitimate potential but significant uncertainty. Used for pipeline coverage analysis and future period planning.
Weighted pipeline treatment: 1-59% multiplier based on specific stage
Omitted (0% probability)
Deals the rep believes will not close this period—pushed to future quarters or likely to be lost. Removed from current period forecast but retained in CRM for pipeline visibility.
Weighted pipeline treatment: 0% multiplier (excluded from weighted calculations)
This category-probability alignment ensures forecast roll-ups match weighted pipeline calculations. Your "Commit Forecast" should equal the sum of deals weighted at 90-100%, creating internal consistency between pipeline analysis and forecast reporting.
Probability Overrides: When and How Reps Adjust
While stage-based probabilities provide consistency, deal-specific circumstances warrant manual overrides. The key is establishing clear governance on when overrides are appropriate and requiring justification.

Valid Reasons for Increasing Probability
Budget confirmed in writing: The buyer provided a PO number, approved funding documentation, or written budget confirmation
Competition eliminated: The buyer explicitly stated they're proceeding solely with your solution and have stopped evaluating alternatives
Executive sponsorship secured: A C-level champion is actively driving the deal forward and has committed to specific timeline
Legal review in progress: Contract has moved to legal review, indicating serious intent and internal approval milestone passed
Implementation date scheduled: The buyer scheduled implementation, assigned project manager, or set kickoff date
Valid Reasons for Decreasing Probability
Budget challenged: Finance team pushing back on cost or requesting deferrals to future periods
New stakeholders introduced: Late-stage entry of previously unknown decision-makers who need to be sold
Competitive pressure increased: Strong competitor emerged with compelling differentiation or existing relationship
Timeline slipped: Buyer pushed target decision date without clear justification or new timeline
Champion departed: Internal advocate left the company, was reassigned, or lost influence
Lack of engagement: Buyer stopped responding to outreach or rescheduled meetings multiple times
Override Governance
Establishing guardrails prevents probability manipulation:
Require written justification: Reps must document specific reasons for overrides in CRM notes
Set override limits: Limit override range (e.g., ±20% from stage default) without manager approval
Trigger manager review: Deals with significant overrides (especially increases >20%) appear on manager review queues
Track override accuracy: Measure close rates for overridden deals vs stage-default deals to identify consistent over-optimism or sandbagging
Audit high-value overrides: Any deal >$100K (or your threshold) with probability override requires manager or VP approval
This governance balances rep judgment with organizational consistency and accountability.
Accuracy Tracking and Model Validation
Weighted pipeline only delivers value if probabilities reflect reality. Continuous validation ensures your model produces accurate forecasts.
![]()
Forecast vs Actual Analysis
Each period, compare forecasted revenue (weighted pipeline sum at period start) to actual bookings. Calculate:
Forecast Accuracy Rate = (Actual Bookings / Forecasted Bookings) × 100
Mature organizations target 90-95% forecast accuracy at the "Commit" level and 80-85% at the "Best Case" level.
Track accuracy trends over time. Improving accuracy indicates probability calibration is working. Declining accuracy signals model drift or gaming.
Probability Calibration Testing
For each probability band (0-20%, 21-40%, 41-60%, 61-80%, 81-100%), calculate actual close rates:
If deals assigned 60-80% probability actually close at 45% rate, your probabilities are inflated. If deals assigned 40-60% close at 65%, your probabilities are too conservative.
Ideal calibration: actual close rates match assigned probability bands within 5-10%. Large deviations require probability adjustments.
Stage Progression Analysis
Track how many deals advance from each stage vs how many stall, push, or lose:
- Advanced to next stage: validates probability assessment
- Pushed to future period: indicates probability was too high for current timing
- Lost: confirms deals that shouldn't have carried high probabilities
- Stalled >60 days: suggests dead deals still inflating pipeline
Calculate stage velocity: average days in each stage for won deals vs lost deals. Won deals that close quickly spend less time in early stages. If deals linger in Proposal >45 days, probability should decrease. Understanding pipeline velocity metrics helps calibrate timing-based probability adjustments.
Rep-Level Accuracy Scoring
Measure individual rep forecast accuracy to identify systematic biases:
Optimistic reps: Consistently forecast higher than actual close rates (forecast accuracy <80%)
Sandbagging reps: Consistently deliver above forecast (forecast accuracy >120%)
Accurate reps: Consistently forecast within 10% of actual bookings (90-110% accuracy)
Use this data for coaching, compensation adjustments, and determining how much weight to give rep overrides in aggregate forecasts.
Implementing Weighted Pipeline: Practical Rollout
Moving from total pipeline to weighted pipeline requires technical setup, process change, and organizational alignment.
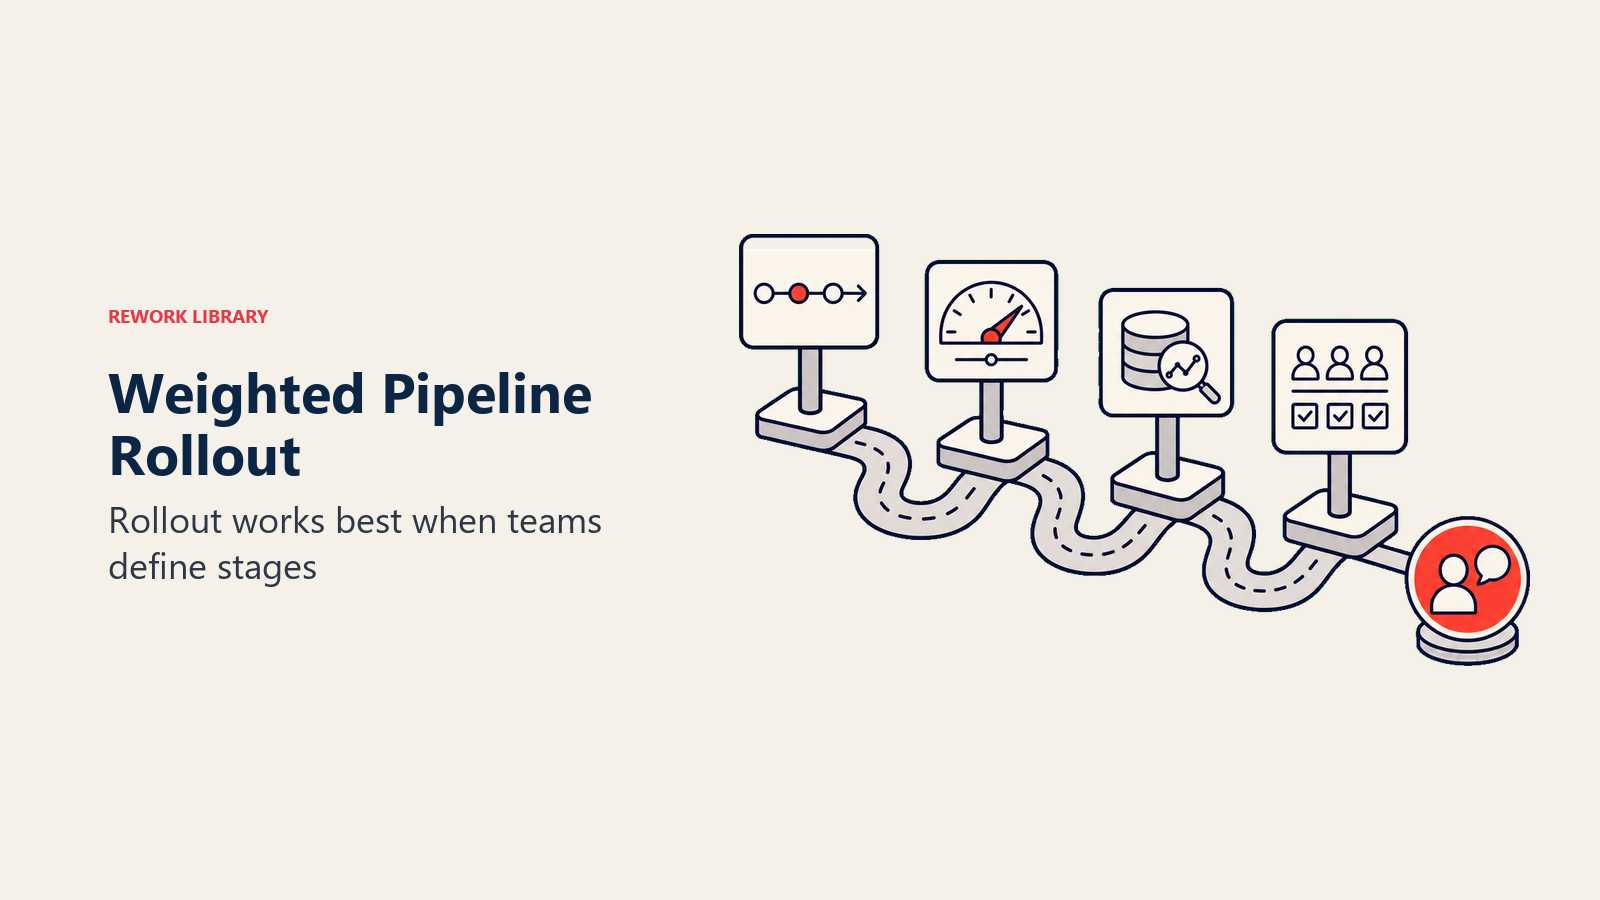
Technical Configuration
CRM setup:
- Configure probability fields by stage with defaults
- Create forecast category mapping to probability bands
- Build weighted pipeline reports and dashboards
- Establish override workflows with approval routing
Data cleanup:
- Remove stale opportunities skewing pipeline (>90 days no activity)—see pipeline hygiene best practices
- Standardize stage definitions and entry criteria
- Backfill historical probability data for accuracy baseline
Process Implementation
Define stage entry criteria: Clear, objective criteria determine when opportunities advance (not just rep discretion)
Set override policies: Document when manual probability adjustments are appropriate and required approval levels
Establish forecast cadence: Weekly rep forecast submissions, manager roll-ups, and variance analysis
Create review rituals: Pipeline reviews focus on weighted value, coverage by stage, and deal progression
Organizational Change Management
Sales team training: Explain why weighted pipeline produces better forecasts and how it changes their forecast submissions
Manager enablement: Train managers on probability calibration, override governance, and coaching reps on accurate forecasting
Executive alignment: Ensure leadership understands weighted vs unweighted metrics and which to use for different decisions
Incentive alignment: Consider incorporating weighted pipeline attainment into compensation to reward quality over quantity
The transition takes 1-2 quarters. Early periods will show forecast volatility as probabilities calibrate and behaviors adjust. Persist through this adjustment period—accuracy improves dramatically by quarter three.
Conclusion: From Gut Feel to Statistical Forecast
The difference between companies that hit targets consistently and those that swing wildly? Forecast methodology. Total pipeline offers comforting abundance while masking reality. Weighted pipeline forces honesty about what will actually close.
Probability-based forecasting transforms pipeline management from subjective art to measurable science. It shifts conversations from "Do we have enough pipeline?" (meaningless without context) to "Do we have enough weighted coverage in Proposal stage to hit Q3 targets?" (actionable and specific).
Organizations that implement disciplined weighted pipeline methodology gain three advantages:
Predictable revenue: Your forecasts become reliable enough to drive hiring, investment, and board commitments.
Efficient resource allocation: Sales support, executive engagement, and deal acceleration resources flow to high-probability opportunities.
Accurate capacity planning: Territory design, quota setting, and headcount decisions based on realistic pipeline conversion rather than inflated totals.
The implementation requires technical configuration, process discipline, and cultural change. But the alternative—continuing to forecast based on hope and aggregate totals—guarantees continued volatility and missed targets.
Weighted pipeline isn't perfect. Probabilities will never capture every deal nuance. But it's way more accurate than pretending every opportunity is equally likely to close. In forecasting, being approximately right beats being precisely wrong.
Your CFO demanding predictable revenue, your CRO tired of forecast misses, and your board expecting consistent growth all need the same thing: probability-weighted reality instead of total pipeline fantasy.
Ready to implement probability-based forecasting? Explore pipeline metrics overview and stage-based forecasting to build a complete forecasting system.
Related Resources

Senior Operations & Growth Strategist
On this page
- What is Weighted Pipeline?
- Why Total Pipeline Misleads
- Probability Assignment Methods
- 1. Stage-Based Automatic Assignment
- 2. Rep Judgment (Manual Override)
- 3. AI/ML Predictions
- 4. Hybrid Approaches
- Standard Stage Probabilities
- Discovery / Initial Contact (10-20%)
- Qualification / Needs Analysis (20-30%)
- Proposal / Solution Presentation (40-50%)
- Negotiation / Contract Review (60-75%)
- Verbal Commitment / Pending Signature (80-90%)
- Customizing Probabilities Using Historical Data
- Calculate Historical Conversion Rates
- Segment by Deal Characteristics
- Track Win Rates by Stage Entry
- Weighted vs Unweighted Pipeline: Use Cases
- When to Use Unweighted Pipeline
- When to Use Weighted Pipeline
- Weighted Pipeline Coverage Analysis
- Traditional (Unweighted) Coverage
- Weighted Coverage Model
- Stage-Specific Coverage Requirements
- Forecast Categories and Weighted Pipeline Integration
- Commit (90-100% probability)
- Best Case (60-89% probability)
- Pipeline (1-59% probability)
- Omitted (0% probability)
- Probability Overrides: When and How Reps Adjust
- Valid Reasons for Increasing Probability
- Valid Reasons for Decreasing Probability
- Override Governance
- Accuracy Tracking and Model Validation
- Forecast vs Actual Analysis
- Probability Calibration Testing
- Stage Progression Analysis
- Rep-Level Accuracy Scoring
- Implementing Weighted Pipeline: Practical Rollout
- Technical Configuration
- Process Implementation
- Organizational Change Management
- Conclusion: From Gut Feel to Statistical Forecast
- Related Resources