BCG Matrix: Definition, Examples & Free Template (2026)
Turn this article into takeaways for your work.


Each assistant summarizes the article only for you and suggests best practices for your work.
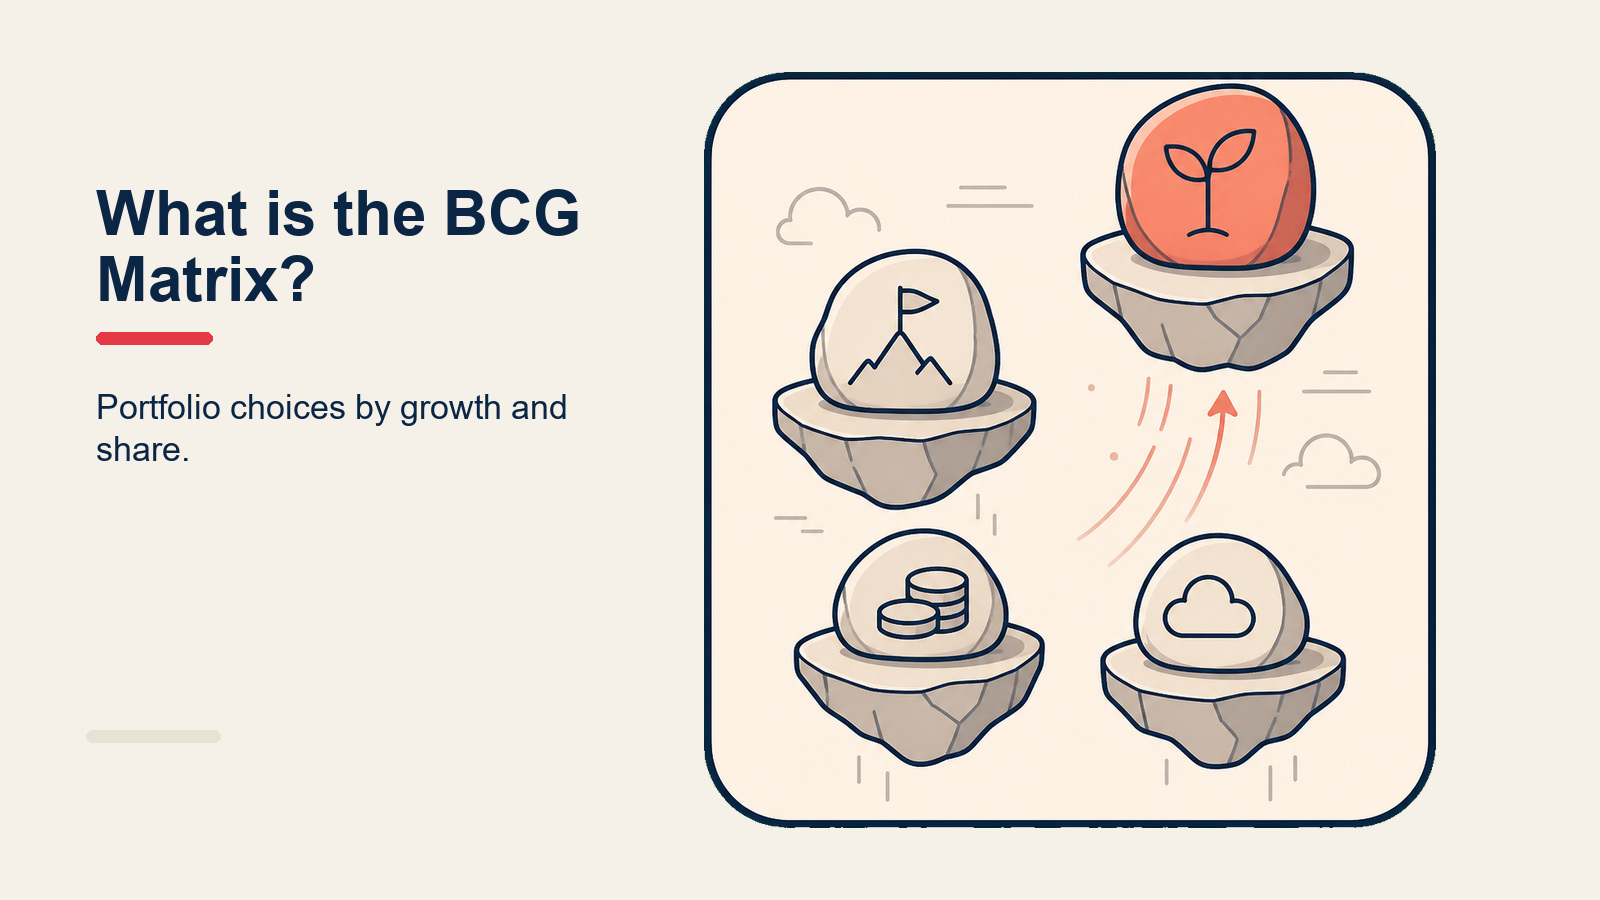
The BCG matrix (also called the growth-share matrix) is a 2x2 portfolio tool that plots each product or business unit by market growth rate and relative market share. It sorts them into Stars, Cash Cows, Question Marks, and Dogs, so leaders can decide where to invest, hold, harvest, or divest.
This guide covers the definition, the four quadrants, a five-step method, a worksheet you can copy into a spreadsheet, two worked examples, and a straight look at where the matrix misleads people.
What is the BCG matrix?
The BCG matrix is a strategic management tool from the Boston Consulting Group (BCG). It answers one question: with limited cash and attention, which of our products deserve more of both?
BCG's own history page credits Alan Zakon with sketching the original concept, and says BCG founder Bruce Henderson popularized it in his 1970 essay "The Product Portfolio". The matrix rests on one belief from that essay: market leaders earn better returns because the leader gets a self-reinforcing cost advantage that competitors struggle to copy. Henderson's essay makes the same point about cash: margins and cash generated are a function of market share, and high-growth products need cash inputs while low-growth products should throw cash off.
So the matrix is really a cash-flow map. It shows which products make cash, which products eat it, and whether the portfolio as a whole is in balance.
The two axes
- Vertical axis: market growth rate. How fast the market your product sells into is growing. It measures how much cash a product will need to keep up.
- Horizontal axis: relative market share. Your share divided by the share of your largest competitor. It measures how much cash a product is likely to generate.
Relative share matters more than absolute share. A 20% share is a commanding lead in a market where the next player holds 8%, and a distant second in a market where the leader holds 60%.
The SBU concept
Each dot on the matrix is usually a Strategic Business Unit (SBU): a product line, a single product, or a brand that has its own market, competitors, and P&L. A company with five product lines has five SBUs to plot. The unit of analysis is a judgment call, and it changes the answer, so settle it before you collect any data.
The four quadrants of the BCG matrix
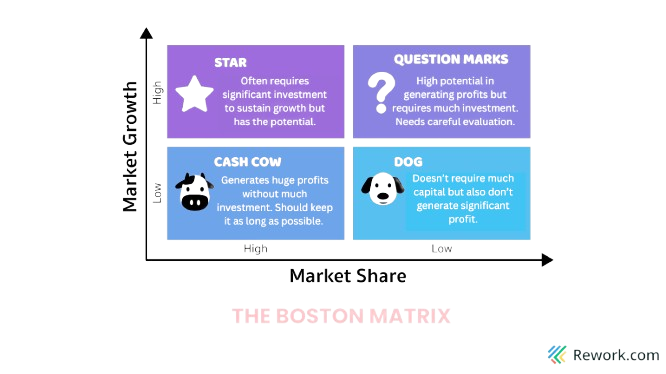
Every product lands in one of four boxes, and each box implies a default move. Use the defaults as a starting point for a discussion, not as the answer.
| Quadrant | Market growth | Relative share | Cash profile | Default strategy |
|---|---|---|---|---|
| Star | High | High | Earns a lot, spends a lot | Invest to hold leadership |
| Cash Cow | Low | High | Earns more than it needs | Harvest, fund the rest of the portfolio |
| Question Mark | High | Low | Spends far more than it earns | Build selectively or exit |
| Dog | Low | Low | Barely covers itself | Divest, reposition, or run for cash |
BCG's own summary of the matrix gives the same defaults in plain words: significantly invest in stars, milk cash cows for cash to reinvest, invest in or discard question marks depending on their chances of becoming stars, and liquidate, divest, or reposition the low-share, low-growth units. Note that BCG calls the fourth box "pets" on that page, and "dogs" is the name most people use.
Stars: high growth, high share
Stars lead a fast-growing market. They're often profitable on paper but cash-hungry in practice, because defending the lead in a growing market costs money: capacity, sales headcount, product development, marketing.
Strategy: Hold (invest to keep the lead). Reinvest what the Star earns, and top it up from Cash Cows when needed. Henderson's essay says a Star becomes a large cash generator when growth slows and its reinvestment needs shrink. The risk is under-investing, letting a competitor take the lead, and watching a future Cash Cow become a Dog.
Cash Cows: low growth, high share
Cash Cows are mature leaders. They've got the scale advantage, the brand, and the customer base, and the market isn't growing fast enough to demand heavy reinvestment. Henderson describes them as products that generate large amounts of cash, in excess of the reinvestment required to maintain share.
Strategy: Harvest (maximize cash flow). Protect the position, cut waste, and move the surplus to Stars and the best Question Marks. Don't starve a Cash Cow so hard that it loses share, because the cash stops flowing. Watch for the day growth turns negative, which usually signals the product is moving toward the end of its product life cycle.
Question Marks: high growth, low share
Question Marks (also called problem children) sit in attractive markets but hold a weak position. They almost always need more cash than they make. Henderson is blunt about it: they almost always require far more cash than they can generate.
Strategy: Build or exit. There's no safe middle. Either fund the product enough to win real share and turn it into a Star, or stop funding it. A Question Mark that gets a little cash and no clear plan slides into the Dog box while still consuming budget. Pick two or three at most, and set a decision date.
Dogs: low growth, low share
Dogs are weak positions in slow markets. They tie up management time, shelf space, and engineering hours without producing much cash.
Strategy: Divest, reposition, or milk quietly. Sunset the product, sell it, or fold it into a bundle. There are exceptions. A Dog can be worth keeping when it protects a relationship with a key customer, completes a bundle, or blocks a competitor. Name the reason in writing, and review it every year.
How to make a BCG matrix in 5 steps
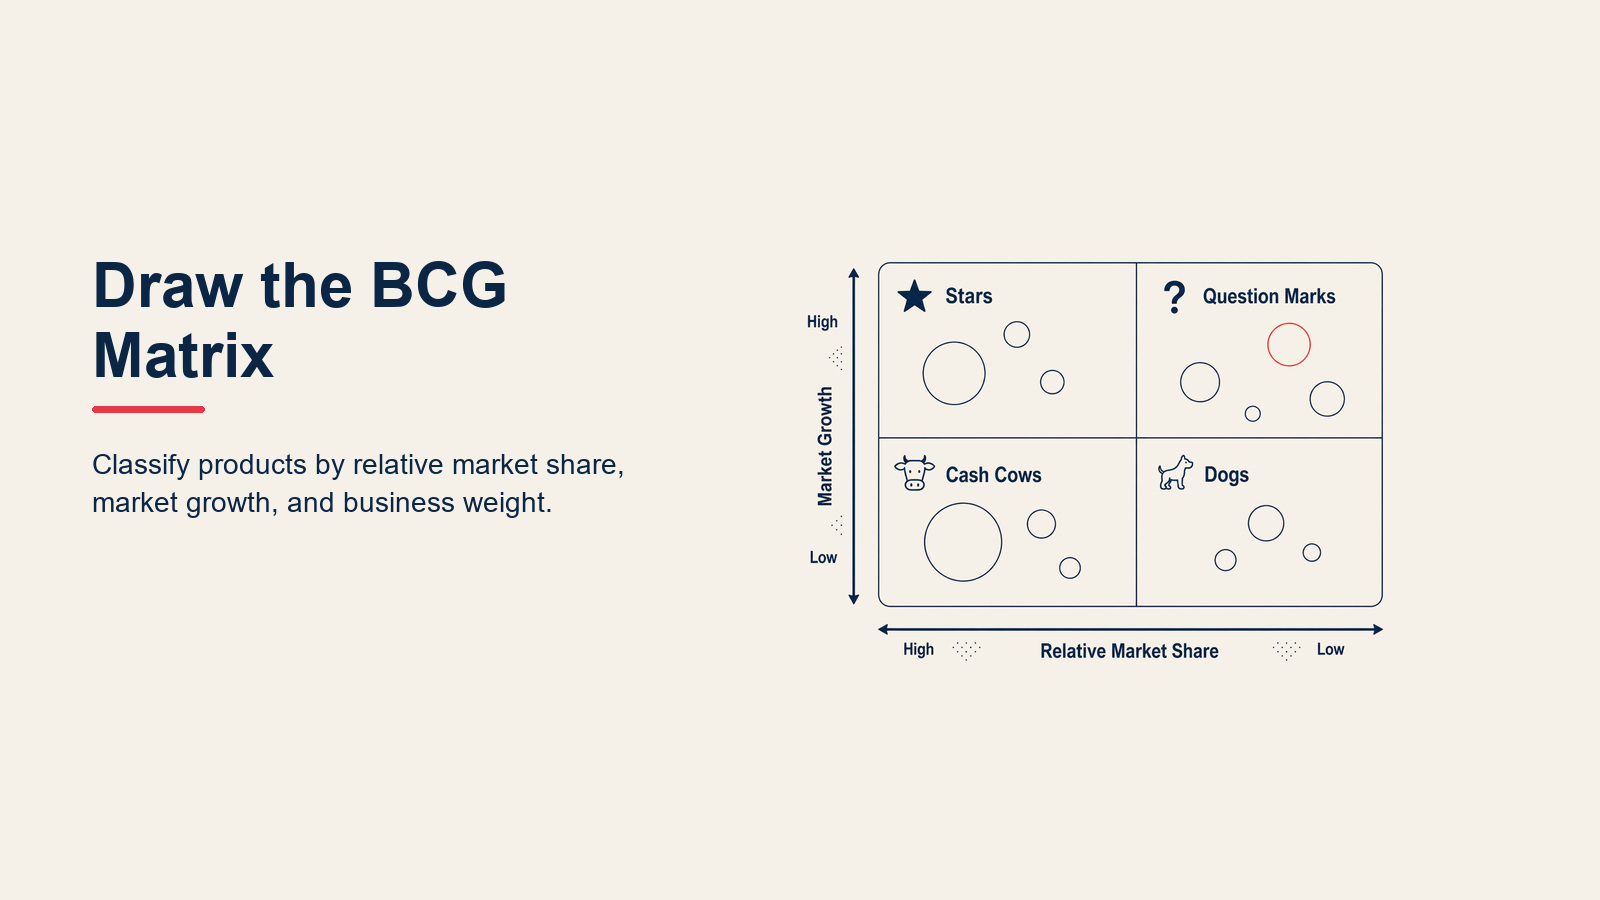
You need revenue data for your own products, revenue (or share) data for the top competitor in each market, and a size or growth figure for each market. A spreadsheet is enough.
Step 1: Choose the units to analyze
Decide what counts as one dot: a product, a product line, a brand, or a business unit. Keep the level consistent. Mixing a whole division with a single feature gives you a chart that can't be compared.
Aim for 4 to 12 units. Fewer than four doesn't need a matrix, and more than a dozen turns the chart into noise.
Step 2: Define the market for each unit
Each unit needs its own market definition, and this is where most BCG matrices go wrong. The same product can be a leader in a narrow market and a minor player in a broad one.
Here's an illustration. A premium watch maker holds a small slice of the global watch market, so it looks like a Dog there. Measured against the luxury watch segment where it actually competes, it may be the leader, which makes it a Cash Cow. The product didn't change. The market definition did, and so did the strategy.
Define the market the way a customer would: the set of products they'd realistically compare before buying. Write the definition next to each unit so a colleague can challenge it.
Step 3: Calculate relative market share
Relative market share compares your sales with those of your largest competitor in the same market, over the same period.
Relative market share = your product's sales / the largest competitor's sales
- If you sell $50 million and the top competitor sells $100 million, your relative share is 0.5.
- If you're the market leader, divide by the next-largest competitor instead. Selling $60 million against a runner-up at $40 million gives 1.5.
A result above 1.0 means you lead the market. Below 1.0 means someone is ahead of you. Many teams plot this axis on a log scale, since the gap between 0.1 and 0.2 matters as much as the gap between 1.0 and 2.0.
Step 4: Calculate market growth rate
Market growth rate is the growth of the whole market, not your own product's growth.
Market growth rate = (this year's market size - last year's market size) / last year's market size
If the market was $400 million last year and is $440 million this year, growth is 10%. Use the same measure (revenue or units) in both years, and adjust for inflation if the period is long. If you can't get the total market size, a defensible proxy is the average growth of the top few players.
Step 5: Plot the units and decide
Draw the grid, then set the cutoffs. Write the cutoffs down, because they're a choice and someone will ask:
- Horizontal cutoff (relative share): 1.0 is the natural line, since it separates leaders from followers.
- Vertical cutoff (market growth): there's no universal number. A common convention is 10% or the average growth rate of your industry. Use a figure that reflects the markets you actually compete in.
Then plot each unit as a circle. Put relative share on the X-axis and market growth on the Y-axis. Size each circle by the unit's revenue so the chart shows how much of the company sits in each box. Label each unit with its quadrant and its default strategy, then argue about the exceptions.
BCG matrix template: a worksheet you can copy
Copy this table into a spreadsheet and fill one row per unit. The last four columns are formulas you can add once the inputs are in.
Worksheet
| Unit (product or line) | Market definition | Market size last year | Market size this year | Market growth % | Our sales | Top competitor sales | Relative share | Share of our revenue | Quadrant | Planned move |
|---|---|---|---|---|---|---|---|---|---|---|
Spreadsheet formulas (assume this year's market size is in column D, last year's in column C, your sales in F, top competitor's in G):
| Column | Formula |
|---|---|
| Market growth % | =(D2-C2)/C2 |
| Relative share | =F2/G2 |
| Share of our revenue | =F2/SUM($F$2:$F$12) |
| Quadrant | =IF(H2>=1,IF(E2>=0.1,"Star","Cash Cow"),IF(E2>=0.1,"Question Mark","Dog")) |
Change the 0.1 in the quadrant formula to your own growth cutoff.
Decision rules to attach to the worksheet
| Quadrant | Question to answer before you decide | Owner | Review date |
|---|---|---|---|
| Star | What would it take to hold the lead for 3 more years, and can Cash Cows fund it? | ||
| Cash Cow | How much cash can we pull out without losing share? Where does it go? | ||
| Question Mark | Do we have a credible path to a leading share in 2 to 3 years? If not, why are we funding it? | ||
| Dog | Why do we still sell this? Is there a strategic reason, or just habit? |
The "owner" and "review date" columns are the part most teams skip, and they're the part that turns a diagram into a decision.
BCG matrix examples
Example 1: a mid-market B2B software company (illustrative)
This is a made-up company, used to show the arithmetic end to end. All numbers are illustrative, not real market data.
A B2B software company has five product lines and $34 million in revenue. The team uses a relative share cutoff of 1.0 and a market growth cutoff of 10%.
| Product line | Market growth | Our sales | Top competitor sales | Relative share | Share of our revenue | Quadrant |
|---|---|---|---|---|---|---|
| Pipeline Cloud (core CRM add-on) | 4% | $14.0M | $10.0M | 1.4 | 41% | Cash Cow |
| Insights Analytics | 22% | $9.0M | $7.5M | 1.2 | 26% | Star |
| Automation Studio | 25% | $2.0M | $16.0M | 0.125 | 6% | Question Mark |
| Legacy Reporting | 1% | $3.0M | $12.0M | 0.25 | 9% | Dog |
| Onboarding Services | 3% | $6.0M | $5.0M | 1.2 | 18% | Cash Cow |
What the matrix says:
- Pipeline Cloud and Onboarding Services are Cash Cows and together make up 59% of revenue. They fund the rest. The plan is to protect their share and cut unnecessary cost, not to grow them with heavy spend.
- Insights Analytics is the Star. It leads a market growing at 22%, and it should get first call on the surplus from the Cash Cows. Hiring ahead of demand is cheaper than losing the lead.
- Automation Studio is a Question Mark with a relative share of 0.125 in a fast market. The team gives it a capped budget and a decision point in two quarters. If the share doesn't move toward 0.5, it stops.
- Legacy Reporting is a Dog. The plan is a 12-month sunset, with customers migrated to Insights Analytics. That frees engineers who currently maintain it.
The pattern to notice: 59% of revenue sits in markets growing at 3% to 4%, and the only Star is 26% of revenue. That is a healthy cash engine with a thin growth pipeline.
If the revenue figures behind a table like this live in your CRM, a per-product-line pipeline report makes the refresh a ten-minute job instead of a spreadsheet hunt. Rework's Sales Ops is one example of a CRM where that kind of report is straightforward to set up.
Example 2: Coca-Cola (outside-in illustration)
Large consumer brand portfolios are a popular BCG case, because they mix mature leaders with fast-growing newcomers. The graphic below shows one common way analysts place Coca-Cola's brand families on the matrix.
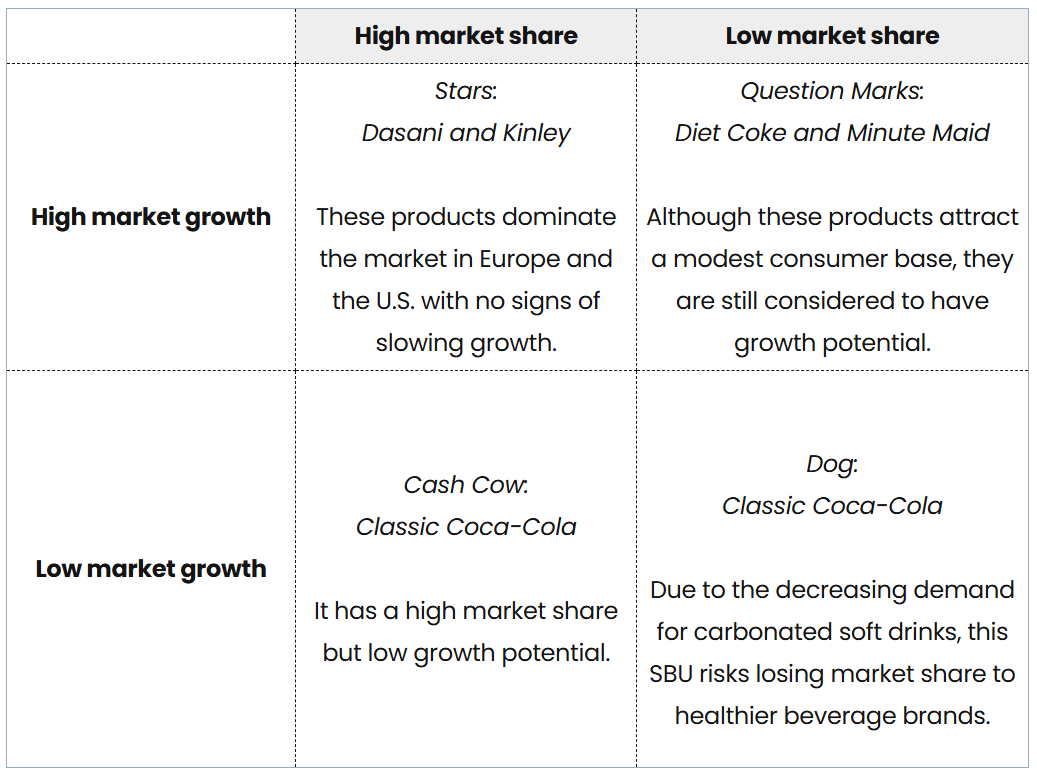
Treat it as an outside-in illustration, not company data. Coca-Cola doesn't publish growth and relative share by brand in the form the matrix needs, so any such chart relies on analyst estimates and a chosen market definition. The method, rather than the exact placement, is the lesson: classic soft drinks read as mature leaders, newer categories read as fast-growing with lower share, and the real debate is how each brand's market is defined.
Example 3: marketing channels
The same logic works for budgets. Plot each marketing channel by its growth in results and its share of total pipeline: fund fast-growing, high-share channels first, run the steady big ones efficiently, test small fast-growing ones with a fixed budget, and cut the small flat ones. It's a loose adaptation, not the original matrix.
BCG vs GE-McKinsey vs Ansoff
These three tools get mixed up because all of them are grids that help decide where to put resources. They answer different questions.
| BCG matrix | GE-McKinsey matrix | Ansoff matrix | |
|---|---|---|---|
| Question it answers | Which existing units should get cash? | Which units are strongest in the most attractive markets? | Which growth route should we take next? |
| Axes | Market growth and relative market share | Industry attractiveness and competitive strength | Existing vs new products, existing vs new markets |
| Grid | 2x2 | 3x3 | 2x2 |
| Inputs | Two numbers per unit | A weighted score across several factors | A strategic choice, not a score |
| Best for | Fast portfolio screen, cash allocation | Nuanced multi-factor portfolio review | Choosing a growth strategy |
| Weakness | Oversimplifies | Takes longer, scoring is subjective | Doesn't rank current units |
In short, use BCG for a quick cash-allocation view, use the GE-McKinsey matrix when two numbers feel too thin, and use the Ansoff matrix to decide where to grow once you know which units deserve investment. The deeper side-by-side is in BCG matrix vs GE-McKinsey matrix.
Limitations of the BCG matrix
The matrix is useful because it's simple, and it's risky for the same reason.
- It oversimplifies. Two axes and four boxes squeeze a complicated business. Many units sit near a cutoff, and a small change in the line moves them to a different box with a different strategy.
- Market definition drives the answer. Change the market, and the same product flips quadrant. The result looks objective, but one choice at the start decides it.
- Share isn't the same as profit. The matrix assumes share buys cost advantage, which is Henderson's logic. In some industries share doesn't produce a cost edge, and a leader can earn thin margins.
- Growth isn't the only sign of attractiveness. A fast market can be unprofitable if competition is brutal. Pair the matrix with an industry view like Porter's Five Forces.
- It ignores links between units. A Dog may supply a component a Star depends on. Cutting it breaks something that the chart can't see.
- It's a snapshot. The matrix describes today's position. It doesn't forecast, and it doesn't consider new entrants, regulation, or technology shifts. Use a SWOT analysis and a PESTEL analysis alongside it.
Common mistakes
- Defining the market too broadly or too narrowly. Too broad makes every product look like a Dog. Too narrow makes everything look like a Star.
- Using your own growth instead of market growth. A product growing 30% in a market growing 40% is losing share, not winning.
- Comparing against the wrong competitor. Relative share uses the largest competitor in that market, not the competitor you happen to watch most closely.
- Treating the default strategy as an order. "Dog means divest" skips the question of why you still sell it.
- Starving the Cash Cow. Harvesting too hard erodes share, and the cash disappears with it.
- Funding every Question Mark a little. Spread thin, none of them reach the share needed to become a Star.
BCG matrix do's and don'ts
Do
- Do define each market in writing and let a colleague challenge it before you plot anything.
- Do use relative share, not absolute share. It's the number the model is built on.
- Do state your cutoffs (for example 1.0 for share, a stated percentage for growth) so the result can be reproduced.
- Do attach an owner and a review date to every decision, using the template above.
- Do pair it with other tools. Use SWOT, PESTEL, and industry analysis for the factors the matrix can't see.
- Do re-run it on a schedule, at least once a year and after any big market shift. It's a strong input for resource allocation decisions each planning cycle.
Don't
- Don't treat the quadrant as the decision. It's the start of the conversation.
- Don't ignore cash timing. A Question Mark may need more cash than you have, even if the strategy is right.
- Don't confuse the matrix with a forecast. It describes where you are, not where you'll be.
- Don't keep a Dog by default. If you keep it, write down why.
Put the matrix to work
The BCG matrix works best as a recurring habit: collect the same two numbers each year, plot the same units, and watch how they move between boxes. A Question Mark that crosses into Star territory is proof the investment worked. A Cash Cow drifting toward the Dog box is an early warning.
Start with the worksheet above, fill five rows, and set a review date. That alone gives your next planning meeting more structure than most.

Co-Founder & COO
On this page
- What is the BCG matrix?
- The two axes
- The SBU concept
- The four quadrants of the BCG matrix
- Stars: high growth, high share
- Cash Cows: low growth, high share
- Question Marks: high growth, low share
- Dogs: low growth, low share
- How to make a BCG matrix in 5 steps
- Step 1: Choose the units to analyze
- Step 2: Define the market for each unit
- Step 3: Calculate relative market share
- Step 4: Calculate market growth rate
- Step 5: Plot the units and decide
- BCG matrix template: a worksheet you can copy
- Worksheet
- Decision rules to attach to the worksheet
- BCG matrix examples
- Example 1: a mid-market B2B software company (illustrative)
- Example 2: Coca-Cola (outside-in illustration)
- Example 3: marketing channels
- BCG vs GE-McKinsey vs Ansoff
- Limitations of the BCG matrix
- Common mistakes
- BCG matrix do's and don'ts
- Do
- Don't
- Put the matrix to work