Balanced Scorecard: The 4 Perspectives and How to Build One
Turn this article into takeaways for your work.
Each assistant summarizes the article only for you and suggests best practices for your work.
Most executive dashboards are 90% revenue and 10% everything else that actually drives revenue. The balanced scorecard fixes that. It forces you to track the leading indicators (customer experience, internal operations, team capability) alongside the lagging ones (profit, growth), so you see problems before they show up in the financials.
What is the balanced scorecard?
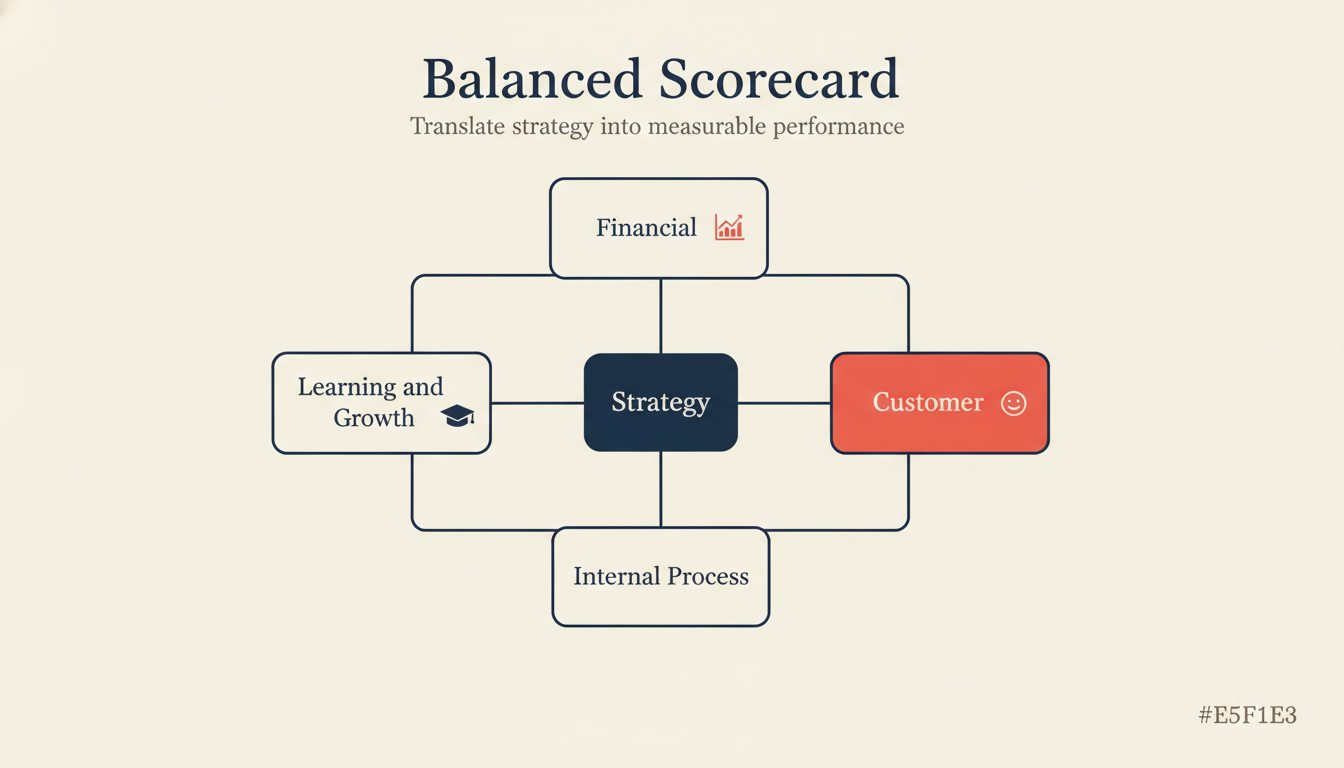
The balanced scorecard is a strategy execution framework developed by Robert S. Kaplan and David P. Norton, introduced in their 1992 Harvard Business Review article "The Balanced Scorecard: Measures That Drive Performance." It translates strategy into four perspectives: Financial, Customer, Internal Process, and Learning and Growth (L&G). Each perspective contains four components: objectives (what you want to achieve), measures (the key performance indicators, or KPIs, you'll track), targets (the specific numbers you're aiming for), and initiatives (the programs or projects that will close the gap).
The core insight is that financial results are outputs of earlier decisions. By the time revenue drops, the customer experience problems that caused it happened months ago. Measuring only financial outcomes is like driving using only the rearview mirror.
Key Facts
- Robert S. Kaplan and David P. Norton introduced the balanced scorecard in the Harvard Business Review (HBR), January-February 1992 issue, "The Balanced Scorecard: Measures That Drive Performance."
- Kaplan and Norton expanded the framework in their 1996 book The Balanced Scorecard: Translating Strategy into Action, Harvard Business School Press, which became the canonical implementation guide used by thousands of organizations globally.
- According to the 2017 Bain & Company Management Tools survey, the balanced scorecard ranked among the top 10 most-used management tools globally, with usage rates above 35% among large enterprises surveyed, reflecting more than two decades of sustained adoption.
The 4 perspectives explained
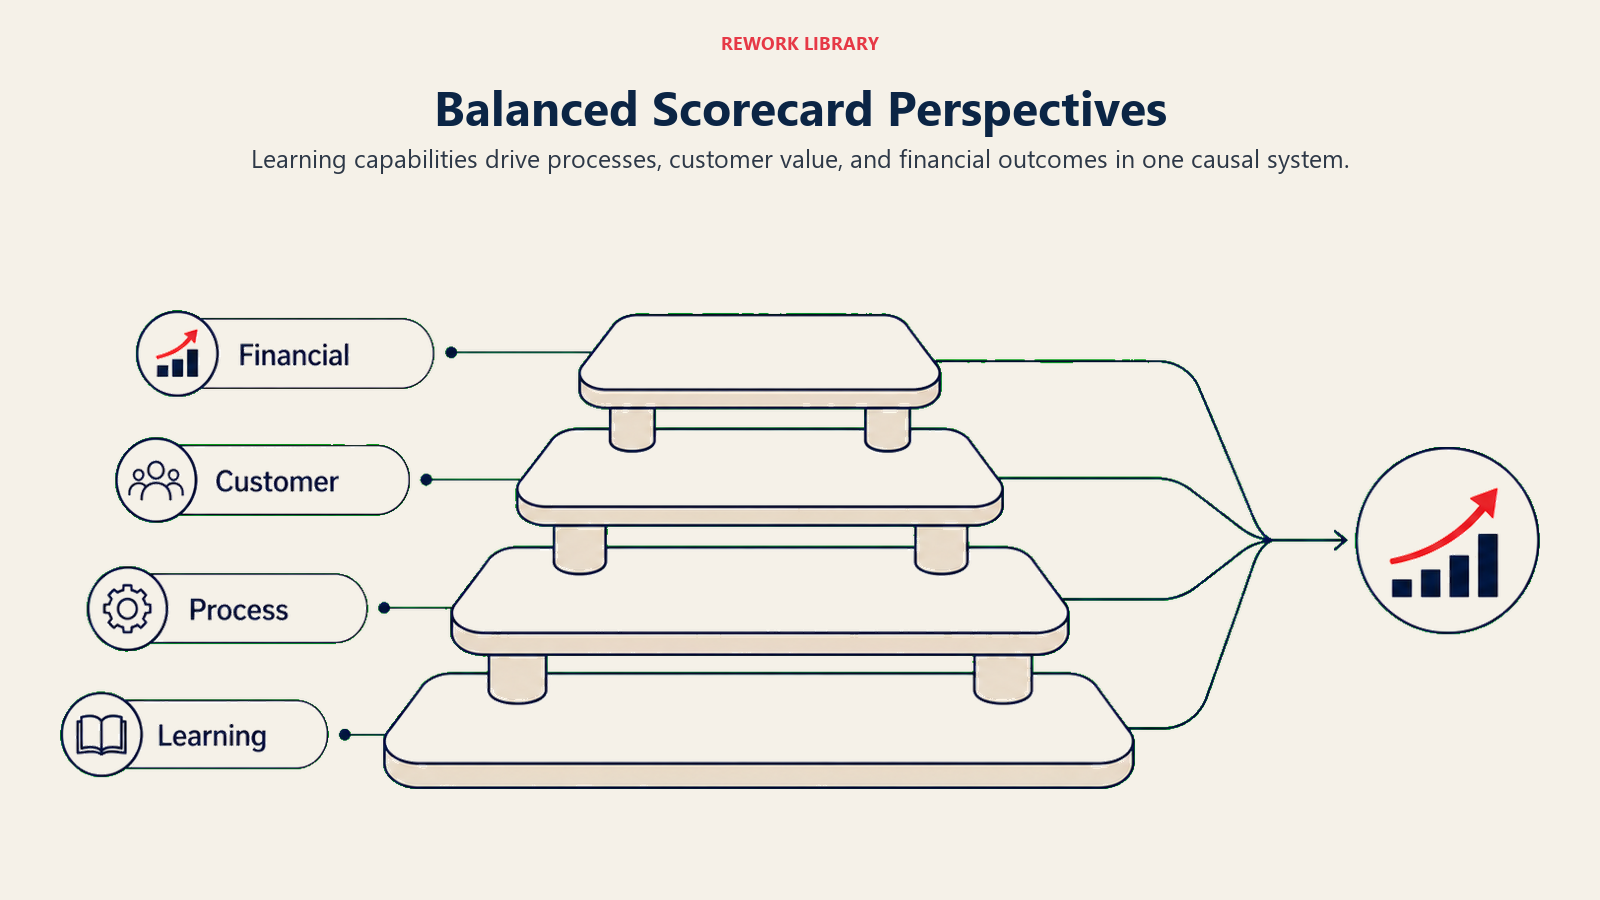
The four perspectives aren't arbitrary categories. They reflect a causal chain: your people and systems (L&G) enable better processes (Internal Process), better processes create customer value (Customer), and satisfied customers generate revenue (Financial). Strategy flows bottom-up, so weaknesses in L&G eventually erode financial results.
Financial perspective
The Financial perspective answers: How do we look to shareholders?
This is the perspective most companies already measure well. It captures the results of strategic execution in terms shareholders and boards care about directly.
Common KPIs for the Financial perspective:
- Revenue growth rate
- Gross margin percentage
- Return on invested capital (ROIC)
- Free cash flow
- Operating expense ratio
The Financial perspective is the destination. Everything below it is a driver.
Customer perspective
The Customer perspective answers: How do customers see us?
It measures the value you're delivering in the market. Strong customer metrics are leading indicators of future financial health. A rising Net Promoter Score (NPS) today typically precedes revenue growth 6-12 months later.
Common KPIs for the Customer perspective:
- Net Promoter Score (NPS)
- Customer retention rate
- Customer acquisition cost (CAC)
- Customer lifetime value (LTV)
- Time to first value (for software products)
Internal process perspective
The Internal process perspective answers: What must we excel at?
These are the operational workflows that deliver customer value. If your onboarding is slow or your support is inconsistent, the customer perspective will deteriorate. Internal process metrics help you catch operational failures early.
Common KPIs for the Internal Process perspective:
- Sales cycle length
- Product defect rate or bug escape rate
- Onboarding completion time
- First-call resolution rate
- Order fulfillment cycle time
Learning and growth perspective
The Learning and Growth (L&G) perspective answers: Can we continue to improve?
This is the foundation of the whole model. It covers your people, systems, and culture. If your team lacks skills or your tools are outdated, no amount of process improvement will compensate.
Common KPIs for the L&G perspective:
- Employee engagement score
- Training hours per employee per quarter
- Technology adoption rate (for new tools or platforms)
- Internal promotion rate
- Knowledge base coverage (for customer-facing teams)
How the 4 perspectives connect: the strategy map
Kaplan and Norton introduced the strategy map concept in their 2000 HBR article "Having Trouble with Your Strategy? Then Map It." A strategy map visualizes the cause-and-effect chains that link L&G objectives up through Internal Process, Customer, and Financial outcomes.
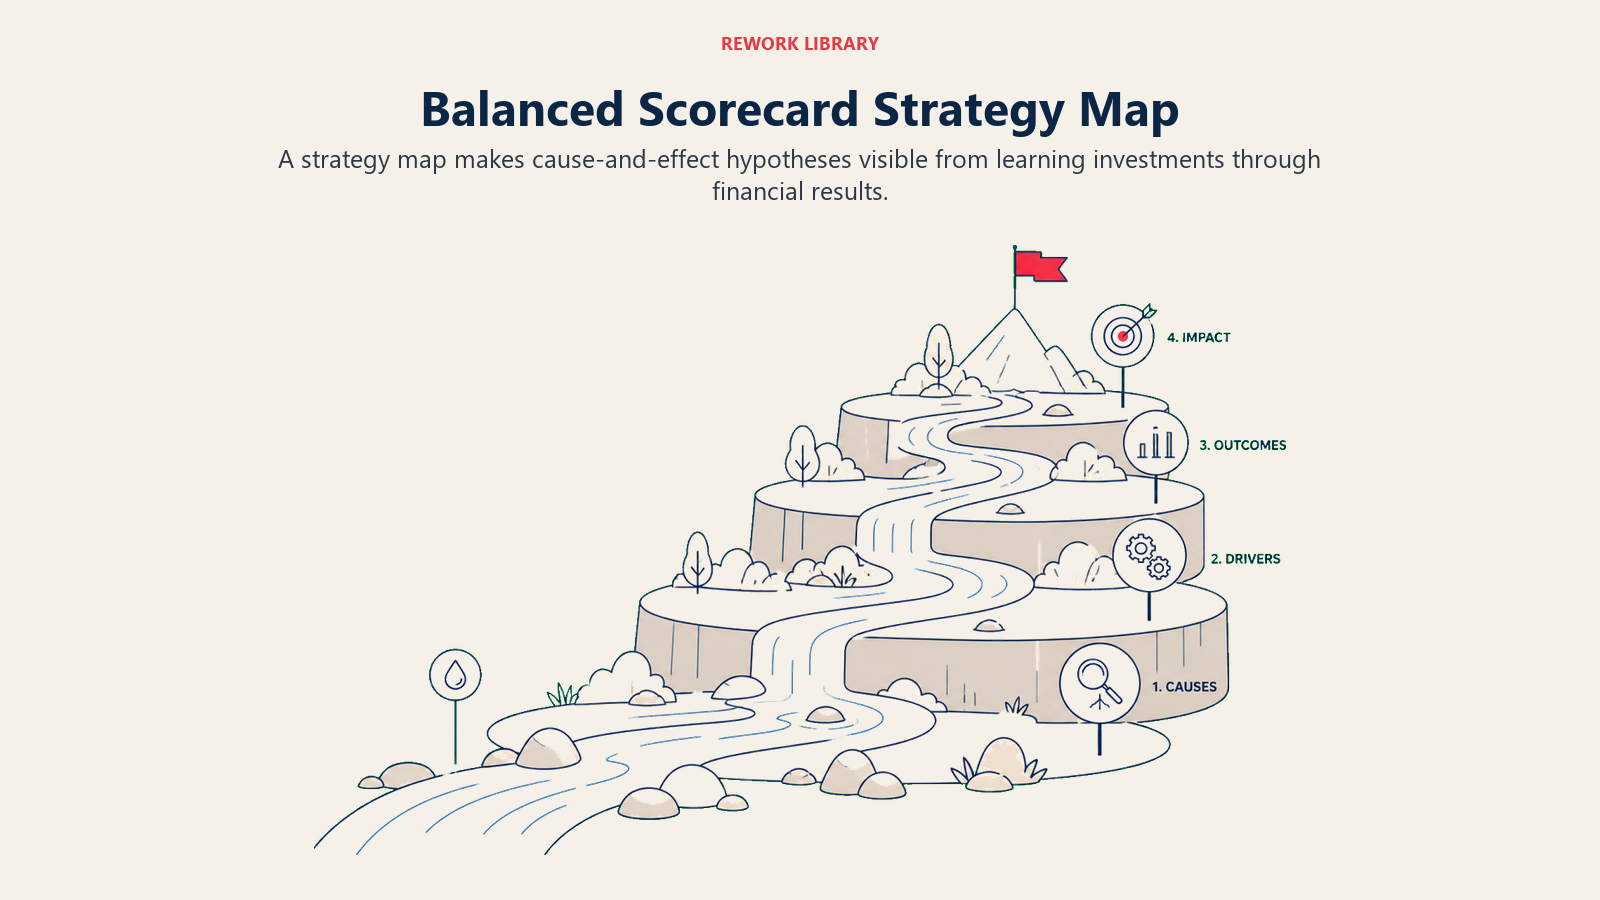
The logic works like this: if we invest in training product managers on artificial intelligence (AI) tools (L&G), they'll ship better features faster (Internal Process), which increases customer satisfaction and reduces churn (Customer), which drives revenue growth (Financial). Each arrow in the strategy map represents a tested hypothesis about how your organization creates value.
Without a strategy map, a balanced scorecard is just a collection of metrics. The map turns it into a testable theory of your business. That's what makes it a strategy tool, not just a reporting tool.
Strategy map example: a B2B SaaS company
Here's how a business-to-business (B2B) software-as-a-service (SaaS) company might build out a strategy map:
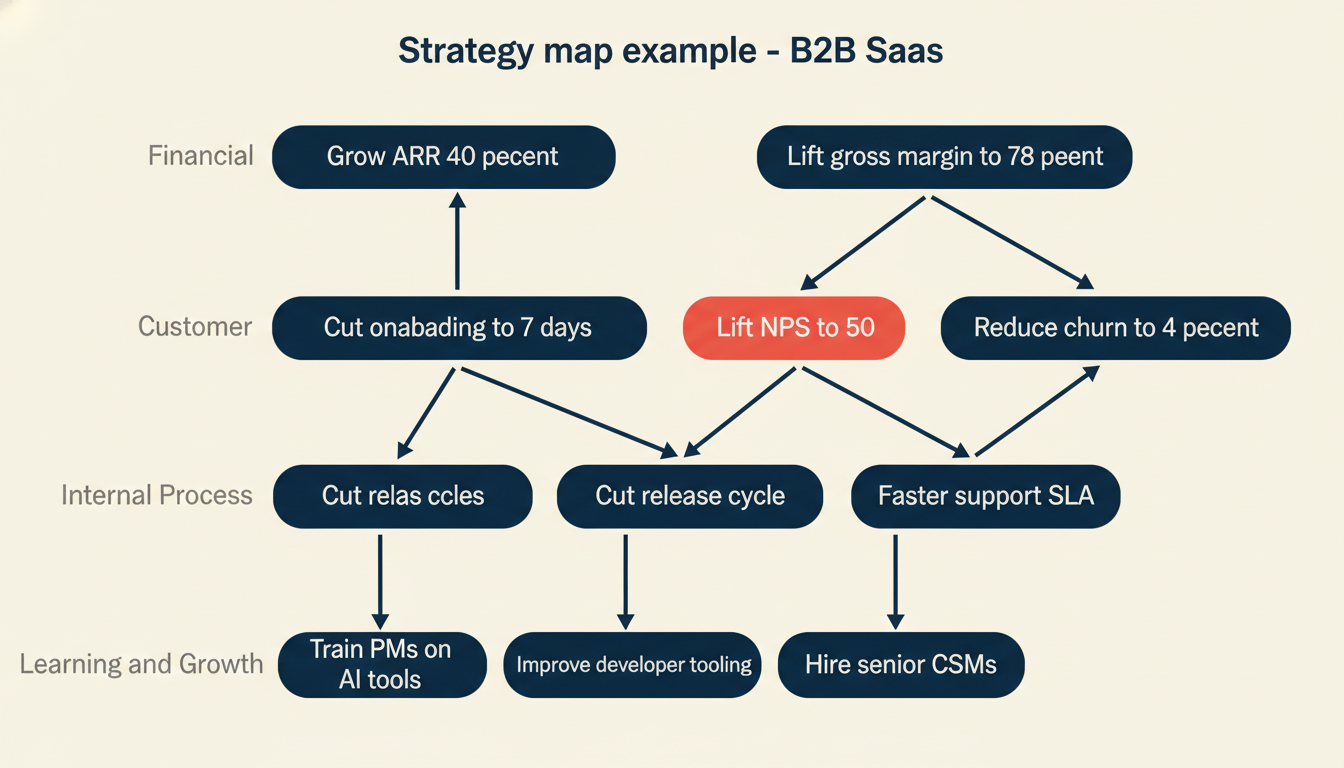
Financial (top): Grow annual recurring revenue (ARR) by 40% and lift gross margin to 78%.
Customer (drives financial): Lift NPS to 50 and reduce monthly churn to under 4%. These two customer outcomes directly determine ARR growth and renewal revenue.
Internal Process (drives customer): Cut onboarding time to 7 days, reduce the release cycle from 4 weeks to 2, and hit 95% of support tickets resolved within 4 hours. Faster onboarding reduces early churn. Shorter release cycles let the product improve faster. Better support lifts NPS.
Learning and Growth (drives internal process): Train product managers on AI tooling, upgrade developer infrastructure to reduce deploy friction, and hire 3 senior customer success managers (CSMs). These capabilities make the Internal Process targets reachable.
Every arrow in the map is a hypothesis. Quarterly reviews test whether the hypotheses hold. If faster onboarding isn't moving churn, you update the hypothesis and adjust the initiative.
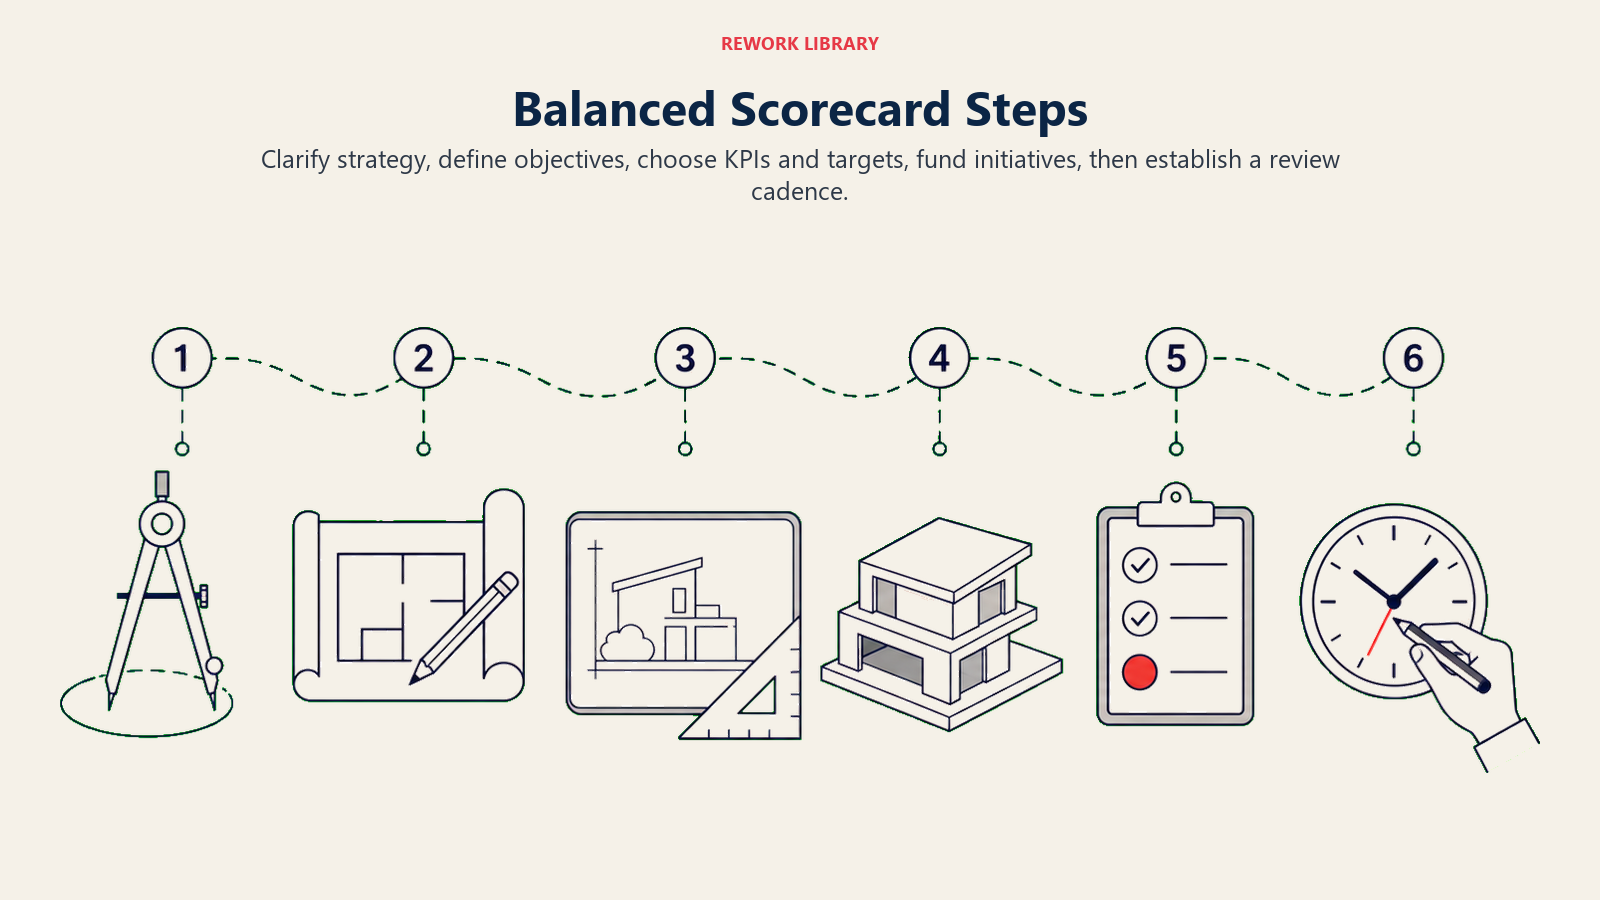
How to build a balanced scorecard in 6 steps
Step 1: Clarify your strategy
Before you pick a single KPI, you need a clear strategy statement. What's your competitive position? Who are you serving? What problem are you solving better than anyone else? The balanced scorecard doesn't generate strategy. It translates an existing strategy into measurable terms. If the strategy is vague, the scorecard will be vague.
A good starting point is to revisit your SWOT analysis or Porter's Five Forces analysis to ground your strategy in market reality.
Step 2: Define objectives for each perspective
For each of the four perspectives, write 3-5 objectives. Keep them outcome-focused and strategy-specific, not generic. "Improve customer satisfaction" is too vague. "Reduce churn by improving onboarding experience" is a real objective.
Use your SMART business objectives framework here. Each objective should be specific enough to own.
Step 3: Choose KPIs for each objective
For each objective, pick 1-2 KPIs that directly measure progress. More than 2 KPIs per objective creates noise. If you can't measure it within your current systems, either build the measurement capability or choose a proxy metric you can track now.
Aim for 15-25 KPIs total across the entire scorecard. Above 25 and the scorecard becomes a reporting burden rather than a strategic tool.
Step 4: Set targets
Each KPI needs a target and a time horizon. Targets should be stretch goals, not sandbagged ones. If the team is hitting every target every quarter, they're probably set too low.
Use your critical success factors (CSFs) work to validate that your targets align with what actually matters for strategy delivery.
Step 5: Identify initiatives
Initiatives are the projects, programs, or investments that will move the KPIs toward their targets. For each objective, name 1-3 specific initiatives with owners and timelines. This is where the scorecard connects to your operating plan and budget.
Step 6: Establish a review cadence
A balanced scorecard that doesn't get reviewed becomes a compliance document. Build monthly operational reviews (Internal Process and L&G metrics) and quarterly strategic reviews (all four perspectives) into the leadership calendar. The quarterly review is where you test your strategy map hypotheses and adjust.
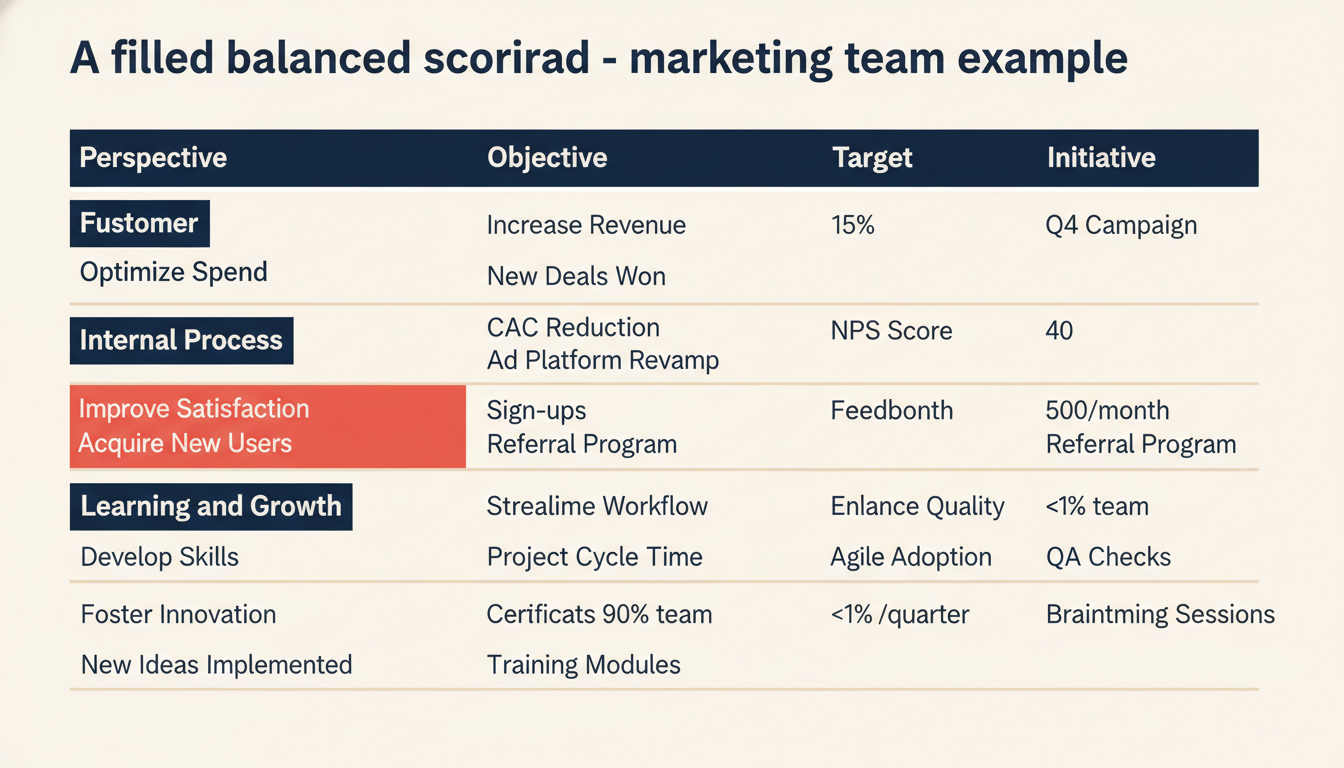
A filled scorecard: marketing team example
Here's how a B2B SaaS marketing team might fill out their balanced scorecard:
| Perspective | Objective | KPI | Target | Initiative |
|---|---|---|---|---|
| Financial | Grow pipeline contribution | Marketing-sourced pipeline ($) | $4M per quarter | Increase paid media budget by 30% |
| Financial | Improve campaign ROI | Cost per qualified opportunity | Under $800 | Consolidate ad spend to top 3 channels |
| Customer | Build brand authority | NPS for content engagement | 45+ | Launch weekly executive newsletter |
| Customer | Reduce CAC | Customer acquisition cost (CAC) | Down 15% YoY | Invest in SEO content at top of funnel |
| Internal Process | Improve lead quality | Marketing qualified lead (MQL) to sales qualified lead (SQL) conversion | Above 30% | Tighten lead scoring with sales team |
| Internal Process | Faster campaign execution | Time from brief to launch | Under 10 days | Standardize creative briefs and approval workflow |
| Learning and Growth | Build content capability | Articles published per month | 20 per month | Hire 2 senior content writers |
| Learning and Growth | Improve MarTech adoption | Active use of marketing automation platform | 90% of team | Run quarterly tool training sessions |
This scorecard gives the CMO a single view of whether the marketing function is executing strategy, not just producing activity.
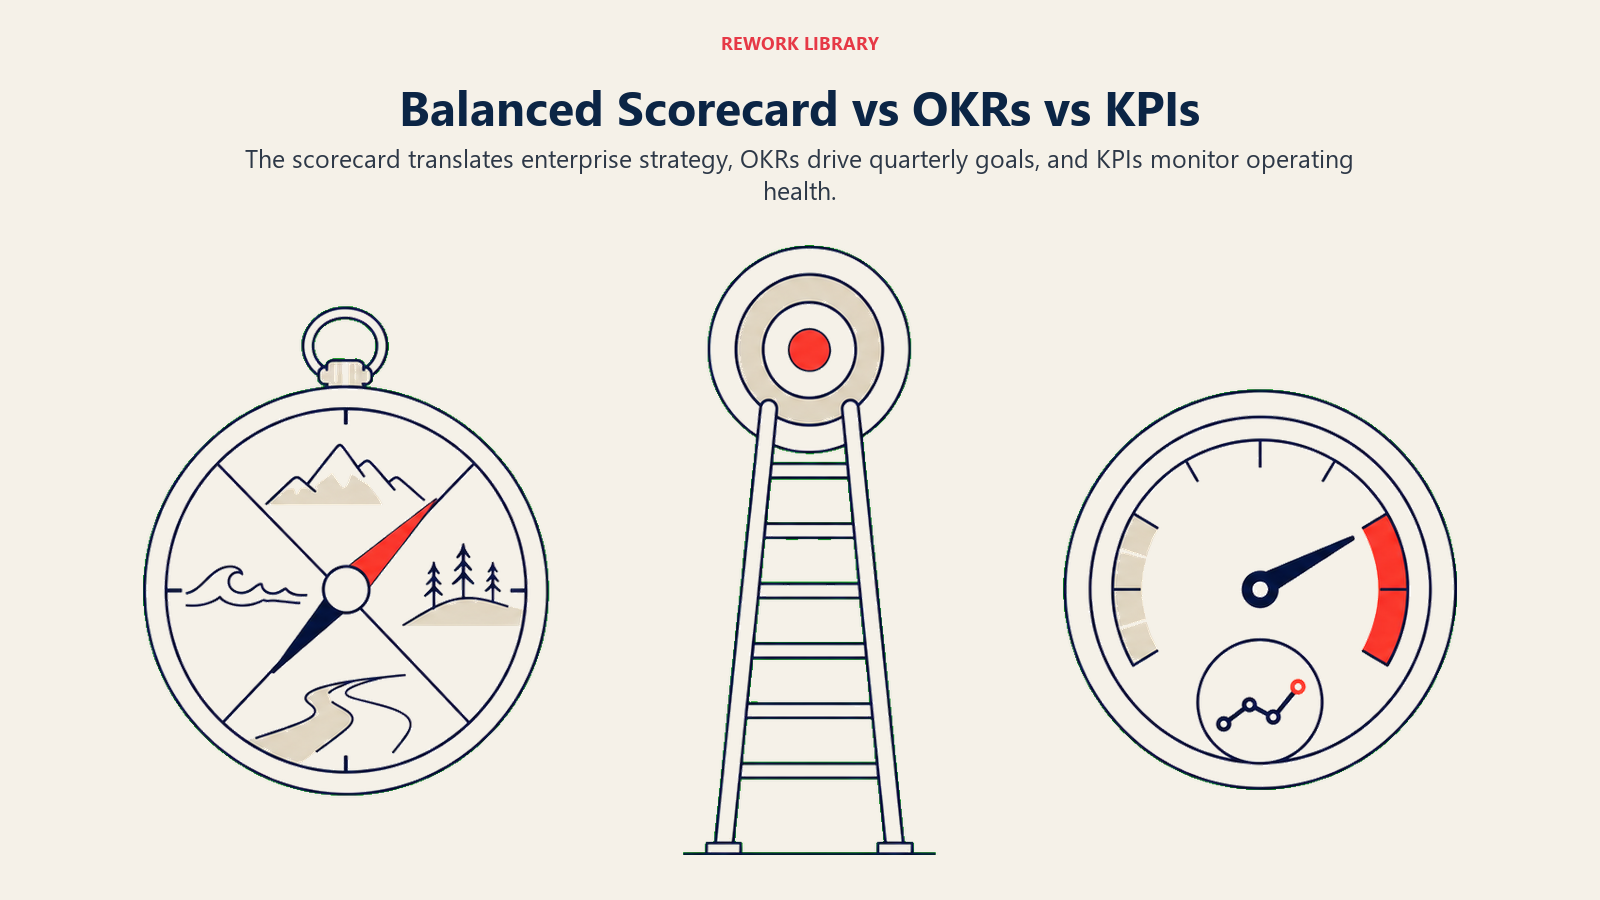
Balanced scorecard vs OKRs vs KPIs
Teams often confuse the balanced scorecard with objectives and key results (OKRs) and standalone KPIs. They're related but serve different purposes:
| Framework | Created by | Focus | Cadence | Best for |
|---|---|---|---|---|
| Balanced scorecard | Kaplan and Norton, 1992 | Strategy translation across 4 linked perspectives | Quarterly strategic, monthly operational | Organizations translating a multi-year strategy into measurable performance |
| OKRs (Objectives and Key Results) | Andy Grove at Intel, popularized by Google | Ambitious team-level goal setting | Quarterly | Teams and individuals setting stretch goals |
| KPIs (Key Performance Indicators) | Various, no single origin | Operational health metrics for specific functions | Weekly, monthly, or real-time | Monitoring ongoing operational performance |
The balanced scorecard is broader than OKRs in that it explicitly models cause-and-effect across the whole organization. OKRs are better for team-level execution sprints. Many organizations use both: the balanced scorecard at the company level, OKRs at the team level. Read more in the OKR framework article.
You can also compare the balanced scorecard against the business model canvas if you're deciding which strategic tool fits your current stage. The canvas is better for designing or reinventing the business model. The scorecard is better for executing a strategy you've already defined.
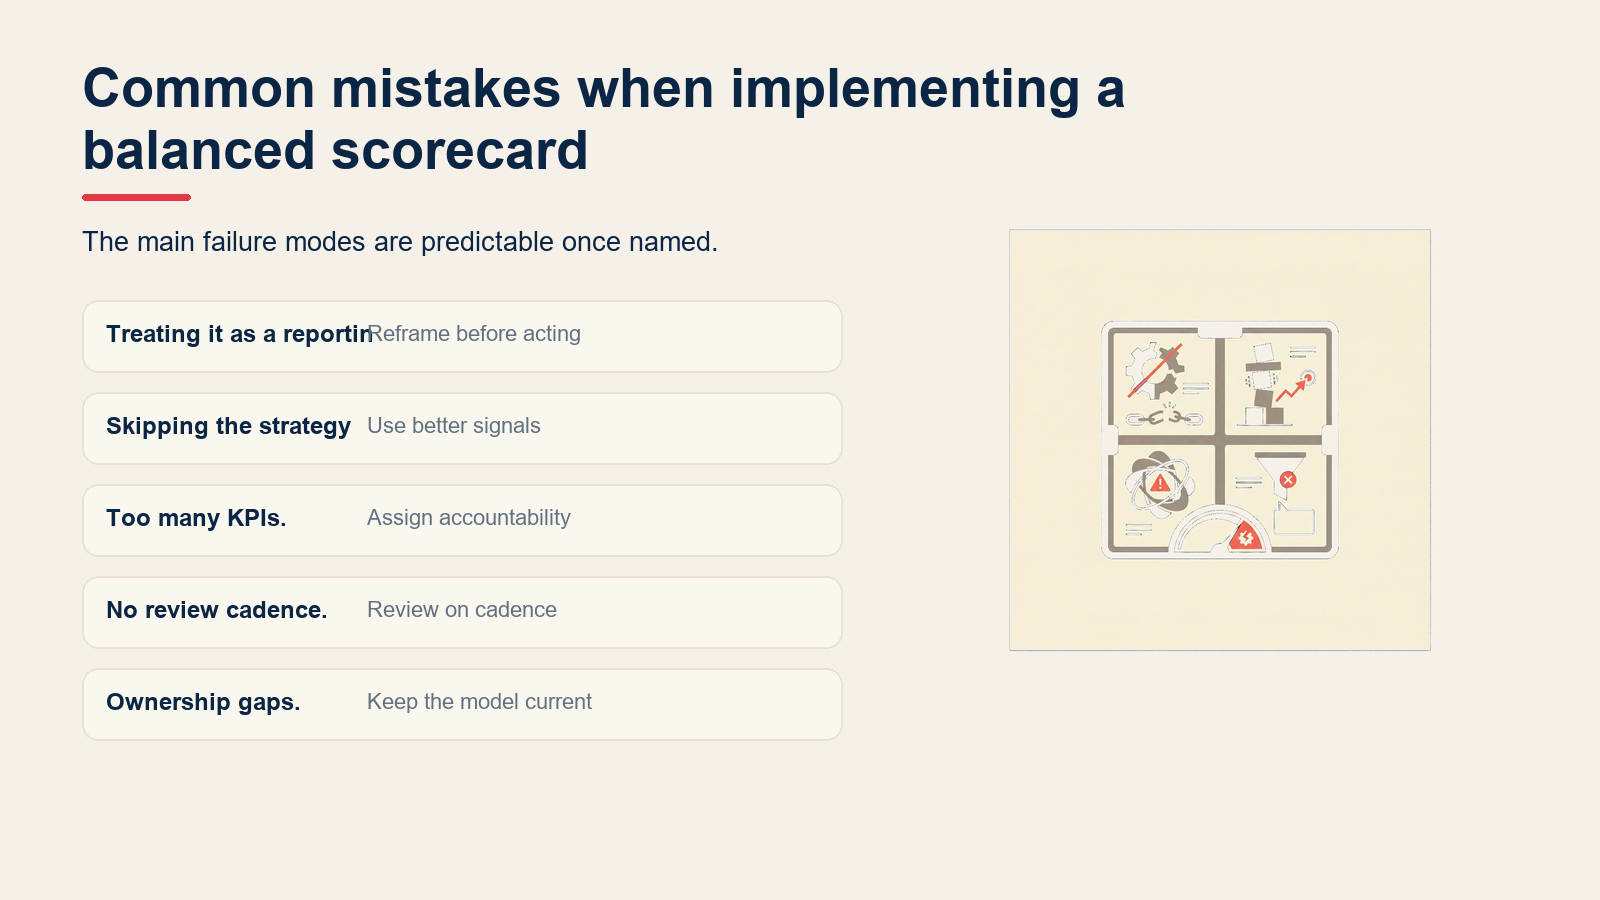
Common mistakes when implementing a balanced scorecard
- Treating it as a reporting exercise. The balanced scorecard is a strategy management system, not a dashboard. If no one is making decisions based on what the numbers say, it's not working.
- Skipping the strategy map. Without cause-and-effect logic connecting the perspectives, you end up with four isolated lists of metrics that don't inform each other.
- Too many KPIs. Organizations routinely add KPIs without removing old ones. Above 25 total, executives stop engaging with the scorecard in meaningful ways.
- No review cadence. A scorecard reviewed once a year is a snapshot. The value comes from quarterly hypothesis-testing and monthly operational monitoring.
- Ownership gaps. Every objective and KPI needs a named owner. Shared ownership means no ownership.
- Not connecting to incentives. If the scorecard says customer retention is a priority but sales compensation is purely on new logo acquisition, the incentive structure will win every time. Align rewards to the scorecard's priorities.
Also consider how the balanced scorecard complements other frameworks. Running a BCG matrix alongside your scorecard helps prioritize where to invest across business units. And if you're designing value propositions for the Customer perspective, the value proposition canvas is a practical companion tool.
Frequently Asked Questions about Balanced Scorecard
What's the difference between a balanced scorecard and a strategy map?
A balanced scorecard is the full system: four perspectives, each with objectives, KPIs, targets, and initiatives. A strategy map is a visual diagram of the cause-and-effect relationships between those objectives across the four perspectives. Think of the strategy map as the hypothesis and the balanced scorecard as the measurement system that tests it. You need both. The scorecard without the map is just a list of metrics. The map without the scorecard has no way to test whether the hypotheses are correct.
How many KPIs should each perspective have?
Kaplan and Norton originally recommended 4-7 KPIs per perspective, for a total of 15-25 across the full scorecard. In practice, fewer is better. Start with 3-5 per perspective and add only when you've confirmed a gap. Every KPI you add needs an owner, a data source, and a review process. Undisciplined KPI lists are one of the main reasons balanced scorecard implementations stall.
Are OKRs replacing the balanced scorecard?
No, but they serve different levels. OKRs are excellent for setting team-level quarterly goals and creating transparency around execution. The balanced scorecard operates at the organizational strategy level, modeling how capabilities and processes connect to financial outcomes over a multi-year horizon. Most companies that use OKRs well still benefit from a balanced scorecard at the top to ensure team-level OKRs are pointed in the right strategic direction. They're complementary, not competing.
Can a small company use the balanced scorecard?
Yes, though the implementation should be proportional. A 20-person startup doesn't need a formal quarterly strategic review committee. But the underlying discipline, tracking financial outcomes alongside customer satisfaction, operational metrics, and team capability, applies at any size. A simplified scorecard with 2-3 KPIs per perspective reviewed monthly by the leadership team is entirely workable for a small company. The goal is the same: stop flying on financial metrics alone and see the whole system. The balanced scorecard has survived 30 years of management fads because the underlying problem it solves has never gone away. Financial metrics alone can't tell you why performance is changing or what to do about it. The four perspectives give you a complete picture of how your organization creates value, from the skills of your team all the way to the revenue line.

Senior Operations & Growth Strategist
On this page
- What is the balanced scorecard?
- The 4 perspectives explained
- Financial perspective
- Customer perspective
- Internal process perspective
- Learning and growth perspective
- How the 4 perspectives connect: the strategy map
- Strategy map example: a B2B SaaS company
- How to build a balanced scorecard in 6 steps
- Step 1: Clarify your strategy
- Step 2: Define objectives for each perspective
- Step 3: Choose KPIs for each objective
- Step 4: Set targets
- Step 5: Identify initiatives
- Step 6: Establish a review cadence
- A filled scorecard: marketing team example
- Balanced scorecard vs OKRs vs KPIs
- Common mistakes when implementing a balanced scorecard