Resolución de problemas A3: el método Toyota (plantilla y ejemplo)
Turn this article into takeaways for your work.
Each assistant summarizes the article only for you and suggests best practices for your work.
La resolución de problemas A3 es como Toyota convirtió una hoja de papel en una disciplina de pensamiento. El nombre es literal: todo el análisis cabe en una sola hoja de tamaño A3 (11 x 17 pulgadas). Pero la hoja en realidad es solo la superficie visible de una conversación estructurada que corre desde el momento en que aparece un problema hasta el punto en que se confirma que la solución se mantiene.
Qué es la resolución de problemas A3
La resolución de problemas A3 es un método originado en Toyota que captura todo un ciclo de resolución de problemas, desde el contexto hasta la causa raíz y la verificación de seguimiento, en una sola hoja de tamaño A3 (11 x 17 pulgadas), siguiendo el ciclo plan-do-check-act (PDCA).
Toyota desarrolló el formato A3 en sus plantas de producción a mediados del siglo XX como una forma de estandarizar cómo se comunicaban los problemas a lo largo de la cadena de mando. Antes del A3, los ingenieros escribían reportes extensos que enterraban la pregunta clave y retrasaban las decisiones. El A3 obligó a los equipos a pensar con claridad: si no puede resumir toda la historia en una página, todavía no entiende el problema.
El formato se expandió más allá de la manufactura conforme el pensamiento lean llegó a la salud, el software, las finanzas y las operaciones gubernamentales. Hoy se usa en cualquier lugar donde los equipos quieran un análisis de problemas estructurado, compacto y visual.
Datos clave
- Toyota reconoce el A3 como una de las herramientas centrales que sostuvo su sistema de producción lean durante décadas, y sus materiales de capacitación internos lo describen como el "documento de pensamiento" detrás de cada mejora (Toyota Production System, 2019).
- Un estudio publicado en el Journal of Manufacturing Technology Management (2021) encontró que los equipos que usaban reportes estructurados de una página redujeron el tiempo de resolución en un promedio de 28% comparado con los reportes de incidentes de formato libre.
- El Lean Enterprise Institute coloca la resolución de problemas A3 como la principal herramienta de mentoría y coaching para desarrollar pensadores lean, usada en más del 60% de los programas de certificación lean encuestados en 2022.
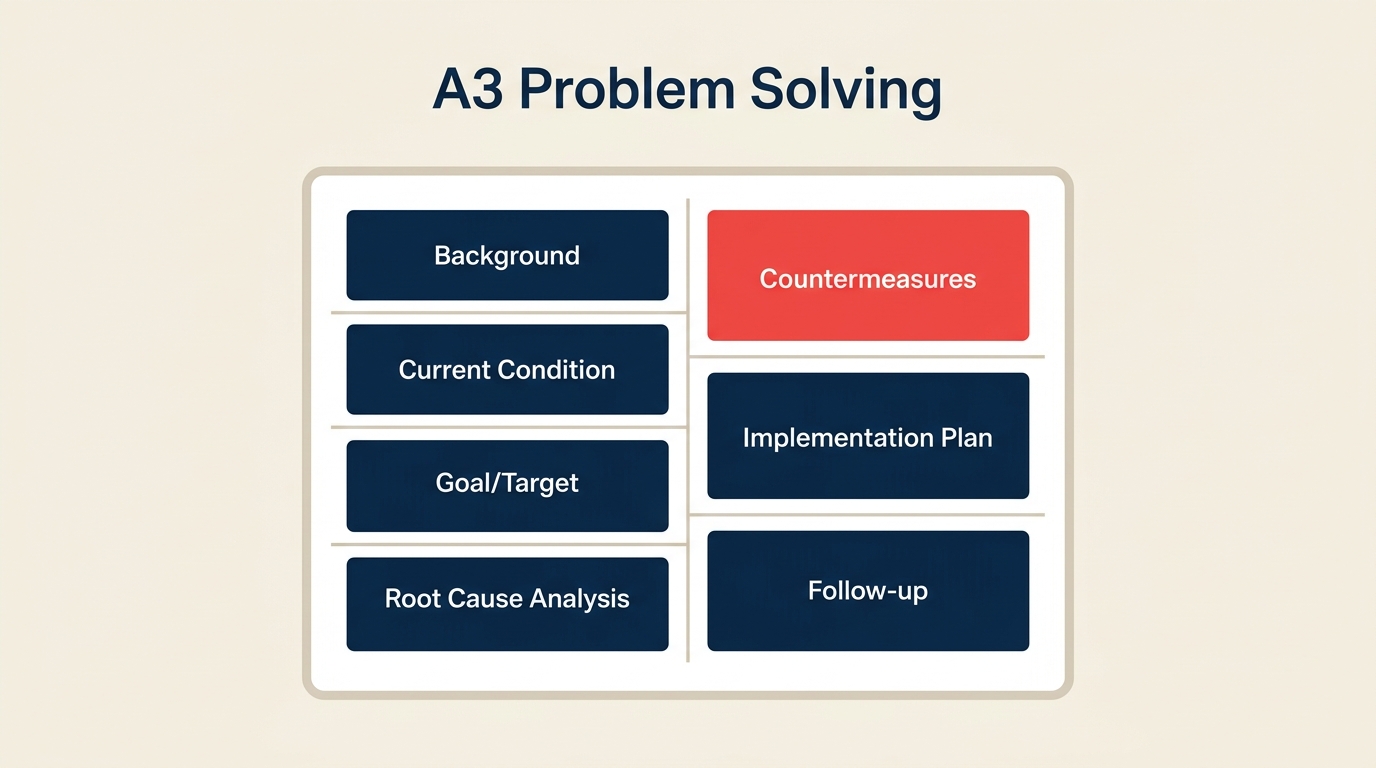
Las 7 secciones de un reporte A3
Todo reporte A3 sigue la misma estructura. La mitad izquierda cubre el problema (Plan); la mitad derecha cubre la respuesta (Do, Check, Act). A continuación, las siete secciones y qué contiene cada una.
| Sección | Qué contiene | Fase de PDCA |
|---|---|---|
| 1. Contexto | Por qué este problema importa ahora: contexto de negocio, qué proceso se ve afectado, quiénes son las partes interesadas | Plan |
| 2. Estado actual | Descripción cuantificada del problema: datos, mapas de proceso, tasas de fallo, impacto en el cliente | Plan |
| 3. Objetivo | Un estado meta específico y medible: cómo se ve "resuelto" en números y para cuándo | Plan |
| 4. Análisis de causa raíz | El porqué detrás del problema: diagramas de espina de pescado, cinco porqués o árboles de fallas | Plan |
| 5. Contramedidas | Acciones propuestas vinculadas directamente a las causas raíz, con responsable y tiempos | Do |
| 6. Plan de implementación | Quién hace qué, para cuándo, con indicadores adelantados para monitorear durante el despliegue | Do |
| 7. Seguimiento | Confirmación de que las contramedidas funcionaron: revisión de métricas, lecciones aprendidas, próximos pasos si los resultados quedan cortos | Check + Act |
La disciplina del A3 está en la restricción. Si una sección necesita tres páginas de datos de respaldo, el equipo todavía no ha destilado el insight. El objetivo es forzar esa destilación antes de que alguien empiece a construir soluciones.
A3 frente a otros métodos de resolución de problemas
A3 es uno de varios enfoques estructurados a los que recurren los equipos. Así se compara con las alternativas más comunes:
| Método | Mejor para | Profundidad de análisis | Formato de salida | Tiempo para completar |
|---|---|---|---|---|
| A3 | Problemas de proceso recurrentes, entornos lean, escenarios de coaching | Moderada a profunda | Reporte visual de una sola página | Días a semanas |
| Resolución de problemas 8D | Defectos de cara al cliente, industrias reguladas, calidad de proveedores | Profunda | Reporte estructurado de 8 disciplinas | Días a semanas |
| Cinco Porqués | Causa raíz simple a moderada, sesiones rápidas de equipo | Ligera a moderada | Cadena de causa y efecto | Horas a días |
| DMAIC | Proyectos de mejora de procesos complejos y con muchos datos | Muy profunda | Carpeta completa de proyecto | Semanas a meses |
El A3 se ubica en una zona intermedia práctica. Es más riguroso que una sesión de Cinco Porqués porque exige establecer objetivos y hacer seguimiento, pero es menos pesado que el DMAIC, que requiere gestión estadística de proyecto y un patrocinador definido. Cuando un equipo lean se encuentra con un problema recurrente que no ha resuelto en dos intentos previos, el A3 suele ser el siguiente paso correcto.
Cómo completar un A3
Completar un A3 sigue las cuatro fases del PDCA. La hoja en sí es el artefacto, pero el pensamiento ocurre en conversaciones entre quien la escribe y un coach o gerente.
Paso 1: Escribir el contexto (Plan)
Empiece por responder por qué este problema merece atención ahora. Incluya el proceso afectado, las partes interesadas a quienes les importa y una conexión de una sola frase con los objetivos de negocio. Manténgalo en tres a cinco frases. Si no puede escribir un contexto breve, el alcance del problema todavía no está claro.
Paso 2: Mapear el estado actual (Plan)
Muestre el problema con datos, no con opiniones. Dibuje los pasos relevantes del proceso (un flujo simple o un carril de proceso), marque dónde ocurre el fallo e incluya los números: frecuencia, tasa de defectos, costo, quejas de clientes. Un estado actual construido sobre datos reales evita que el equipo resuelva el síntoma en lugar de la causa.
Paso 3: Fijar un objetivo específico (Plan)
Defina la condición meta en términos medibles. "Reducir los errores de ingreso de pedidos de 4.2% a menos de 0.5% para el 31 de agosto." Un objetivo vago ("arreglar el problema de errores") hace imposible evaluar si las contramedidas funcionaron. El objetivo también establece la línea base para la sección de seguimiento.
Paso 4: Analizar la causa raíz (Plan)
Esta es la sección que más tiempo consume. Empiece con un diagrama de espina de pescado para organizar las posibles categorías de causa (método, máquina, material, mano de obra, medición, entorno). Luego profundice en las causas más plausibles con la técnica de los cinco porqués. El objetivo es llegar a una causa raíz que, si se atiende, evite la recurrencia, no solo arregle este caso puntual. Verifique de forma cruzada con los principios de análisis de causa raíz para confirmar que ha profundizado lo suficiente.
Paso 5: Desarrollar contramedidas (Do)
Para cada causa raíz confirmada, escriba una contramedida: una acción específica, quién es responsable y cuándo estará completa. Las contramedidas todavía no son soluciones; son hipótesis. Las verificará en el seguimiento. Vincule cada contramedida explícitamente con su causa raíz para que la lógica sea rastreable.
Paso 6: Construir el plan de implementación (Do)
Convierta las contramedidas en un plan de acción simple: tareas, responsables y fechas límite. Incluya los indicadores adelantados que monitoreará durante el despliegue. Un buen plan de implementación cabe en una tabla de seis a ocho filas en el lado derecho del A3.
Paso 7: Confirmar los resultados (Check + Act)
Una vez que las contramedidas están implementadas, mida contra el objetivo que fijó en el Paso 3. ¿Bajó la tasa de error de 4.2% a menos de 0.5%? Si es así, documente las lecciones aprendidas y considere estandarizar la solución. Si no, el A3 regresa al ciclo: refine el análisis de causa raíz y ajuste las contramedidas. Esta es la fase Act del PDCA, y es lo que separa un A3 completado de uno abandonado.
Ejemplo de resolución de problemas A3
Aquí tiene un A3 condensado para un escenario del mundo real que podría enfrentar una operación de manufactura mediana.
Contexto. El departamento de envíos está generando un alto volumen de quejas de clientes por artículos incorrectos en los pedidos. Esto afecta las puntuaciones de satisfacción del cliente y genera costos de reenvío. El gerente de operaciones y el equipo de cuentas son las principales partes interesadas.
Estado actual. La precisión de picking de pedidos se midió en 93.1% durante los últimos 90 días. El SLA objetivo es 99.5%. Cada envío incorrecto cuesta aproximadamente $85 en reenvío y manejo. El error se concentra en el turno de la tarde, particularmente en pedidos con más de cinco líneas de artículos.
Objetivo. Alcanzar 99.5% de precisión de picking en todos los pedidos para el fin del tercer trimestre, reduciendo los costos de reenvío en al menos 80%.
Análisis de causa raíz. Los Cinco Porqués revelaron que los operarios de picking usan una lista de picking impresa una vez por turno, así que si un pedido se actualiza después de la impresión, el operario trabaja con datos desactualizados. La causa raíz ascendente es que el sistema de gestión de almacén no envía actualizaciones en tiempo real a los operarios. El diagrama de espina de pescado señaló la misma brecha del sistema bajo "método."
Contramedidas.
- Reemplazar las listas de picking en papel por un sistema basado en tabletas que muestre datos de pedidos en tiempo real (TI, en 6 semanas).
- Agregar un escaneo de verificación en la estación de empaque antes de sellar (Supervisor de Almacén, en 2 semanas).
Plan de implementación. Piloto de tabletas con cuatro operarios a partir de la semana 1; despliegue completo en la semana 5; escaneo en estación de empaque activo desde la semana 2; reporte diario de precisión desde la semana 1.
Seguimiento. En la semana 8, la precisión de picking se midió en 99.7%, por encima del objetivo de 99.5%. Los costos de reenvío cayeron 87%. Lecciones aprendidas: los procesos de picking basados en papel son un riesgo sistémico cuando los pedidos cambian con frecuencia. Estándar a futuro: todas las operaciones de picking usan listas digitales en tiempo real.
Errores comunes
Saltar a las contramedidas antes de completar el análisis de causa raíz. El modo de fallo más común. Los equipos ven el problema, conocen una solución que funcionó antes y llenan el recuadro de contramedidas antes de hacer el análisis. El resultado es un arreglo superficial que no evita la recurrencia.
Escribir el A3 en solitario. El A3 está diseñado para ser una conversación de coaching entre el dueño del problema y un pensador lean más experimentado. Escribirlo de forma aislada elimina el desafío que afila el pensamiento. Incorpore al menos dos puntos de revisión: uno después del estado actual y otro después de la causa raíz.
Fijar un objetivo vago. "Mejorar el proceso" no es un objetivo. Sin una meta específica y medible, no hay forma de confirmar si las contramedidas funcionaron.
Omitir el seguimiento. Las fases de check y act son donde se cierra el ciclo de PDCA. Los equipos que tratan el A3 como terminado una vez que se despliegan las contramedidas se pierden el paso más importante: la verificación de que el cambio realmente se mantuvo.
Hacerlo demasiado largo. Si el A3 supera una página, el equipo no ha simplificado lo suficiente el análisis. Más páginas señalan confusión, no exhaustividad.
Mejores prácticas
Mantenga el A3 visible durante el proyecto. Publíquelo en el área de trabajo o compártalo en un documento compartido. Se convierte en el modelo mental compartido del equipo y en un punto de referencia para las conversaciones diarias de standup.
Use visuales simples en lugar de texto denso. El estado actual se muestra mejor con un boceto del proceso que descrito en párrafos. Las causas raíz se entienden mejor en un diagrama de espina de pescado que en una lista con viñetas. El formato A3 fue diseñado para la comunicación visual.
Escriba primero a lápiz. El A3 es un documento vivo durante la fase Plan. Su comprensión del problema cambiará conforme reúna datos. Trate los primeros borradores como hipótesis, no como análisis terminado.
Combine el A3 con herramientas de calidad relacionadas. El diagrama de afinidad ayuda a organizar retroalimentación no estructurada en temas para el estado actual. Las siete herramientas de calidad (hojas de verificación, diagramas de Pareto, gráficos de control, histogramas, diagramas de dispersión, espina de pescado y diagramas de flujo) se mapean directamente a diferentes secciones del A3.
Rastree las tasas de finalización de A3 a lo largo del tiempo. Los equipos que completan las secciones de seguimiento de forma consistente desarrollan habilidades de causa raíz más sólidas que los que se detienen en las contramedidas. Haga del seguimiento un punto estándar en la agenda de las revisiones mensuales de operaciones.
Preguntas frecuentes
¿Qué significa A3? A3 se refiere al tamaño de papel ISO: 297 x 420 mm, o aproximadamente 11 x 17 pulgadas en dimensiones estadounidenses. Toyota eligió este tamaño porque era la hoja más grande que se podía enviar por fax internacionalmente durante la época en que se desarrolló el formato. La restricción fue práctica, no teórica, pero se convirtió en una disciplina útil.
¿La resolución de problemas A3 es solo para manufactura? No. El formato A3 se usa en salud (incidentes de seguridad del paciente), desarrollo de software (análisis de errores y fallos del sistema), operaciones gubernamentales e industrias de servicios. Cualquier equipo que necesite una forma estructurada y compacta de comunicar un problema y su resolución puede usarlo. El origen en la manufactura lean hace que parte del vocabulario se sienta industrial, pero la estructura de pensamiento es universal.
¿En qué se diferencia el A3 de un análisis de causa raíz estándar? Un análisis de causa raíz estándar se enfoca en encontrar la causa de un problema. Un A3 integra el análisis de causa raíz dentro de un ciclo más amplio que incluye contexto, definición de objetivos, diseño de contramedidas, planificación de implementación y verificación de seguimiento. El A3 es el ciclo completo de PDCA; el análisis de causa raíz es una fase dentro de él.
¿Cuánto tiempo toma completar un A3? Depende de la complejidad del problema. Un problema operativo sencillo con datos claros podría tomar de dos a tres días. Un problema multifuncional con múltiples causas contribuyentes puede tomar de dos a tres semanas de recopilación de datos, análisis y ciclos de revisión. La implementación de contramedidas y la medición de seguimiento agregan tiempo adicional más allá del documento en sí.
¿Se necesita software especial para crear un A3? No. Los reportes A3 se crean comúnmente en PowerPoint, Word, Excel o incluso a mano en papel. Lo que importa es la estructura de pensamiento, no la herramienta. Algunas organizaciones usan software de gestión lean con plantillas de A3, pero una diapositiva horizontal en blanco dividida en siete secciones funciona igual de bien.
La resolución de problemas A3 funciona porque la restricción crea la disciplina. Cuando no hay límite de palabras, los equipos agregan complejidad. Cuando el análisis tiene que caber en una página, los equipos se ven obligados a entender qué es lo que realmente importa. Construya el hábito de completar la sección de seguimiento y encontrará que cada A3 afina el siguiente: las causas raíz que descubre se convierten en patrones, y los patrones se convierten en conocimiento institucional sobre dónde fallan sus procesos y por qué.

Senior Operations & Growth Strategist
On this page
- Qué es la resolución de problemas A3
- Las 7 secciones de un reporte A3
- A3 frente a otros métodos de resolución de problemas
- Cómo completar un A3
- Paso 1: Escribir el contexto (Plan)
- Paso 2: Mapear el estado actual (Plan)
- Paso 3: Fijar un objetivo específico (Plan)
- Paso 4: Analizar la causa raíz (Plan)
- Paso 5: Desarrollar contramedidas (Do)
- Paso 6: Construir el plan de implementación (Do)
- Paso 7: Confirmar los resultados (Check + Act)
- Ejemplo de resolución de problemas A3
- Errores comunes
- Mejores prácticas
- Preguntas frecuentes